Article Text

Abstract
Objectives Bone loss remains a primary health concern for astronauts, despite in-flight exercise. We examined changes in bone microarchitecture, density and strength before and after long-duration spaceflight in relation to biochemical markers of bone turnover and exercise.
Methods Seventeen astronauts had their distal tibiae and radii imaged before and after space missions to the International Space Station using high-resolution peripheral quantitative CT. We estimated bone strength using finite element analysis and acquired blood and urine biochemical markers of bone turnover before, during and after spaceflight. Pre-flight exercise history and in-flight exercise logs were obtained. Mixed effects models examined changes in bone and biochemical variables and their relationship with mission duration and exercise.
Results At the distal tibia, median cumulative losses after spaceflight were −2.9% to −4.3% for bone strength and total volumetric bone mineral density (vBMD) and −0.8% to −2.6% for trabecular vBMD, bone volume fraction, thickness and cortical vBMD. Mission duration (range 3.5–7 months) significantly predicted bone loss and crewmembers with higher concentrations of biomarkers of bone turnover before spaceflight experienced greater losses in tibia bone strength and density. Lower body resistance training volume (repetitions per week) increased 3–6 times in-flight compared with pre-spaceflight. Increases in training volume predicted preservation of tibia bone strength and trabecular vBMD and thickness.
Conclusions Findings highlight the fundamental relationship between mission duration and bone loss. Pre-flight markers of bone turnover and exercise history may identify crewmembers at greatest risk of bone loss due to unloading and may focus preventative measures.
- bone
- exercise
- osteoporosis
- biomechanics
- biochemistry
Data availability statement
No data are available.
This is an open access article distributed in accordance with the Creative Commons Attribution Non Commercial (CC BY-NC 4.0) license, which permits others to distribute, remix, adapt, build upon this work non-commercially, and license their derivative works on different terms, provided the original work is properly cited, appropriate credit is given, any changes made indicated, and the use is non-commercial. See: http://creativecommons.org/licenses/by-nc/4.0/.
Statistics from Altmetric.com
Introduction
Long-duration spaceflight poses a risk to astronauts’ bone health, particularly weight-bearing bones. During typical 6-month missions to the International Space Station (ISS), rate of lower limb bone loss is 0.8% (0.5%–1.0%) per month.1 2 Thus, bone loss during a 6-month spaceflight parallels that experienced by elderly men and women over a decade of ageing on Earth.3 Given longer space explorations planned in the future (eg, missions to Mars), we need to better understand how microgravity alters bone structure and affects fracture risk in order to mitigate bone atrophy.
In microgravity, unloading primarily affects weight-bearing skeletal regions accustomed to higher strains from daily living in 1g.1 Given bone tissue’s mechanosensitive nature, bone adapts its structure and strength to match the localised mechanical loading environment.4–6 Despite in-flight countermeasures including near-daily exercise aboard the ISS using a treadmill, cycle ergometer and Advanced Resistance Exercise Device (ARED), microgravity imbalances bone metabolism such that bone resorption predominates and the skeleton deteriorates.7 ARED deployed on ISS in 2008 and allows 17 resistance exercises that mimic Earth conditions. ARED use reduces astronaut bone atrophy through increased bone formation; however, the stimulus has not prevented bone loss in every astronaut.7
Spaceflight-induced bone loss has traditionally been studied using dual-energy X-ray absorptiometry (DXA), an imaging modality measuring areal bone mineral density (aBMD). DXA enhanced our understanding of gross bone loss from spaceflight; however, it cannot detect bones’ finer structures (microarchitecture) that underpin changes in bone strength.8 High-resolution peripheral quantitative CT (HR-pQCT) images trabecular and cortical bone microarchitecture in vivo at a resolution finer than a human hair (61 µm),9 allowing sensitive characterisation of how bone adapts to microgravity.2 The objectives of this study were to: (1) examine the effect of long-duration spaceflight on bone microarchitecture, density and strength at the distal tibia and radius, and (2) determine the relationships between mission duration, biochemical markers of bone turnover and pre-flight and in-flight exercise on changes in bone morphology.
Methods
Study design
We recruited 17 astronauts from the National Aeronautics and Space Administration (NASA), Canadian Space Agency, European Space Agency (ESA) and Japan Aerospace Exploration Agency (JAXA) selected for 3.5–7 months ISS missions. Astronauts were provided 800 IU vitamin D3 supplements daily during flight.
Outcomes
Primary outcome variables (online supplemental document S1) were HR-pQCT (60.7 µm nominal isotropic resolution, XtremeCT II; Scanco Medical) measurements of bone microarchitecture, volumetric bone mineral density (vBMD) and strength at the bilateral distal radii and tibiae (four sites) before and after spaceflight.9–12 We manually scored motion artefact on a scale from 1 (no motion) to 5 (discontinuities in the cortical shell and significant blurring of the periosteal surface).13 Scans with motion >3 were excluded from analyses. We performed three-dimensional (3D) image registration to ensure the same bone volume was assessed at each time point (figure 1).14 15 Morphological measures included total vBMD (Tt.vBMD; mg HA/cm3) and trabecular vBMD (Tb.vBMD; mg HA/cm3), trabecular bone volume fraction (BV/TV; %), trabecular number (Tb.N; 1/mm), trabecular thickness (Tb.Th; mm) and trabecular separation (Tb.Sp; mm); cortical vBMD (Ct.vBMD; mg HA/cm3), cortical thickness (Ct.Th, mm) and cortical porosity (Ct.Po; %).11 12 Failure load (F.Load; N) was estimated by finite element analysis on unregistered images (FAIM, V.8.0, Numerics88 Solutions).16 Reproducibility in our laboratory ranges from <3% for density and microarchitecture to <14% for Ct.Po.17 aBMD (g/cm2) of the femoral neck (FN), total hip (TH) and lumbar spine (LS) were acquired pre-flight and post-flight using DXA (Hologic QDR Discovery).7 Scans were conducted at NASA’s Johnson Space Center (JSC) Bone and Mineral Laboratory and for one crewmember at the European Astronaut Center and German Aerospace Centre . Precision at JSC is <4% for FN, TH and LS.7
Supplemental material
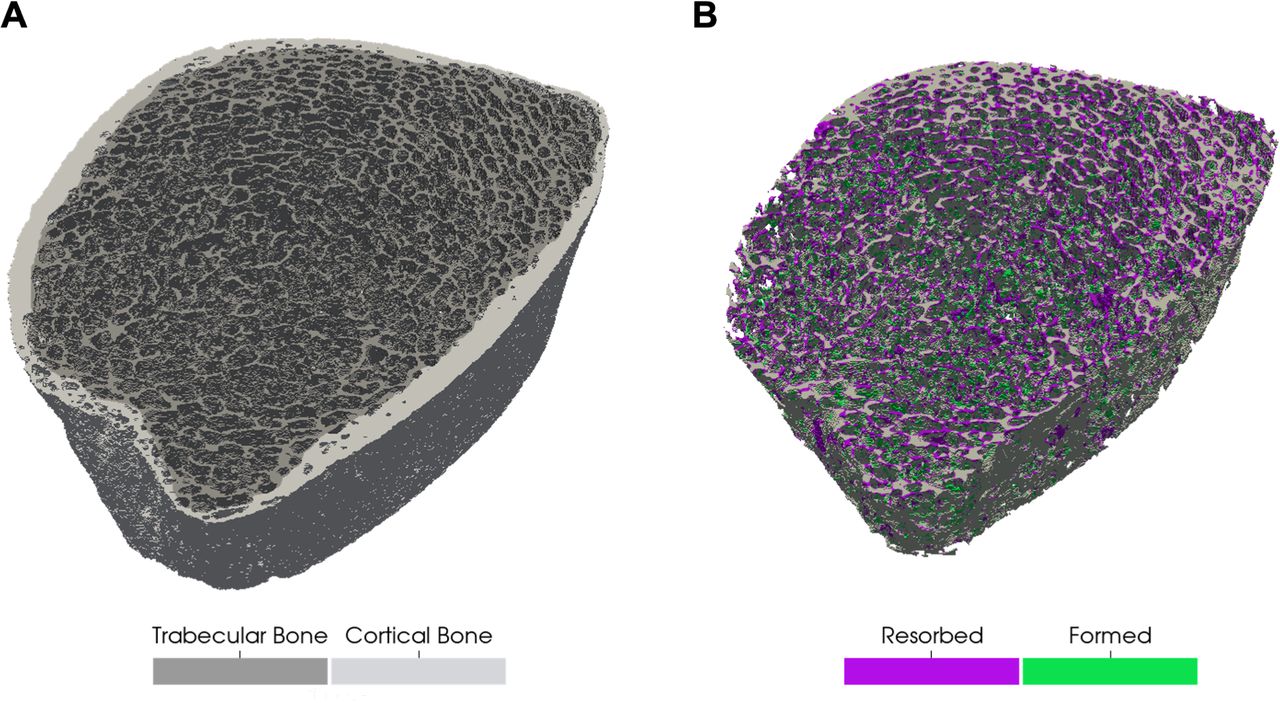
(A) Three-dimensional image of the distal tibia depicting trabecular (dark grey) and cortical bone (light grey) prior to spaceflight. (B) Visualisation of trabecular bone resorption (purple) and formation (green) after spaceflight. Image is from representative male crewmember who experienced a 4% decline in trabecular vBMD and 3% decline in trabecular thickness. vBMD, volumetric bone mineral density.
Biochemical data were obtained through data sharing with NASA’s Spaceflight Standard Measures and Space Biochemical Profile studies and analysed by NASA’s Nutritional Biochemistry Lab as previously described.18 Blood and urine samples were collected pre-flight at approximately 180 and 45 days before launch (average used as pre-flight value), in-flight at flight day (FD)15, FD30, FD60, FD120 and FD180 and on return (R+0). Pre-flight and R+0 urine were collected as two consecutive 24-hour urine pools while in-flight urine was one 24-hour urine pool. Blood samples were collected following an overnight fast. Coefficient of variation is <6% for serum and urine creatinine, serum and urine calcium, osteocalcin, sclerostin, parathyroid hormone, serum phosphorus and procollagen 1 intact N-terminal propeptide (P1NP); <11% for bone-specific alkaline phosphatase (BSAP), osteoprotegerin (OPG), urine N-telopeptide (NTx) and C-telopeptide (CTx), and <17% for 1,25-dihydroxyvitamin D, 25-hydroxyvitamin D and RANKL.
Pre-flight exercise was estimated using a health history questionnaire regarding the frequency and duration of running and cycling sessions. Resistance training questions calculated sets and repetitions per week for various exercises including squats, deadlifts and heel raises. Data from the in-flight treadmill and ergometer included frequency and duration of sessions, while data from three lower body ARED exercises: squats (back, single leg and sumo), deadlifts (stiff leg, Romanian and sumo) and heel raises (double and single leg) included number of sets and repetitions per session.
Statistical analysis
All analyses were conducted using Stata (V.16, StataCorp). Change in bone variables from pre-flight to post-flight were assessed using Wilcoxon signed rank test. Pairwise percent change data are reported in text. Mixed effects models with Kenward-Roger small sample size adjustment19 examined changes in bone variables and included fixed effects of time (pre/post), mission duration and the interaction between time and mission duration. A random intercept allowed individuals their own intercept for the effect of time. Changes in biochemical markers of bone turnover were also examined using mixed effects models. Bonferroni correction accounted for multiple comparisons. Relationships between biochemical markers and exercise with change in bone variables were examined by individually adding biochemical markers and exercise variables as fixed effects (along with their interactions with time) to the mixed effects bone models. Model assumptions were assessed graphically using plots of residuals and significance was set at p<0.05.
Results
Crewmembers included 14 men and 3 women with a mean age 46.9 years (SD 6.7), height 177.7 cm (6.0), body mass 79.1 kg (7.7) and body mass index 25.0 kg/m2 (2.1). Crewmembers were on-orbit for a mean of 170 days. The current mission was the first long-duration flight (>3 months) for 14 crewmembers. We excluded three HR-pQCT radius scans with motion >3 and 1 pre-flight and post-flight tibia scan due to previous ankle fracture. Three crewmembers did not participate in a collaborative study analysing CTx; thus, biomarker maximum sample size was 17 except for CTx. No crewmembers took anti-resorptive or other bone-related medication.
Spaceflight and bone strength, density and microarchitecture
Tibia
Changes in bone strength and vBMD after spaceflight were consistent between the dominant and non-dominant tibiae. Median post-flight change (dominant, non-dominant) was −4.3%, −3.9% for bone strength (F.Load); −3.1%, −2.9% for Tt.vBMD, −1.6%, −1.2% for Ct.vBMD and −2.6%, −2.0% for Tb.vBMD (group median values presented in table 1; figure 2). Loss per month was 0.9%, 0.8% for F.Load, 0.6%, 0.5% for Tt.vBMD, 0.3% for Ct.vBMD and 0.4% for Tb.vBMD. Post-flight changes in Tb.BV/TV (−1.9%) mirrored those of Tb.vBMD, while Tb.Th was −1.5%, −0.8% lower at the dominant and non-dominant tibia, respectively and Tb.N was 0.7% greater at the non-dominant tibia. No other changes in bone microarchitecture were observed at landing.
HR-pQCT bone variables at the dominant and non-dominant distal tibia and radius, before and after spaceflight

Percent change in HR-pQCT measured bone variables, normalised to a 6-month mission. Individual data points are dichotomised by mission duration: x <6-month mission, o >6-month mission. Box plot depicting median and IQR is plotted next to individual data. HR-pQCT, high-resolution peripheral quantitative CT; F.Load, failure load; Tt.vBMD, total volumetric bone mineral density; Ct.vBMD, cortical vBMD; Tb.vBMD, trabecular vBMD; Tb.Th, trabecular thickness; Tb.N, trabecular number; Rad.D, dominant radius; Rad.ND, non-dominant radius; Tib.D, dominant tibia; Tib.ND, non-dominant tibia.
Mission duration predicted change in bone variables at the tibia (figures 2 and 3), indicating progressive loss with mission duration. Bone loss was linear between 3.5 and 7 months for F.Load, Tt.vBMD and Ct.vBMD, such that significant declines were only observed on missions >5 months (figure 3). Tibia trabecular bone variables (Tb.vBMD and Tb.BV/TV) were modelled by a quadratic relationship for 3.5–7 month missions, such that declines accelerated on missions >6 months (figure 3) and did not change on missions ≤6 months. Changes in Tb.Th and Tb.N were not related to mission duration.
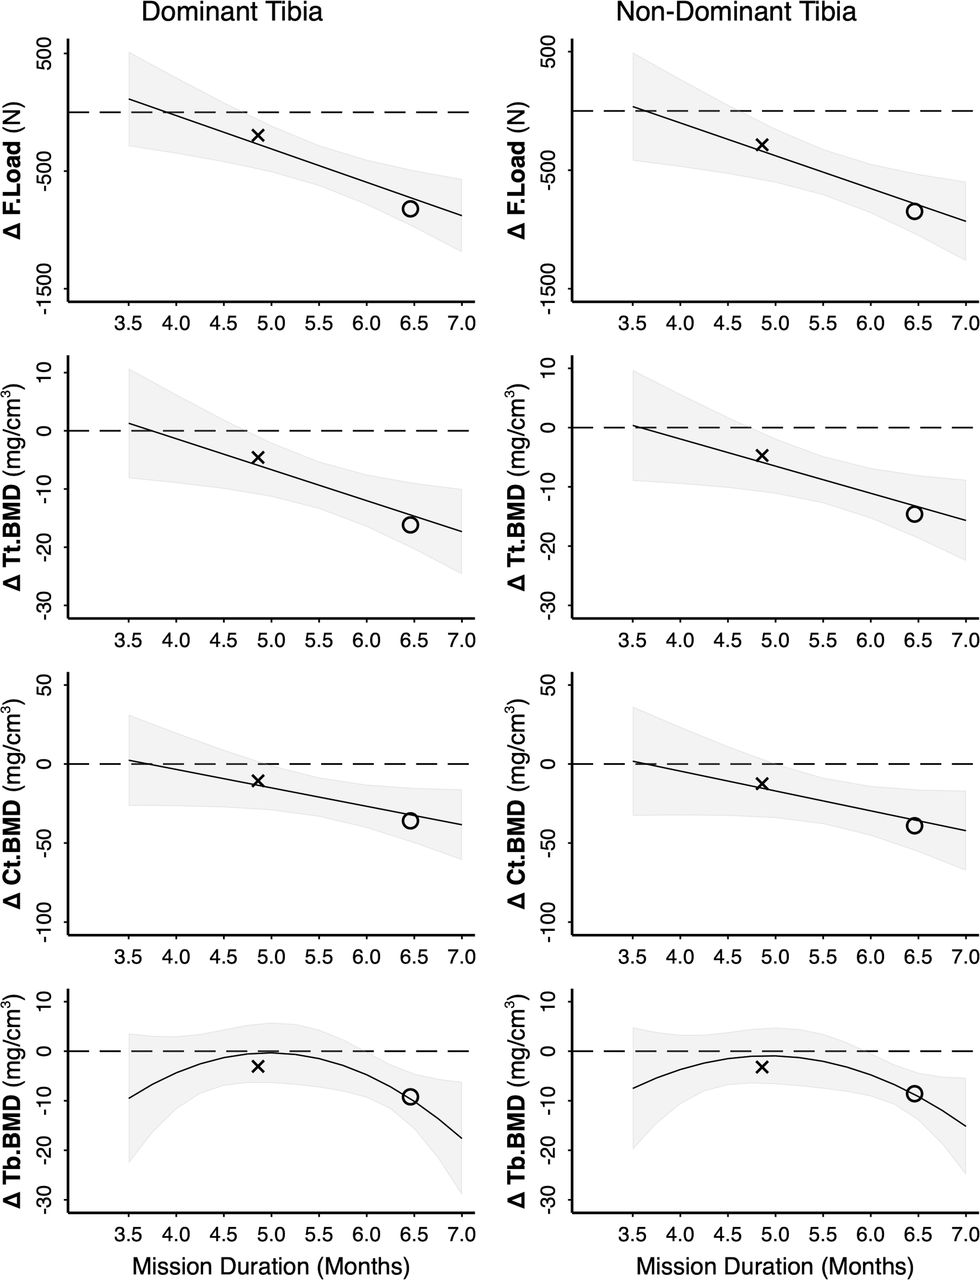
Relationship between mission duration and post-flight change in tibia bone variables (in parameter units for example, mg/cm3). Model is based on RAW data (n=17); however, for privacy purposes only summary data are plotted: x <6-month mission (n=9), o >6-month mission (n=8). The line and shaded 95% CI represent the predicted relationship between mission duration and change in bone variables based on the mixed effects model. Significant difference post-flight is indicated where CIs do not cross 0. F.Load, failure load; Tt.vBMD, total volumetric bone mineral density; Ct.vBMD, cortical vBMD; Tb.vBMD, trabecular vBMD.
Radius
Changes at the radius were less pronounced than at the tibia. Except for a median 1% decrease in Tb.Th at the non-dominant radius, no changes were observed at the radius (table 1, figure 2). However, examining the effect of mission duration highlighted several disparities. Specifically, Tt.vBMD increased on missions between 4.5 and 5.5 months and decreased on missions >6.5 months, and F.Load (non-dominant radius) increased on missions between 4.5 and 5.5 months (online supplemental figure S1).
Supplemental material
Spaceflight and areal bone mineral density (DXA)
FN, TH and LS aBMD declined by a median of −3.2% to −4.9% after spaceflight (−0.5% to −0.9% per month; online supplemental table 1). Total body mass, lean mass and fat mass did not differ after spaceflight.
Supplemental material
Spaceflight and biochemical markers of bone remodeling
Biochemical markers across study phases (ie, pre-flight, in-flight and post-flight) are illustrated in table 2, figure 4 and online supplemental figure S2. Bone resorption markers CTx and NTx were elevated throughout flight and immediately post-flight compared with pre-flight. Markers of bone formation were elevated from midflight onwards (from FD60 for P1NP and osteocalcin and FD120 for BSAP). Sclerostin was increased at FD30 and FD60. Serum phosphorus was elevated at FD30, FD120 and FD180, while urinary calcium was elevated through FD60.

Change in biomarkers at each timepoint (pre-flight, flight day (FD)15, FD30, FD60, FD120, FD180 and return (R+0)). Individual data points are indicated in open circles next to a boxplot (median change, IQR) and overlaid by a lowess smoothing curve. CTX, type I collagen C-terminal cross-linked telopeptide; NTx, type I collagen N-terminal cross-linked telopeptide; P1NP, procollagen type 1 amino-terminal propeptide; BSAP, bone-specific alkaline phosphatase; OC, osteocalcin. Trajectories for remaining biomarkers can be found in online supplemental figure S2.
Biochemical markers of bone turnover and bone metabolism before, during and after spaceflight
Mixed effects models demonstrated negative relationships between average pre-flight bone turnover markers and changes in tibia bone strength and vBMD (online supplemental table S2; figure 5). Specifically, we observed significant negative interactions with time for pre-flight CTx (μg/day and/or μg/mmol Cr) with F.Load, Tt.vBMD and Ct.vBMD. The negative interaction with time indicated crewmembers with greater CTx before flight experienced greater loss of F.Load, Tt.vBMD and Ct.vBMD during spaceflight. A significant negative interaction with time was also observed at the dominant tibia for pre-flight NTx (μg/mmol Cr) with F.Load, OC with Tt.vBMD and P1NP with Tb.vBMD, and at both tibiae for P1NP with F.Load and Tt.vBMD. Pre-flight markers of bone turnover did not predict change at the radius. Greater pre-flight sclerostin predicted preservation of F.Load and Tt.vBMD at the dominant tibia. No other pre-flight biomarkers predicted changes in bone variables.

Relationship between (A) pre-flight biomarkers and change in total volumetric bone mineral density (Tt.vBMD) at the dominant tibia and (B) pre-flight running volume and change in trabecular vBMD (Tb.vBMD) and trabecular thickness (Tb.Th) at the dominant (left) and non-dominant (right) tibia. CTX, type I collagen C-terminal cross-linked telopeptide; P1NP, procollagen type 1 amino-terminal propeptide. Black circles are RAW change data for each crewmember. The line and shaded 95% CI represent the predicted relationship between change in bone variables and biomarker or running volume based on the mixed effects model (including fixed effects of mission duration, biomarker or running volume and interactions with time). Significant difference post-flight is indicated where CIs do not cross 0. Note: a change of 6 mg/cm3, 4 mg/cm3 and 0.005 mm for Tt.vBMD, Tb.vBMD and Tb.Th, respectively, is equivalent to a relative change of approximately 2%.
Spaceflight and exercise
Aerobic exercise
On average, running frequency increased from two sessions/week (range 0–4) to four sessions/week (1–6) for a total of 86 min/week (range 0–150) to 87 min/week (24–148) from before spaceflight to in-flight, respectively. Cycling similarly increased from one session/week (0–3) to three sessions/week (1–4) and from 38 min/week (0–120) to 62 min/week (29–168), respectively. Pre-flight and in-flight running volume (min/week) were positively correlated (r=0.589; p=0.013), indicating those who ran most before spaceflight ran most in-flight. However, a negative relationship between pre-flight and change (in-flight–pre-flight) in running volume (r=−0.501; p=0.040) showed crewmembers who ran more before flight reduced running volume in-flight.
Negative interactions between pre-flight running volume and time indicated greater running volume before spaceflight predicted greater trabecular bone loss at the tibia during spaceflight (online supplemental table S3; figure 5). Neither pre-flight nor in-flight running and cycling predicted changes in F.Load, Tt.vBMD or Ct.vBMD at the tibia.
Resistance exercise
Mean training volume (repetitions per week) for deadlifts, squats and heel raises increased from 49, 62 and 29 reps/week (range 0–180), respectively, before spaceflight to 221, 185 and 186 reps/week (range 59–456) in-flight, with change in training volume ranging from −39 to 356 reps/week. We observed positive interactions with time for change in deadlift training volume with F.Load at the dominant tibia (β (95% CI): 1.6 N (0.2 to 2.9)), and change in deadlift training volume, change in heel raise volume and in-flight deadlift training volume with Tb.vBMD and Tb.Th at the non-dominant tibia (online supplemental table S3 and figure S3). Pre-flight heel raise volume predicted loss of Tb.Th at the non-dominant tibia.
Discussion
We observed substantial bone loss at the weight-bearing distal tibia over 3.5–7 months space missions. Astronauts’ bone quality was similar to terrestrial populations before spaceflight: mean 46th percentile for tibia total vBMD (range 0.4–95; based on age and sex-specific normative data).20 The five percentile decline in tibia vBMD after spaceflight (mean 41st percentile) parallels bone loss observed over two decades (from age 40 to 60) in men,20 21 while rate of bone loss was six times faster during spaceflight than during menopause.21 Loss of bone strength and vBMD at the tibia progressed with mission duration, confirming reports from DXA and QCT regarding the tight link between bone loss and time spent in microgravity.1 22 23 As most ISS missions to date are limited to about 6 months, it is unknown whether the linear loss we observed for tibial vBMD and strength would stabilise on longer missions or would continue to deteriorate. Thus, future studies of missions longer than 6-month spaceflights are required to examine temporality of bone loss and define the risks of proposed future missions outside low-Earth orbit.
Bone microarchitecture, density and strength
The Early Detection of Osteoporosis in Space (EDOS) study previously explored bone loss and recovery in 13 cosmonauts using HR-pQCT.2 As in our study, tibia vBMD declined by 1%–3% over 6 months of spaceflight while no changes in vBMD were observed at the radius.2 In contrast to our findings, EDOS did not observe trabecular thinning. However, EDOS employed an earlier generation HR-pQCT scanner with a lower image resolution (82 µm voxel size) unable to directly measure trabecular microarchitecture,10 whereas second-generation HR-pQCT directly captures and can better detect changes in trabecular microarchitecture.
Trabecular bone is located at the epiphyses of long bones and in vertebral bodies, where its 3D lattice microarchitecture enables load transfer and energy absorption.24 Given trabecular bone’s large surface area and proximity to bone marrow, it is designed for metabolic activities associated with bone turnover.25 Loss of trabecular bone connectivity may irreversibly damage bone structure,26 27 as there is no adaptive mechanism to reconnect dissociated trabeculae. The profound deterioration of trabecular vBMD and BV/TV we observed on missions longer than 6 months is likely related to thinning of trabeculae.28 As bone formation occurs on the surfaces of existing bone, trabecular bone recovery on return to 1g may also be limited by the extent of microarchitectural deterioration.
Our findings confirm the importance of the local mechanical environment for bone loss, such that the upper limbs are preserved to a much greater extent than the weight-bearing lower limbs.1 2 The radius is better protected in microgravity likely owing to its non-weight bearing nature on Earth. The gain in radius vBMD on shorter missions may be explained by greater reliance on the upper limbs for everyday tasks aboard the ISS (eg, using arms to manoeuvre around the ISS). However, changes at the radius did not exceed the least significant change (LSC) for any crewmember; whereas tibia vBMD deteriorated in excess of LSC in most crewmembers (14/17).29 Three crewmembers whose tibia vBMD loss did not exceed LSC flew on missions <6 months. HR-pQCT provides insight into the bone compartment changes that cannot be distinguished by DXA and the microarchitectural adaptations that underpin the altered bone density. DXA measures of aBMD demonstrated similar magnitude of loss as HR-pQCT-derived vBMD and concur with prior studies of long-duration spaceflight.1 2
Biomarkers of bone turnover
In-flight serum and urine samples allowed us to examine how bone metabolism changes during flight. Whereas HR-pQCT bone measures reflect localised adaptation to the mechanical environment, biomarkers of bone turnover indicate systemic changes in bone mass balance that reflect the dynamics of bone remodelling and precede visible changes in mineralised bone mass. Variability in markers of bone turnover is due to many factors, including genetics, age, sex, diet and exercise.30 We observed unbalancing of the normal bone remodelling process during spaceflight,18 31 where more bone was resorbed than formed, as also seen during menopause.32 Rapid and sustained increases in markers of bone resorption were followed by slow increases in bone formation later in-flight (figure 4).1 31 This pattern is ascribed to increased resorption due to unloading, while bone formation lags due to obligatory coupling of the two processes.
Circulating biomarkers of both bone resorption (urinary CTx, NTx) and formation (serum P1NP) before spaceflight predicted changes in bone, such that crewmembers with elevated markers of bone turnover prior to spaceflight experienced greater losses in vBMD and strength. Although bone remodelling is integral for maintaining the skeleton’s mechanical competence by replacing old and damaged bone with new bone, excessive turnover may impair mechanical competence.33 We suspect bone in an elevated state of breakdown and repair prior to spaceflight may be primed for losing more bone in microgravity due to increased resorption and reduced formation. For example, when steady state remodelling is perturbed by microgravity, excavation of bone may be exacerbated by bone multicellular units (BMU) in a resorptive phase while deposition or mineralisation of new bone matrix may be reduced by BMUs in formation phase, resulting in net bone loss.
Exercise
Substantial bone loss occurred despite near-daily exercise on-orbit. Change in training volume from pre-flight may be essential for designing effective in-flight exercise regimes; thus, detailed pre-flight exercise histories should be obtained. Space agency’s Astronaut Strength, Conditioning and Rehabilitation (ASCR) specialists must balance exercise countermeasure time between preventing deconditioning of multiple body systems and avoiding overtraining injuries. In-flight resistance training volume increased 3–6 times on average compared with pre-flight volume, which may be sufficient for some astronauts to maintain bone structure and strength in microgravity. However, crewmembers with high strength training volumes prior to flight did not increase their training volume in-flight and experienced greater bone loss. It is challenging to provide the skeleton with adaptive strains in microgravity, particularly for crewmembers with high strength training volumes before flight and given numerous constraints around in-flight exercise (eg, crew time, sharing exercise equipment). As bone adapts to nonroutine strains,34 complementing traditional low intensity/high volume in-flight training regimes with an approach that alternates training load and volume throughout the week35 may enhance osteogenic stimuli within the allotted time. Aerobic capacity and muscle strength likely recover after post-flight reconditioning36; however, microgravity-induced deterioration of bone structure may be irreversible. Thus, recognising high pre-flight running and resistance training volumes as harbingers of spaceflight-induced bone loss may help flight surgeons and ASCR’s tailor in-flight exercise and other countermeasures.
This study has several limitations. Our sample size was small; however, this is an inherent limitation of space-related research. Given sample size constraints, we were unable to examine differences between women and men. Second, in-flight exercise was automatically logged; however, crewmembers may have engaged in additional ARED workouts that were not logged. Further, pre-flight exercise was ascertained by self-report, which should be complemented by an objective measure (eg, accelerometry) in the future. Device-measured instead of self-reported physical activity may clarify relationships between habitual exercise and biomarkers of bone turnover, as we did not observe correlations between exercise and biomarkers (data not shown).
In summary, bone’s response to microgravity is site-specific and heterogeneous between individuals. We highlight the effect of mission duration for bone deterioration and the need for data from longer missions to confirm trajectories of (or plateaus in) bone loss. Microgravity-induced bone loss is complex and influenced by several factors; however, magnitude of change in the mechanical loading environment (ie, microgravity and exercise) is paramount for bone adaptation, particularly in the context of elevated pre-flight biomarkers of bone turnover. Thus, three key considerations include: (1) mission duration; (2) pre-flight markers of bone turnover and (3) pre-flight exercise training.
What are the findings?
Bone loss progresses with mission duration and does not stabilise on missions up to 7 months duration.
Individuals with heightened pre-flight bone turnover may be more sensitive to the negative effects of unloading in microgravity.
Crewmembers who increased their resistance training volume in-flight compared with pre-flight were more likely to preserve bone strength and trabecular bone at the tibia.
Current in-flight exercise regimes may be insufficient to maintain bone structure and strength at the tibia in crewmembers with high pre-flight exercise training.
How might it impact on clinical practice in the future?
Pre-flight bone turnover markers are an indicator of flight-induced bone loss, and as such could be used for prescribing exercise or other countermeasures.
Crewmembers who run and/or strength train frequently prior to spaceflight may require different and/or additional preventative measures to mitigate bone loss.
Findings are relevant for understanding how exercise affects bone loss in terrestrial populations where bone loss occurs due to reduced mechanical loading (eg, injury, disuse or disease).
Data availability statement
No data are available.
Ethics statements
Patient consent for publication
Ethics approval
This study was approved by the University of Calgary Conjoint Health Research Ethics Board (REB14-0573), NASA Institutional Review Board (NASA7116301606HR), ESA Human Research Multilateral Review Board and JAXA Institutional Review Board for Human Research. All participants provided written informed consent.
Acknowledgments
The authors would like to thank the crewmembers for their time participating in this study; Anne Cooke, Stephanie Kwong, Duncan Raymond and Greg Yardley for scan acquisition and data collection; Katrina Koger for study coordination and Tannis Kemp for image visualisation. We thank the NASA Nutritional Biochemistry Lab for support of the biosample collections and biomarker analyses.
References
Supplementary materials
Supplementary Data
This web only file has been produced by the BMJ Publishing Group from an electronic file supplied by the author(s) and has not been edited for content.
Supplementary Data
This web only file has been produced by the BMJ Publishing Group from an electronic file supplied by the author(s) and has not been edited for content.
Footnotes
Correction notice This article has been corrected since it published Online First. The last author's name has been amended.
Contributors SB and A-ML conceptualised the study. The study was developed by SB and A-ML with JDS, SMS, MH and PAH. LG and SB completed the image analysis; SMS and SRZ completed the biomarker analysis. LG conducted the data analysis and drafted the manuscript. SB, A-ML, JDS, SMS, SRZ and MH interpreted data and contributed to the manuscript draft. All authors approved the final version.
Funding This study was supported by the Canadian Space Agency (Contract #9F008-140715) and German Aerospace Centre (DLR, Contract #50WB1217, #50WB1520, #50WB1535). LG was supported by an Alberta Innovates Health Solutions Postgraduate Fellowship. The biomarker data were shared from the Biochemistry Profile project, which was funded by the NASA Human Research Program’s Human Health Countermeasures Element.
Competing interests None declared.
Provenance and peer review Not commissioned; externally peer reviewed.
Supplemental material This content has been supplied by the author(s). It has not been vetted by BMJ Publishing Group Limited (BMJ) and may not have been peer-reviewed. Any opinions or recommendations discussed are solely those of the author(s) and are not endorsed by BMJ. BMJ disclaims all liability and responsibility arising from any reliance placed on the content. Where the content includes any translated material, BMJ does not warrant the accuracy and reliability of the translations (including but not limited to local regulations, clinical guidelines, terminology, drug names and drug dosages), and is not responsible for any error and/or omissions arising from translation and adaptation or otherwise.