Article Text

Abstract
Background Athletic groin pain (AGP) is prevalent in sports involving repeated accelerations, decelerations, kicking and change-of-direction movements. Clinical and radiological examinations lack the ability to assess pathomechanics of AGP, but three-dimensional biomechanical movement analysis may be an important innovation.
Aim The primary aim was to describe and analyse movements used by patients with AGP during a maximum effort change-of-direction task. The secondary aim was to determine if specific anatomical diagnoses were related to a distinct movement strategy.
Methods 322 athletes with a current symptom of chronic AGP participated. Structured and standardised clinical assessments and radiological examinations were performed on all participants. Additionally, each participant performed multiple repetitions of a planned maximum effort change-of-direction task during which whole body kinematics were recorded. Kinematic and kinetic data were examined using continuous waveform analysis techniques in combination with a subgroup design that used gap statistic and hierarchical clustering.
Results Three subgroups (clusters) were identified. Kinematic and kinetic measures of the clusters differed strongly in patterns observed in thorax, pelvis, hip, knee and ankle. Cluster 1 (40%) was characterised by increased ankle eversion, external rotation and knee internal rotation and greater knee work. Cluster 2 (15%) was characterised by increased hip flexion, pelvis contralateral drop, thorax tilt and increased hip work. Cluster 3 (45%) was characterised by high ankle dorsiflexion, thorax contralateral drop, ankle work and prolonged ground contact time. No correlation was observed between movement clusters and clinically palpated location of the participant's pain.
Conclusions We identified three distinct movement strategies among athletes with long-standing groin pain during a maximum effort change-of-direction task These movement strategies were not related to clinical assessment findings but highlighted targets for rehabilitation in response to possible propagative mechanisms.
Trial registration number NCT02437942, pre results.
- Groin
- Biomechanics
- Overuse injury
- Performance
This is an Open Access article distributed in accordance with the Creative Commons Attribution Non Commercial (CC BY-NC 4.0) license, which permits others to distribute, remix, adapt, build upon this work non-commercially, and license their derivative works on different terms, provided the original work is properly cited and the use is non-commercial. See: http://creativecommons.org/licenses/by-nc/4.0/
Statistics from Altmetric.com
Introduction
Athletic groin pain (AGP) is a common chronic presentation in professional and amateur sport.1 ,2 A recent systematic review in football2 reported an incidence of AGP between 0.2 and 2.1/1000 hour in men; hip/groin injuries were the third most common injuries (14%). Similar incidences rates are reported in field sports such as Rugby Union,3 ,4 Australian Rules Football5 and Gaelic football6 ,7 which share the common requirement of acceleration, deceleration, kicking and ‘cutting’ (movements combining deceleration and acceleration with a change of direction).
Research into AGP to date has focused on trying to localise the ‘injured’ or ‘painful’ structure clinically,8–10 radiologically11–13 and surgically.14–18 Existing clinical examination of patients with AGP has been largely confined to palpation for pain,19–21 range of motion20 and dynamometer-based strength testing in a single plane.22 ,23 Biomechanical segmental coordination (as described by the relationships between segments articulating at the hip, knee and ankle joints) during movements has not been considered.
Segmental coordination is intrinsic to an athlete's ability to control change of direction and produce power to execute movement.24 ,25 A loss of segmental coordination may lead to tissue injury, if the magnitude, rate and direction of the loading of muscles around a joint or joints exceeds that of tissue tolerance.26 This coordination can be examined using a three-dimensional motion analysis system. Three-dimensional motion analysis systems have successfully identified pathomechanics of anterior cruciate ligament injuries27 and might also help explain causes of painful structures encountered in AGP. Therefore, studying the movement strategies during a multidirectional movement task might reveal potential injury mechanisms.
Our primary aim was to describe and analyse the movement pattern used by patients with AGP during a planned maximum effort change-of-direction task. Our secondary aim was to determine if specific anatomical diagnoses related to a distinct movement pattern.
Methods
Participants
In total, 382 consecutive male participants presenting with chronic AGP were recruited. All players were experienced multidirectional field athletes. The Sports Surgery Clinic Hospital Ethics Committee approved the study (Ref 25EF011) and all participants signed informed consent. The study was registered at Clinicaltrials.gov (NCT02437942).
Clinical examination
A detailed history, clinical examination,10 Hip and Groin Outcome Score28 and magnetic resonance pelvis imaging was carried out on each participant, the methodology and results of which are reported previously.29 This combined assessment, resulted in an anatomical clinical diagnosis for each participant.
Biomechanical examination
Participants undertook a standardised warm-up (five body weight squats and five submaximal countermovement jumps).30 The multidirectional test protocol involved three maximal effort trials (left and right limb turning) of a planned 110° cutting manoeuvre (figure 1A).31 The order of which turn to use first was randomised. Instructions given were as follows: run as fast as possible towards the cone (red triangle; figure 1A), make a single complete foot contact in front of the cone and run maximally to the finish line and plant with the outside foot (when cutting left, plant with the right and vice versa). Each participant undertook two submaximal practice trials of the cut before test trials were captured. A 1-min recovery was taken between trials.
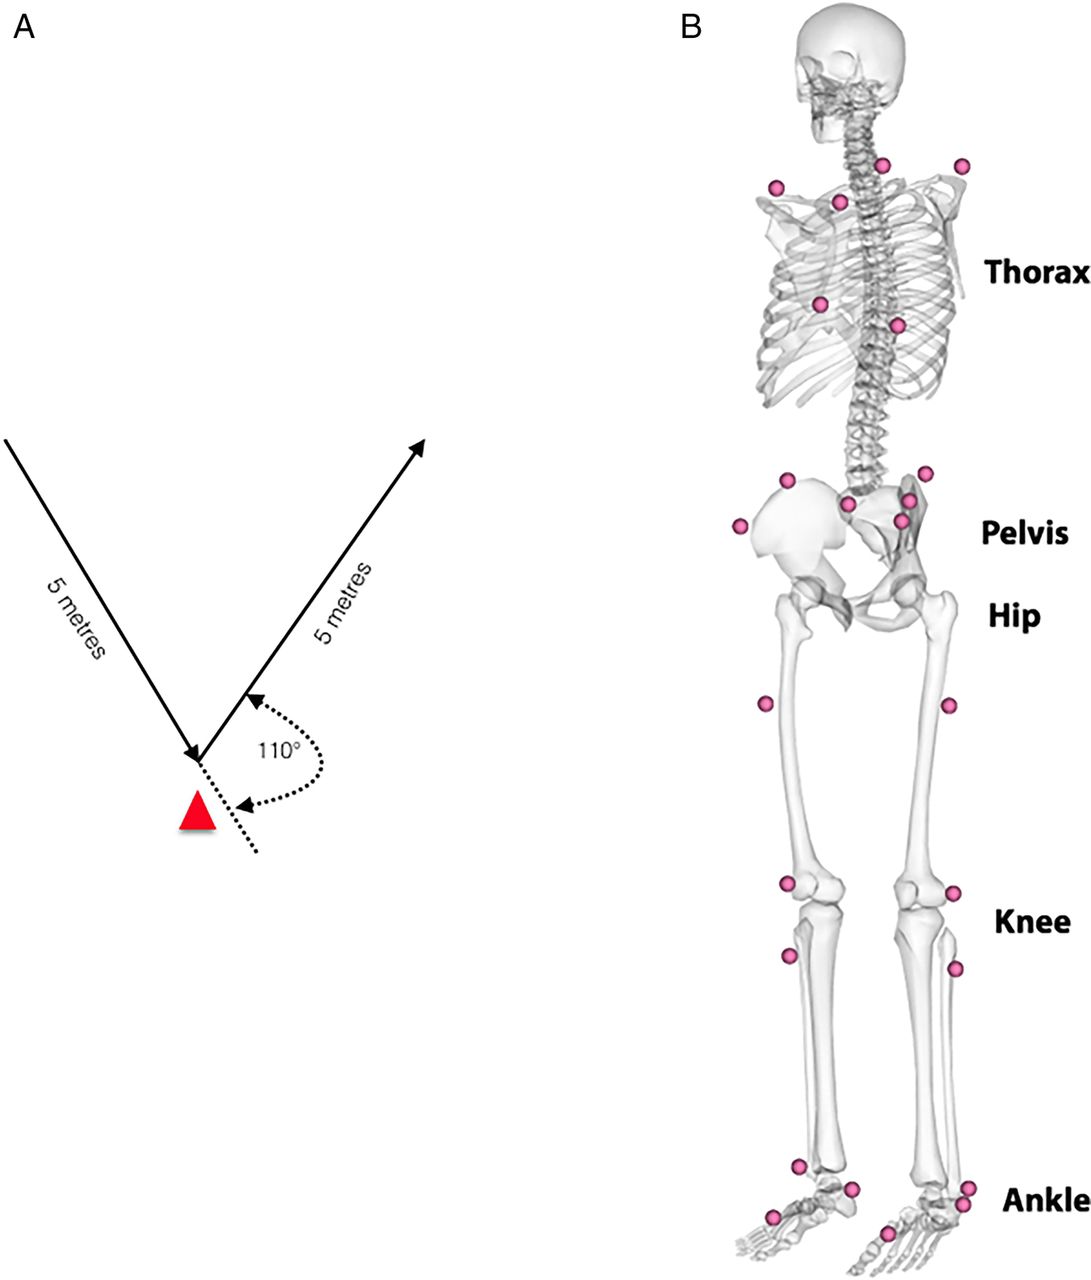
A,B Illustration of the multidirectional movement task and a schematic illustration of the landmarks of the marker setup.
Data acquisition and analysis
An eight-camera motion analysis system (Bonita-B10, Vicon Motion Systems, UK), synchronised with two force platforms (BP400600, AMTI, USA), was used to record 24 reflective markers (1.4 cm diameter) and ground reaction forces (GRFs). Reflective markers were secured using tape, at bony landmarks on the lower limbs, pelvis32 and trunk (modified Plug-in-Gait marker set to include the trunk) (figure 1B). A software package (Nexus 1.8.5, Vicon Motion Systems, UK) controlled simultaneous collection of motion and force data (200 Hz, 1000 Hz), which were filtered using a fourth-order low-pass Butterworth filter (cut-off frequency of 15 Hz33). Standard inverse dynamics analysis was used to calculate tri-planar external joint moments.34 The start and end of the test (cutting) movement was defined by the GRF (>5N). Curves were normalised to 101 frames and landmark registered35 to the start of the acceleration phase (last positive anterior GRF before negative peak; at 46% of the movement cycle) (figure 2). This process aligned the start of the acceleration phase (47%) for every participant, and it accounts for differences in braking/deceleration and acceleration phase across the participant during a continuous waveform analysis.

Illustration of the mean and SD of the raw and landmarked ground reaction force curve.
Joint work was calculated as the sum of the moment (m) multiplied with the change in angle (σ) of all three planes (p; flexion, adduction, internal rotation) for every time point (t) over the cycle for each joint (j: ankle, knee and hip), generating a single measure for joint work (equations (1) and (2)). 1
1
Where 2
2
As calculated, joint work refers to the amount of work done by all muscles acting across a joint.
Clustering
The data were examined for subgroups (clusters), using kinematic (ankle, knee, hip, pelvis and thorax angles) and kinetic variables (ankle, knee and hip moments) using only the painful side (by clinical palpation) for analysis. Where pain was found on both sides, we randomly selected the left or right side. Where no palpation pain was identified, the side of MRI confirmed pathology (eg, hip injury or aponeurosis injury) was used. Again, where both sides were affected, we randomly selected the left or right side.
For the clustering process, analysis of characterising phases was used to calculate subject scores that describe the behaviour of each participant within phases of variation of the selected variables, which were combined into a matrix (number phases of variation×number participant) and normalised for further processing.36 The normalisation was performed by transforming the combined similarity scores into their correlation matrix, to quantify numerically the relationship between the behaviour of participant, which cannot be described by distances of the generated similarity scores.37 Subsequently, gap statistic was used to decide number of clusters (k) within the sample.38 Gap statistics compare the within-cluster dispersion of a data set for a number of requested cluster solution (eg, k=2 to 25) to the average within-cluster dispersion. Following this differentiation of the number of clusters, the correlation matrix was used as input for a hierarchical clustering approach (figure 3).

Representation of the splitting behaviour of the sample for increasing number of clusters.
Gap statistics suggested examining our data based on a 3 cluster solution, henceforth referred to as cluster 1, 2 and 3. A full and detailed description of this methodology is available as online supplementary appendix A.
supplementary appendix
Statistical analysis
To identify differences in kinematic and kinetic measures between the clusters, statistical parametric mapping was used.39 ,40 The Cohen’s D effect size was calculated in a point-by-point manner to determine clinical relevance of a difference (d>0.5=medium; d>0.7=strong).41 Significant differences with a Cohen’s D <0.5 were discarded. For the discrete work measures, an analysis of variance (ANOVA) was used to identify differences between the clusters, and a post hoc test was performed if significant differences were found. To compare the interrelation between the identified clusters and the clinical diagnoses, a contingency table (cross tabulation) was used. The significance of this relationship was assessed using Pearson's χ2 test. All data processing and statistical analyses were performed using MATLAB (R2015a, MathWorks , USA).
Results
Participants were aged 27.6 (±7.6) years old, 180 (±6.0) cm tall and 81.9 (±9.4) kg with a median time of 36 (IQR 16–75) weeks between onset of symptoms and presentation. From 382 original participants, 322 participants were used for the analysis. A total of 31 participants had missing motion analysis data (they did not attend the motion analysis appointment). While all remaining participants were able to perform the cutting task, 29 had partial or double leg force plate contacts and had to be excluded from further analysis.
Three distinct movement strategies (clusters) were identified with differences in braking and acceleration phases by joint and plane of movement kinematics (table 1 and figure 4A–E) and kinetics by joint and plane (table 2 and figure 5A–E).
Description of kinematic differences between clusters 1, 2 and 3 with strong effect sizes
Descriptive of kinetic differences between the cluster 1, 2 and 3

Graphical representations of joint kinematics in each plane. Black continuous line represents cluster 1, red dotted line cluster 2 and blue broken line cluster 3. Below each graph, the shaded bars represent significant differences between clusters. Where (A) represents ankle, (B) represents knee, (C) represents hip, (D) represents pelvis and (E) represents thorax.

Graphical representations of joint kinetics in each plane, and centre of mass and ground reaction force. Black continuous line represents cluster 1, red dotted line cluster 2 and blue broken line cluster 3. Below each graph, the shaded bars represent significant differences between clusters. Where (A) represents ground reaction force, (B) represents centre of mass, (C) represents ankle, (D) represents knee and (E) represents hip.
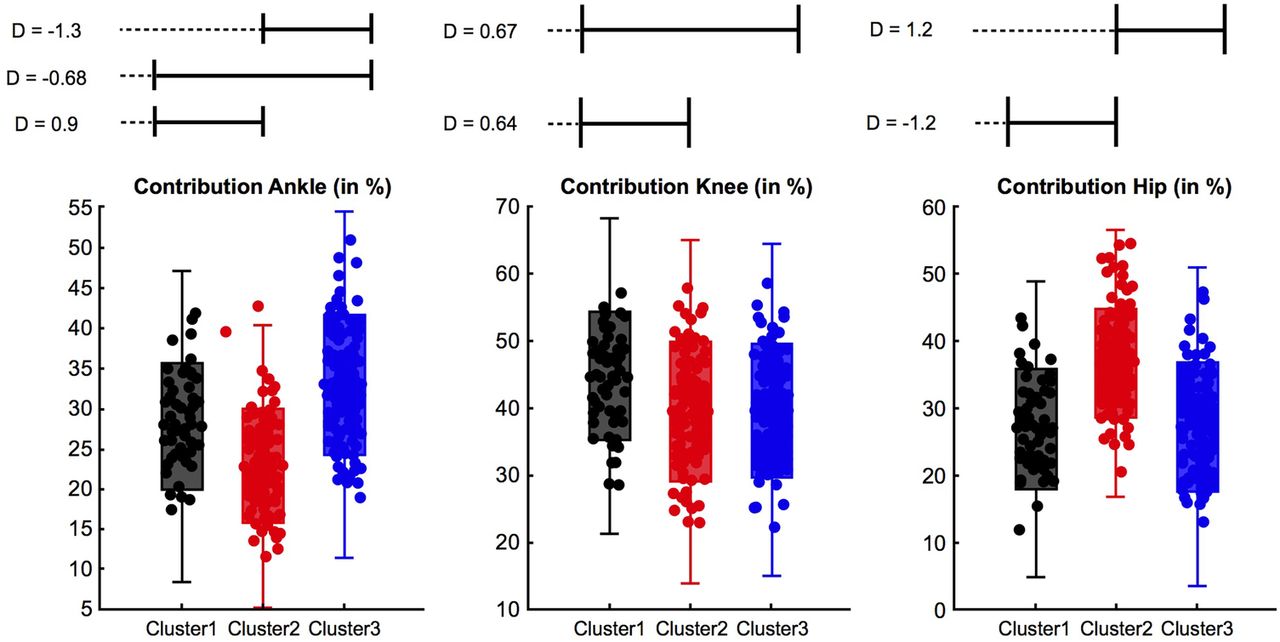
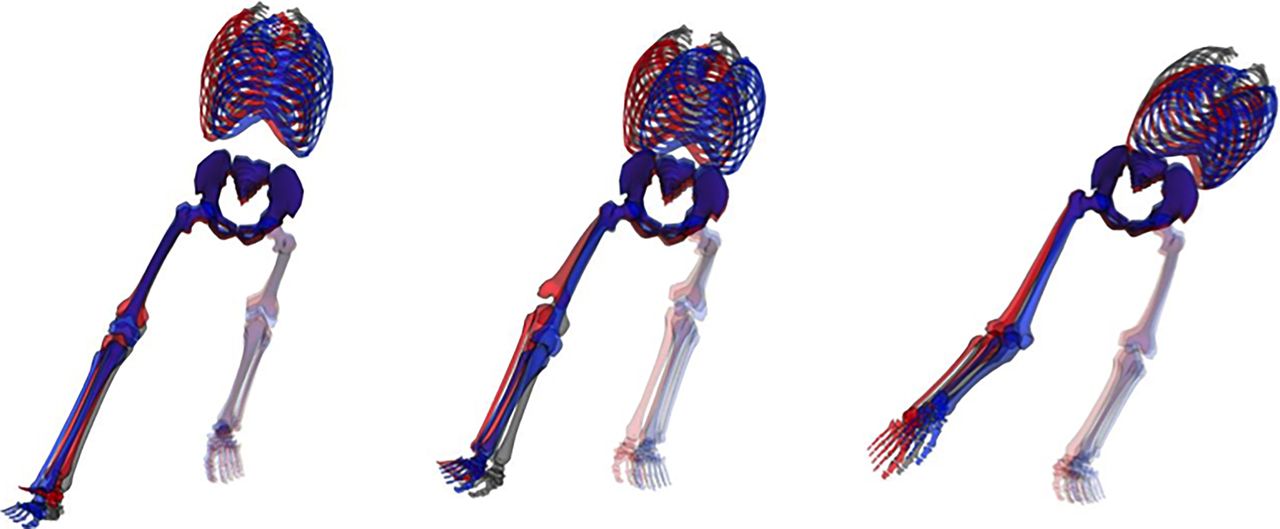
Each cluster is pictorially represented in sagittal (figure 6) and frontal (figure 7) plane highlighting gross differences, and in comparison of moment and total work done by the joints (figure 8)—all descriptions of differences are in comparison to the other clusters. A detailed description of findings can be found in table 1 and 2.

Sagittal view of clusters at impact, 1% (left); start of acceleration phase, 46% (middle); and toe-off, 100% (right). The pelvis of every skeleton has been locked to an x=0, y=0 and z=0 coordinate, while every rotation angle has been set to 0. This approach results in the best visualisation in the sagittal plane. The black skeleton represents cluster 1, the red cluster 2 and the blue cluster 3.

Frontal view of clusters at impact, 1% (left); start of acceleration phase, 46% (middle); and toe-off, 100% (right). The pelvis of every skeleton has been locked to an x=0, y=0 and z=0 coordinate, while every rotation angle has been set to 0. This approach results in the best visualisation in the frontal plane. The black skeleton represents cluster 1, the red cluster 2 and the blue cluster 3.
Box plot highlighting differences in work done in cluster 1, 2, 3. D, effect size.
Cluster 1
Cluster 1 represents 40% (n=128) of the cohort, and the main cluster features are increased ankle eversion, external rotation and knee internal rotation (table 1) throughout the braking and acceleration phase. In addition, cluster 1 demonstrated a high degree of hip internal rotation (figure 4B). The thorax segment demonstrates the smallest anterior tilt and medium ipsilateral drop throughout the braking phase, while it features late turning rotation towards the direction of travel in the acceleration phase (figure 4E) (table 1).
These kinematic features map with the kinetic differences (table 2, figures 5 and 8) seen with cluster 1 demonstrating the highest proportion of work done at the knee (effect size 0.72–0.92).
Cluster 2
Cluster 2 represents 19% (n=62) of the cohort and is differentiated from cluster 1 and 3, predominantly by greater degrees of hip flexion (effect size 0.86–1.41) throughout braking and acceleration (table 1). At the pelvis, we observed an increased anterior tilt (figure 4E) as well as decreased contralateral drop and ipsilateral rotation throughout the cycle. At the thorax, cluster 2 demonstrated an increased anterior tilt and ipsilateral drop (figure 4F). Again this maps well with kinetics demonstrating the highest proportion of work done at the hip (table 2, figures 5 and 8).
Cluster 3
Cluster 3 represents 41% (n=132) of the cohort and was characterised by reduced hip and knee flexion as well as increased contralateral pelvis drop (table 1). In addition, cluster 3 demonstrated a decreased knee valgus, internal rotation of the hip, less hip extension and greater hip adduction in the acceleration phase than the other clusters. We further observed an increased contralateral pelvis rotation. The thorax demonstrated increased contralateral drop (during the acceleration phase) and rotation towards the direction of travel (contralateral rotation) (table 1). Cluster 3 featured the predominant work done at the ankle with plantarflexor and evertor moments greater in the first part of the cycle but smaller in the latter part 75–100% (table 2 and figures 5 and 8).
Clinical diagnoses
Participants were classified into one or more of the five anatomical diagnoses, based on previous clinical and MRI examination (table 3).29 A primary clinical diagnosis of pubic aponeurosis injury was made in 194 (61%) cases (Dx aponeurosis); hip injury was diagnosed in 63 (20%) cases (Dx hip)—these overlapped in 8 (2%) cases (Dx aponeurosis and Dx hip). Eight patients (2%) were referred for arthroscopic hip evaluation (Dx hipflex). Adductor injury was diagnosed in 45 (14%) cases (Dx adductor), and inguinal injury in 2 (1%) cases (all related to the ilioinguinal nerve; Dx inguinal). The diagnosis Dx aponeurosis and Dx adductor and Dx aponeurosis and Dx hipflex was made each in one case. These are explored in detail in a complementary paper.29 No significant relationship (p>0.644) exists between movement cluster and the anatomical diagnoses. The most common anatomical diagnosis of aponeurosis injury was evenly distributed between movement clusters (table 3).
Relationship between cluster and anatomical diagnosis (%*)
Discussion
This is the first study to examine movement patterns in participants with AGP during a change-of-direction task. While performing a planned maximum effort change-of-direction task, participants with a current symptom of AGP could be characterised as using one of three distinct movement strategies. These strategies may represent different mechanisms of distributing the resultant load, between segments that is, a thorax, hip, knee or ankle dominant strategy that could lead to tissue overload and propagation of AGP or may be compensatory due to the injured structure being unable to tolerate that load or the pattern of neuromuscular control altered.42
Underlying mechanism
Hip joint
Data are not available to relate kinematic measures to the resulting hip joint force for change-of-direction tasks; however, any change in hip flexion angle will alter muscular action43 and ultimately the resultant hip joint force.44 ,45 Hip flexion differed strongly between clusters over the whole movement cycle (cluster 2>1>3), with a mean difference of 17° between cluster 2 and 3. During hip flexion, the vector of the resultant joint force fluctuates.46 This implies large differences in anterior hip joint forces between the clusters. In particular, high shear forces might present a risk in overloading stabilising muscle, as the cartilaginous surface of hip is designed to primarily tolerate compressive load.47 This was previously demonstrated during walking where Lewis et al45 reported significant changes (24%) in anterior hip joint force (forces through the acetabulum and anterior pubic ramus) with only a 2° reduction in hip extension angle. The different hip flexion angles found among clusters are likely to alter the hip shear force and suggest differing sites of load.
Proximal segments
The thorax segment demonstrated large differences in all three planes between the clusters. The thorax accounts for upwards of 35% of body mass,34 its position is influenced by pelvis orientation and controlled in part by the abdominal muscles (internal and external obliques, rectus abdominis and transversus abdominis), which form the inguinal ligament superiorly and join the tendinous fascia of the common adductors inferiorly to form an aponeurosis at the pubic symphysis.48 In our cohort, we identified this as the primary site of pain in >60% of cases.
Greater thorax anterior tilt (cluster 2) has been associated with greater adductor longus activation49 and greater activation of the hip extensors. To date, no relationship has been demonstrated between thorax angles and hip or groin injury; however, studies have demonstrated an association between thorax angles and knee injury.50 ,51 We observed significant differences in magnitude and orientation of thorax and pelvis angles in the sagittal plane between the clusters, demonstrating an independent behaviour between thorax and pelvis where pelvic sagittal tilt is independent of torso movement. This differs from Houck et al,52 who reported that thorax and pelvis could be considered as one segment—our findings indicate the opposite.
The relationship between interdependent body segments, with respect to joint position and segmental work, is known as dynamic coupling53 or intersegmental linkage,54 and as such, the influence of the position of the thorax55–58 must be considered in analysis of pelvic and lower limb biomechanics. The pubic symphysis can be thought of as the pivot or fulcrum around which many of these forces are exerted59 and pain in the pubic symphysis and rami is a common clinical sign in AGP.
Our cohort demonstrated different movement strategies between thorax and pelvis (figure 4E). The range of variation in these relationships could alter how the force is transmitted to the pubic bone by the displacement of centre of mass from centre of pressure, which alters the distribution of load by joint to differ. Increases in shear and compressive loading at the pubic symphysis, rectus abdominis and adductor attachments could also change the relationship between risk of injury to on-field training load. We propose that such a change in loading leads directly to the pubic bone oedema often seen on MRI imaging in this condition60 referred to incorrectly as osteitis pubis.61 It follows that a degree of bone oedema occurs in asymptomatic athletes by a similar mechanism of multidirectional loading13 ,62 and has been demonstrated not to resolve post-surgery for AGP.63 ,64
Distal joints
The ankle joint is often not considered when examining hip or knee injuries. However, the ankle joint determines how GRFs travel to proximal joints. The kinematics of the ankle joint differed strongly in all three planes in magnitude and shape. Cluster 1 demonstrated much larger magnitudes in eversion and external rotation and demonstrated medium ankle work in comparison with cluster 2 (least work done) and 3 (largest work done), while all three clusters differ in their ankle flexion angles. This suggests that each of the identified ankle joint strategies induce forces to proximal joints differently.
Relationship between the movement strategy and clinical diagnosis
We expected to see a relationship between cluster type and the specific anatomical diagnosis, which was not the case. If AGP is the result of uncoupling of segmental control in repetitive multidirectional movements, a continuum of musculotendinous and bony overload may be a more appropriate aetiological model. Our belief is that a margin of tolerance exists anatomically and biomechanically for the task execution of propagative movements for a given individual. This margin diminishes with increased training load, genetic anatomical variation, deviation of movement pattern or other extrinsic factors.
Exceeding this margin can lead to subcritical tissue overload—which we propose as a biomechanical overload, the mechanism for AGP development. However, the current study does not examine this assumption, and a prospective study is needed to examine this hypothesis, especially given the finding that there was no relationship between technique and diagnosis.
We contend that the condition AGP is the emergence of a site of tissue failure secondary to biomechanical overload. Once exceeded, either due to training load, technical deficiencies or underlying anatomical abnormality/injury, this presents as a pain at the site of tissue failure.65 Coordinated muscle function (strength, power, timing of activation and endurance) is intrinsic to an athlete's ability to control change of direction and produce coordinated movement execution.24 ,25 Changing strength in isolation, in runners, is insufficient to alter movement patterns and coaching intervention using biofeedback, and intrinsic and extrinsic cueing is required.66–68 Little work has been done on the changing and coaching of change-of-direction mechanics to date in a rehabilitation setting. The differing movement strategies shown in our cohort strengthens the argument for an approach to rehabilitation, which addresses these deficiencies. Further work is required to assess the features of the rehabilitation before intervention strategies can be developed. However, our research suggests that a ‘one-size fits all’ approach, focussing on hip strength is unlikely to be effective.
Existing non-surgical rehabilitation programmes mainly target the adductor muscle, due to perceived strength deficit23 ,69 ,70 or the abdominal muscles. In our study, hip adductor moment that is, the force calculated using inverse dynamics exerted to either oppose abduction or produce adduction is predominately, but not exclusively, produced by the adductor muscle complex and was used as a proxy for adductor strength. We did not identify consistent weakness in this measure in any of the clusters as a target for rehabilitation. This was similar in analysis of thorax/pelvis motion. Although the existence of three distinct clusters suggests possible differentiation of targets for rehabilitation, further work is underway to determine the validity of this approach, rather than the traditional focus on the painful structure.
Biomechanical studies commonly analyse a selected discrete point in combination with a single group design which assumes that (i) differences in overload pattern can be described in a few selected measures (ie, peak moment at peak knee flexion) and (ii) the injury mechanism is homogeneous, respectively. Applying such design may discard important information, and the inherent differences in movement strategies across group members could also act to mask each other's overload mechanism.36 ,37 A more advanced way of examining data is the use of continuous and subgroup analysis designs, which has been reported to be superior over a discrete single group design.37 ,71–74 As such, these techniques were applied in this study.
Our speculation—a possible future
The measurement of movement strategies and quality have been used before in areas such as back pain.75 It has also been noted that the site of pain perception often does not correlate with the site or extent of anatomical injury in many areas.76–78 Perhaps in our focus on the individual injury sites, we have lost sight of the larger view, and we suggest that, in the future, research into AGP should spend less introspective focus on trying to subclassify into anatomically painful structures15 but on the resolution of painful propagative movements in rehabilitation and injury prevention.
Our study does not include a comparison of normative (uninjured) participants. We exclude a comparison with normative data for the current analysis as we were specifically looking at categories within this cohort. AGP could originate from either the inability to execute different movement strategies (eg, continuous overload of a tissue rather than distribution of load over multiple tissues) or the execution of a task using the extreme characteristics of a movement pattern. The question of ‘what is an optimal movement’ remains. The literature does not satisfy the requirements of such an ‘optimal’ movement in any change-of-direction challenge, although we have demonstrated the performance determinants of this cutting manoeuvre previously in normal participants.31 The question remains, however, whether variability within or between clusters is injurious or protective and remains yet to be determined and is the subject of ongoing work.
We tested our participants in a planned maximal effort on clockwise and counter clockwise 110° change of direction. We acknowledge that strategies employed in an unplanned reactive cut79 may be more stressful in neuromuscular load80 and may reveal different strategies.52
Conclusions
This is the first cohort of patients with AGP in which multiplanar multijoint segmental control was assessed in a change-of-direction manoeuvre. The participants were distributed among three distinct ‘clusters’ during the biomechanical examination. Anatomical diagnoses were distributed among the three clusters.
What are the findings?
Patients with long-standing AGP were grouped into three distinct biomechanical clusters during the performance of a planned 110° cutting manoeuvre.
Movement strategies differed in torso, pelvis, hip, knee and ankle joint angle in multiple planes in a cutting manoeuvre.
Distribution of lower limb joint work was significantly different between each cluster in a planned 110° cutting manoeuvre.
There was no correlation seen between anatomical subgrouping/entity and the biomechanical diagnosis.
How might it impact on clinical practice in the future?
AGP may be thought of as musculotendinous and bony overload resulting in painful structures without a specific critical injury.
Considering the three dimensional analysis of movement pattern during a change of direction can give a meaningful addition to a clinical examination.
The three observed clusters should be explored as targets for rehabilitation to guide return to pain-free play.
The existing approach, of trying to identify anatomical classification of painful, as opposed to injured structures may give way to whole body focus on movement.
Acknowledgments
The authors would like to thank Eadaoin Holland, Steven West, Ciara Black, Eamon O'Reilly and Jenny Ward who assisted in the collection of data and the many Sports Surgery Clinic (SSC) staff who contributed to the data processing and all of the participants who agreed to take part in this study.
References
Footnotes
Twitter Follow Enda King @enda_king, Andy Franklyn-Miller @afranklynmiller
Contributors AF-M wrote the original draft in conjunction with CR. SG provided specific additional material and writing in the discussion. ECF, EK, SS and KM were integral to study design data collection and interpretation, statistical analysis and editing of the manuscript substantially.
Funding This study was funded by the SSC, and as an industrial partner of INSIGHT, Dublin City University and Science Foundation Ireland (SFI) under grant number SFI/12/RC/2289.
Competing interests None declared.
Ethics approval Sports Surgery Clinic Hospital Ethics Board.
Provenance and peer review Not commissioned; externally peer reviewed.