Figure 3
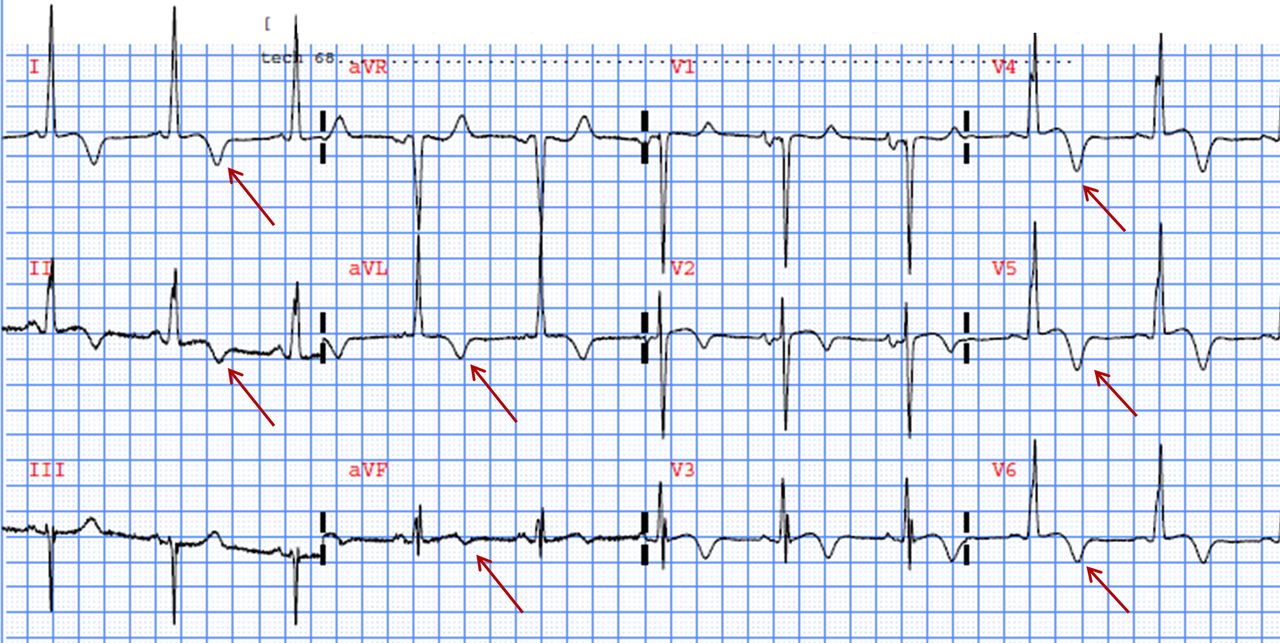
Markedly abnormal ECG in a patient with hypertrophic cardiomyopathy. Note the deep T wave inversions in the inferolateral leads (V4–V6, I and aVL, II and aVF). This ECG pattern may represent apical hypertrophic cardiomyopathy which is not adequately evaluated by echocardiography. Cardiac MRI is recommended. This figure is only reproduced in colour in the online version.
Vol 58 Issue 8
Table of Contents


Share this article
Click the icon of the social media platform on which you would like to share this article.


Email this article to a friend
Respond to this article