
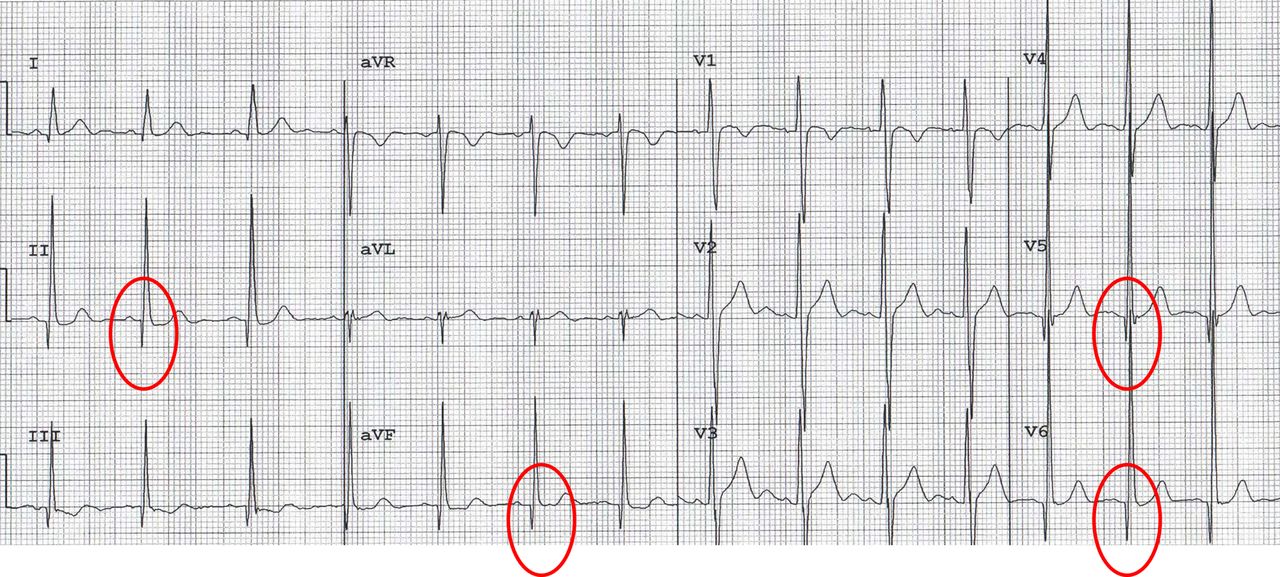
Figure 5
Abnormal ECG in a patient with hypertrophic cardiomyopathy. Note the abnormal Q waves (>3 mm in depth) in V5–V6, II and aVF. This figure is only reproduced in colour in the online version.
Vol 58 Issue 8
Table of Contents


Share this article
Click the icon of the social media platform on which you would like to share this article.


Email this article to a friend
Respond to this article