Article Text

Abstract
Objectives To examine the time course of wellness, fatigue and performance during an altitude training camp (La Paz, 3600 m) in two groups of either sea-level (Australian) or altitude (Bolivian) native young soccer players.
Methods Wellness and fatigue were assessed using questionnaires and resting heart rate (HR) and HR variability. Physical performance was assessed using HR responses to a submaximal run, a Yo-Yo Intermittent recovery test level 1 (Yo-YoIR1) and a 20 m sprint. Most measures were performed daily, with the exception of Yo-YoIR1 and 20 m sprints, which were performed near sea level and on days 3 and 10 at altitude.
Results Compared with near sea level, Australians had moderate-to-large impairments in wellness and Yo-YoIR1 relative to the Bolivians on arrival at altitude. The acclimatisation of most measures to altitude was substantially slower in Australians than Bolivians, with only Bolivians reaching near sea-level baseline high-intensity running by the end of the camp. Both teams had moderately impaired 20 m sprinting at the end of the camp. Exercise HR had large associations (r>0.5–0.7) with changes in Yo-YoIR1 in both groups.
Conclusions Despite partial physiological and perceptual acclimatisation, 2 weeks is insufficient for restoration of physical performance in young sea-level native soccer players. Because of the possible decrement in 20 m sprint time, a greater emphasis on speed training may be required during and after altitude training. The specific time course of restoration for each variable suggests that they measure different aspects of acclimatisation to 3600 m; they should therefore be used in combination to assess adaptation to altitude.
This is an Open Access article distributed in accordance with the Creative Commons Attribution Non Commercial (CC BY-NC 3.0) license, which permits others to distribute, remix, adapt, build upon this work non-commercially, and license their derivative works on different terms, provided the original work is properly cited and the use is non-commercial. See: http://creativecommons.org/licenses/by-nc/3.0/
Statistics from Altmetric.com
Introduction
International soccer matches may be played at a high altitude. This generally represents a disadvantage for visiting teams.1 The changes in air resistance affects ball trajectories2 and the decreased oxygen (O2) availability reduces aerobic capacity.3 The availability of O2 is essential for match running performance4 ,5 and also assists the ability to repeat high-intensity efforts.6 While the optimal time of arrival prematch has received very limited consideration,1 ,7 it is generally recommended to arrive ∼2 weeks before competition to allow partial acclimatisation.1 For instance, 6 days of acclimatisation at 1600 m was insufficient to avoid impaired match running performance.5 Since the time required for acclimatisation is likely altitude-dependent,1 ,8 longer periods may be required for matches played at higher altitudes.
Altitude training camps are also used to increase sea-level physical performance.4 ,9 However, little is known about player tolerance to those camps. Living at high-altitude presents a physiological challenge for native sea-level athletes, with depressed immune function,10 altered autonomic function,11 acute mountain sickness (AMS) and sleep disturbance reported.1 These responses are problematic as they can negate the expected ergogenic benefits of the camps.12 Therefore, to optimise such training programmes, there is a need to examine the time course of wellness, fitness and performance responses during such camps. A need also exists to identify the most useful tools for monitoring these changes.
The use of wellness questionnaires to monitor training responses has grown exponentially.13 ,14 There is also growing interest for heart rate variability (HRV) measures15 ,16 and heart rate (HR) responses to submaximal exercise,13 ,15–17 since both are largely associated with high-intensity running performance (field tests). Whether these measures can also be used successfully in the context of a high-altitude training camp is however still unknown, as is whether these measures are equally useful for sea-level versus high-altitude natives.
The primary aim of the present study was to examine the time course of wellness, fatigue and performance markers during a high-altitude training camp in sea-level and altitude native soccer players. The secondary aim was to assess the effects of the camp on the physical performance of native sea-level players after returning to near sea level.
Methods
Participants
Twenty Australian (16.0±0.4 years, 179±5 cm, 68.5±5.6 kg and 2.4±0.5 years from predicted peak height velocity ((PHV18)) and 19 Bolivian (18.1±1.0 years, 171±6 cm, 63.5±7.3 kg and 2.9±0.8 years from PHV) soccer players participated in the study.19 Australian players had no previous experience at high altitude (>2500 m). Before the camp, the Australians played a two-week tournament in Saudi and then rested for a week. The Bolivians were in the final stage of their preparatory season. During the competitive season, the Australian as well as the Bolivian players trained/played ∼8–9 h/week (4–5 sessions+1 game). The project was approved by the Australian Institute of Sport (AIS) and the Instituto Boliviano de Biología de Altura ethics committees.19 All players (or guardians if under 18 years) provided written consent before participating.
Study overview
Players participated in an 18-day camp comprising 6 days at 430 m, (Santa Cruz, ‘near sea-level’) and 12 days at 3600 m (La Paz, ‘altitude’). The overall study design has been detailed in figure 1 of the companion paper.19 Possible travel effects are also discussed in another article.20 Training load (arbitrary units) was calculated for all players as total training duration (min)×session rating of perceived exertion (RPE, CR10 modified Borg's scale), collected within 10 min of completing each training session.21 Players performed the Yo-Yo Intermittent recovery test level 1 (Yo-YoIR122) and a 20 m sprint at near sea-level (Santa Cruz stadium, 430 m) and repeated these twice at altitude (Valle De Sol stadium, 3000 m, Lipari, Bolivia). These performance tests were also conducted in Canberra (AIS, 580 m above sea level, Australia) on a subgroup of 10 Australian players (16.1±0.6 years, 181±8 cm, 70.5±7.7 kg and 2.8±0.7 year from PHV) who were members of the AIS football programme, twice before the camp (in-season during a high-intensity training phase), and 11 days after the camp. The remaining players (n=10) could not be tested at these times because they resided in different locations around Australia. On most days during the camp, body mass, resting arterial O2 saturation (SpO2, Choice Pulse Oximeter OxyWatch MD300C63, Beijing, China) resting HR (HRrest), resting HRV, perceived wellness and Lake Louise scores were assessed after awakening and HR and RPE (CR10 modified Borg's scale) responses to a standardised 5 min submaximal run (9 km/h over 20 m shuttles13) were measured before each training session/match.23 While the players were not assisted by a nutritionist, coaches and support staff ensured that all players ate adequately and adopted a ‘healthy’ style of eating during the entire camp.

Mean daily training load (± SD) for the Australian (AU) and Bolivian (BO) teams. Circled numbers indicate days when physical performance tests were performed. The green background area represents time spent in altitude (3600 m). Numbers indicate between-group standardised differences (90% confidence limits)/chance for this difference to be greater than the smallest worthwhile difference (see methods).
Performance tests
During the camp, tests were performed on outdoor grass fields on the mornings of days 5 (30°C, 53% relative humidity (RH), crosswind speed 1.0–3.5 m/s), 3 (17°C, 35% RH, 0.8–2.0 m/s) and 10 (14°C, 26% RH, 0.8–2.5 m/s). Players performed three-timed 20 m sprints using electronic timing gates (Fusion Sport, Coopers Plains, Queensland, Australia). Each sprint started from a standing start with the front foot immediately behind the starting line (0 m) and the best performance was analysed. The typical error of similar sprint tests, expressed as a CV is 1.4%, 90% confidence limits, CL (1.2;1.6).24 The Yo-YoIR1 was performed as previously described,22 and presents day-to-day variations of ∼8–10%.22
HR-derived measures
All HR data were collected with a Polar Team2 system (1.4.1, Polar Electro Oy, Kempele, Finland). Resting morning data were collected daily after awakening (except day 7), with the players sitting quietly for 8 min. After visual examination and artefact corrections, the average HR and the SD of the instantaneous beat-to-beat R–R interval variability measured from Poincaré plots (LnSD1) were calculated using the last 3 min of the recording and was used as a measure of cardiac parasympathetic activity.25 Since this index is unaffected by breathing frequency,26 it was unlikely confounded by potential differences in hypoxic ventilatory responses between groups.1 The average HR during the last minute of the 5 min submaximal run (exercise HR, HRex) was expressed as a percentage of individual maximal HR (determined from peak HR in the Yo-YoIR1), and used as an index of cardiorespiratory fitness. Day-to-day variations in resting HRV measures are ∼10–12%.27 Variations in HRex during a competitive period in soccer players average ∼3%.28
Measures of wellness and well-being
We used RPE responses to the 5 min submaximal run as an acute index of exercise tolerance. A psychometric questionnaire29 was used to assess indicators of player wellness.13 The questionnaire comprised five questions related to perceived fatigue, sleep quality, general muscle soreness, stress levels and mood with each question scored on a 5-point scale (with 1 and 5 representing poor and very good wellness ratings, respectively).13 The overall wellness was then determined by summing the 5 scores. Players also completed the Lake Louise AMS Questionnaire,30 which included five simple questions (0–3 scale) that are sensitive in quantifying levels of altitude. The overall Lake Louise score was determined by summing all scores. Both questionnaires were completed daily (except day 7) immediately after the resting HR assessments. The day-to-day variations of RPE responses to short bouts of exercise of various intensity in soccer players is ∼10%.31 There is no available reliability data for the wellness or Lake Louise questionnaires.
Statistical analysis
Data in the text and figures are presented as means with 90% CL and CI, respectively. All data were log transformed to reduce bias arising from non-uniformity error. Between-group standardised differences in all monitored variables were calculated using pooled SDs. Because of possible travel effects on wellness, fatigue and fitness measures during the first few days, the baseline values used for analysis were calculated using only the 2 days preceding ascent (except for performance). Also, to control for the possible effect of fitness status and/or initial freshness on performance responses, all analyses were adjusted for baseline values collated in each group on the day of testing. Data from the four players who became sick32 were partially removed from analysis (2–3 sick days +2 following days). Threshold values were >0.2 (small), >0.6 (moderate) and >1.2 (large).33 Uncertainty in each effect was expressed as 90% CL and as probabilities that the true effect was substantially positive or negative. These probabilities were used to make a qualitative inference about the true effect as previously described.33 Changes in body mass during the week near-sea-level and the first week at altitude were assessed using within-individual linear regressions (kg/day1, with 90% CL). A trend was considered substantial if the 90% CL did not overlap zero. Finally, multiple linear regression models (stepwise backward elimination procedure) with Yo-YoIR1 and 20 m sprint times as the dependent variables were also used. The magnitude of the correlations was rated using Hopkins’ scale.33
Results
Training load
Both teams trained 11–12 times and played five games (figure 1). The total training time at near sea level was 4.8 h and 6.2 h for Australians and Bolivians, respectively (unclear difference). At altitude, the total training time was 14.2 h and 12.6 h for Australians and Bolivians, respectively (unclear difference). At near sea level, training load was very likely greater in the Australians than in the Bolivians. This difference was almost certainly twice as great at 3600 m (figure 1).
Arterial saturation
During the first week at altitude, SpO2 was almost certainly lower for the Australians than the Bolivians (figure 2). This difference was progressively reduced from days 7–8, but the Australian values remained likely lower at the end of the camp.
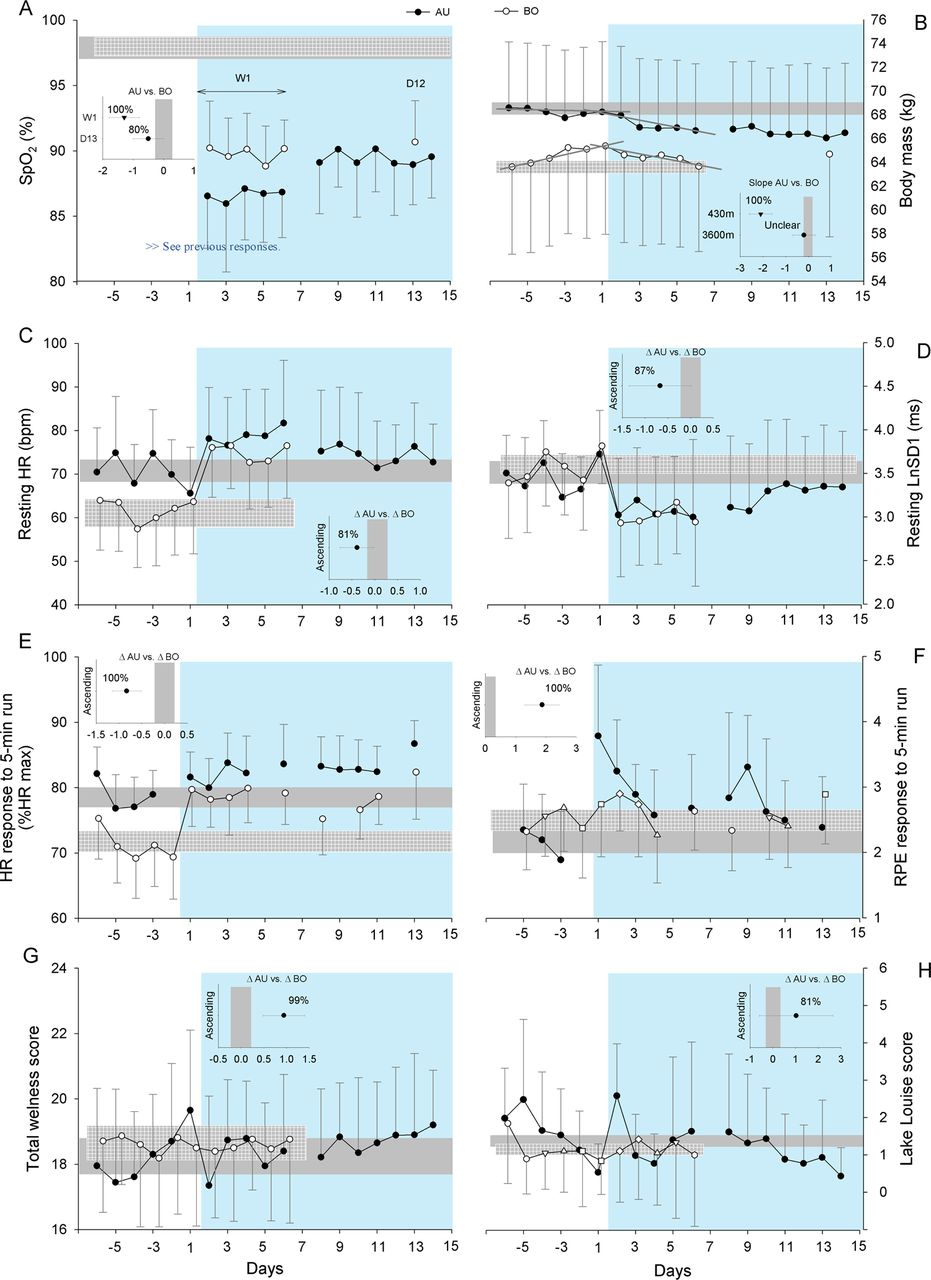
Values are presented as mean±SD for the Australian (AU) and Bolivian (BO) teams. Changes in arterial oxygen saturation (SpO2, A), body mass (panel B), resting heart rate (HR, C), resting vagal-related HR variability (LnSD1, D), HR response to the 5-min submaximal run (panel E), rate of perceived exertion (RPE) response to the 5-min submaximal run (panel F), total wellness (panel G) and Lake Louise scores (H). The green background area represents time spent at altitude (3600 m). The grey horizontal bars indicate the magnitude of trivial changes for both teams (see methods). The small inserted graphs for SpO2 and body mass show the between-group standardised differences in mean SpO2 values during the first week (W1) and on day 13 (D13), and body mass slopes (90% CIs)/chance for this differences to be greater than the smallest worthwhile difference (represented by the vertical grey bars, see methods). The inserted graphs for the six other variables show the between-group standardised differences in the change immediately after ascent (90% CIs), that is, average of the last two days versus first day at altitude/chance for these differences to be greater than the smallest worthwhile difference (represented by the vertical grey bars, see methods).
Body mass
The coefficients of determination (r2) for the linear regressions between body mass and day at near-sea-level were 0.29±0.31 and 0.78±0.29 for the Australians and Bolivians, respectively. At altitude, r2 values were 0.53±0.31 and 0.35±0.28 for the Australians and Bolivians, respectively. During the first 6 days near sea level, body mass increased almost certainly more in the Bolivians (0.38, 90% CL (0.32;0.43) kg/day) than the Australians (−0.04 (−0.13;0.04) kg/day) (figure 2). During the first altitude week, body mass decreased substantially both in the Australians (−0.27 (−0.19;−0.35) kg/day) and Bolivians (−0.21 (−0.09; −0.33) kg/day), with an unclear difference between the teams. The increase in body mass in the Bolivians near sea level was likely faster than the body mass loss at altitude (−0.7 (−1.2;−0.1), with 91% chances of greater values).
HR measures
After arrival at altitude, HRrest increased and LnSD1 decreased likely more in the Bolivians than Australians (figure 2). Both HRrest and LnSD1 returned to near sea level values by day 10 for the Australians and remained almost certainly elevated on day 5 in the Bolivians (standardised difference +0.8, 90% CL (0.6;0.9)). The increase in HRex at altitude was almost certainly greater for the Bolivians than Australians, both on arrival (figure 2) and at the end of the camp (+0.6(0.2;1.0)). It was almost certain that HRex did not return to near sea level values in either group by the end of the camp (+1.9(1.6;2.2) and + 2.1(1.6;2.5) for Australians and Bolivians, respectively).
Perceived measures
The RPE response to the 5 min run at altitude increased almost certainly more in the Australians than Bolivians; values returned to baseline within 2 days and 1 day at altitude in the Australians and Bolivians, respectively (figure 2). Total wellness and Lake Louise scores showed likely to very likely greater disturbance in the Australians on arrival, but normalised after the second day of exposure (figure 2).
Physical performance
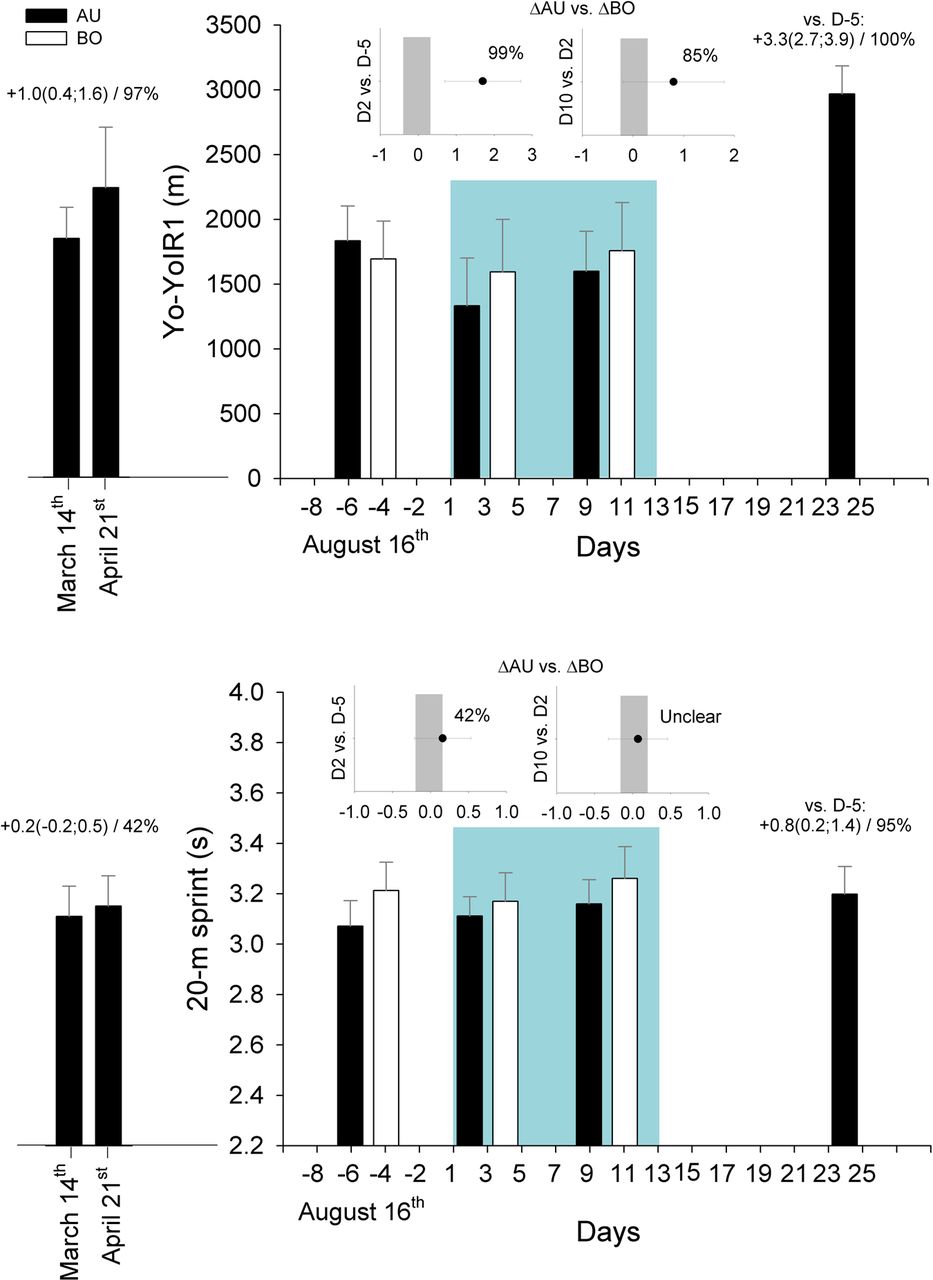
Only 13 Australian and 15 Bolivian players performed all three test sessions. From the 10 players also tested in Canberra, only 6 performed the 5 tests. On arrival at altitude, Yo-YoIR1 very likely decreased more in the Australians than Bolivians (figure 3). At the end of the camp, Yo-YoIR1 remained likely impaired in the Australian players (−0.9(−1.6; −0.3)) but returned to near sea-level values in the Bolivians (+0.1(−0.2;0.5)). Eleven days postcamp there was a very large and almost certain increase in Yo-YoIR1 in the Australians compared with baseline measures at near sea level.

Changes in Yo-Yo Intermittent Recovery test level 1 (upper panel) and 20 m sprint time (lower panel) for the Australian (AU, n=13) and Bolivian (BO, n=15) players. The inserted graphs show the between-group standardised difference in the change (90% CIs)/chance for this difference to be greater than the smallest worthwhile difference (represented by the vertical grey bars, see methods). The data from six AU players, who were also tested before and after a 5.5-week period preceding the camp (March–April 2012), and 11 days after the camp, are presented as complementary data. Numbers indicate within-group standardised changes in performance (90% confidence limits)/chance for these changes to be greater than the smallest worthwhile change. The green background area represents time spent at altitude (3600 m).
On arrival at altitude, there was a slightly greater impairment in 20 m sprint performance in the Australians than Bolivians (figure 3). There was no clear between-group difference in the change during the camp. However, at the end of the camp, compared with near sea level, 20 m sprint time was very likely impaired in the Australians (+0.7(0.4;1.1)) and likely impaired in the Bolivians (+0.4(0.1;0.6)). Eleven days postcamp, 20 m time was further impaired for the Australians.
Associations between variables
The only clear predictors of changes in Yo-YoIR1 were ΔHRex and ΔLnSD1 in the Australians, and ΔHRex in the Bolivians (table 1). All perceived measures were excluded from the models. There was no clear predictor of changes in 20 m sprint time.
Predictors of Yo-YoIR1 running performance
Discussion
The main results were as follows: (1) the Australian players had moderately-to-largely greater impairment in wellness, RPE and high-intensity running performance than the Bolivians when arriving at altitude; (2) the acclimatisation of most measures to altitude was slower in the Australian than in the Bolivian players; (3) precamp high-intensity performance was reached only by the Bolivians by the end of the camp; (4) both teams showed an impairment in 20m sprint times at the end of the camp; (5) HRex was the only variable showing clear associations with changes in high-intensity running performance in both teams.
Living at altitude
Near sea level, body mass increased in the Bolivians (0.4 kg/day) but remained stable for the Australians (figure 2). While body composition data are lacking, this increase in the Bolivians was likely related to plasma volume expansion34 and the development of peripheral oedema.1 Conversely at altitude, both teams lost 0.2–0.3 kg/day during the first 5 days (figure 2), which is in agreement with previous data in young skiers during a 6-day training camp at 2830 m.35 This suggests a generic altitude effect for both teams (eg, dehydration mechanisms triggered by the drier air and hyperventilatory responses8), and that preacclimatisation is unlikely to affect this response. As expected, wellness and Lake Louise scores showed greater disturbances in Australians, but as previously reported,1 ,35 ,36 these perturbations normalised within 2 days (figure 2). These team-average data suggest that both teams coped well with training and/or altitude. The detailed analyses of sleeping patterns20 complete the overall picture.
It took 10 days at altitude for cardiac autonomic activity to normalise in the Australians (figure 2). This recovery rate was faster than that reported at 4500 m,11 and likely related to the lower altitude. The time course of HRrest and resting HRV was actually similar to that of SpO2 in the present study, which increased after the first week. Similarly, in cross country skiers sleeping at a simulated altitude of 3500 m, SpO2 did not change within 5 days.36 Changes in HR measures were nevertheless dissociated from perceived measures (figure 2), suggesting that both variables may inform on different aspects of altitude acclimatisation. Because of the limited reliability of RPE responses to submaximal runs (>30%37) in comparison with HR (3%), RPE is likely less sensitive to slight changes in exercise intensity. It is also possible that the increase in cardiovascular work (ie, ∼3–5% for HR) at this low relative intensity was not large enough to affect perception of effort. In contrast, RPE response may be more related to ventilatory response, which takes a few days to normalise.1 Surprisingly however, the Bolivians and not the Australians, had the greater HRV changes, suggestive of greater autonomic perturbation. These results may reflect a limitation of HRV measures to accurately assess cardiac autonomic function in the present setting, at least in high-altitude native players examined near-sea-level. Since an increased blood volume decreases HR and increases HRV,38 the fluid alterations observed in the Bolivians34 could have triggered parasympathetic activity further than its actual resting level. This phenomenon should not be overlooked when using resting HR measures to estimate cardiac autonomic activity.
Training and playing at altitude
During the camp, despite matching training volume, the Australians reported systematically greater perceived training/playing loads than the Bolivians (figure 1). While this initial difference could be related to carry-over effects of international travel, and acknowledging that data on external load (eg, distance covered at different speeds assessed through GPS) would be required to fully characterise training load in both groups, the doubling of the between-group standardised difference at altitude suggests a direct effect of altitude on the perceived exertion for the non-acclimatised players. This hypothesis is confirmed by the greater RPE increase in response to the submaximal run at altitude in the Australians (figure 2). In addition to a possibly greater relative training intensity, hypoxia itself also affects perceived exertion.39 In fact, central fatigue is likely elicited by low brain oxygenation,40 which was possibly lower in the Australians if we consider resting SpO2 levels (figure 2).
Physical performance at altitude
On arrival at altitude, high-intensity running performance decreased in both groups, but more in Australian players (figure 3). These findings are consistent with the moderately greater decrease in  O2max reported in adult native sea-level versus high-altitude football players tested within 2 days of arrival at 3600 m (standardised difference in the change is −1.1 for sea-level natives).41 The large Yo-YoIR1 performance decrement in Australian players (−30%, standardised decrease of 1.4) was also within the range of that reported for
  O2max at 3600 m (−24%41) or during an incremental running test in native sea-level athletes (−20% at 2830 m35). After 9 days at altitude the Australians’ performance remained moderately impaired (figure 3). This confirms that with respect to high-intensity running performance, acclimatisation of sea-level natives to 3600 m requires >2 weeks and may never reach those at sea level.1 Finally, it is worth acknowledging that the long-haul flight and the descent from altitude to which the Australians and Bolivians were respectively exposed likely affected their baseline values for the first few days of the camp. While it is impossible to quantify the magnitude of these possible effects on players' initial physical performance, these effects were accounted for in the analysis (see Statistical analysis section). Nevertheless, the impairment observed at altitude would be greater, and the recovery time course longer, if compared with tests performed under optimal conditions.
Somewhat surprisingly, sprint performance decreased moderately throughout the camp (figure 3). While the reduced air density at high altitude would be expected to acutely improve sprint performance,42 the decreased running intensity and the reduced number of sprints and accelerations during games43 (and likely training) might have weakened the daily neuromuscular load, resulting in a partial ‘detraining’ of speed.44 In fact, because of the busy match schedule, no speed-specific sessions were implemented by either team. While a possible neuromuscular fatigue (alteration in central drive or even a peripheral limitation due to chronic hypoxic stress) could also explain the impaired sprint performance, all wellness scores, including perceived fatigue and general muscle soreness remained stable after the acute acclimatisation period. Additionally, if fatigue occurred, it is likely that HRrest and HRV would also have changed accordingly.
Monitoring changes in physical performance at altitude
HRex was the only variable that had trends comparable to those of Yo-YoIR1 performance in the Australian players (table 1), that is, increased on arrival and did not return to baseline values (figure 2). An acute elevation of HRex is common7 ,8 ,45 at altitude and its recovery is likely related to altitude severity.5 ,7 It is however worth noting that as with resting HRV, the acute changes observed in the Bolivians after returning to altitude were exacerbated, possibly due to their plasma volume expansion at near-sea-level.34 This hypothesis is confirmed by the fact that, in contrast to Yo-YoIR1 performance, HRex did not return to baseline values by the end of the camp in the Bolivians. These results confirm that HRex is a valuable high-intensity performance monitoring tool,13 ,16 ,17 but like resting HR measures, acute changes in blood volume should also be considered when interpreting a player's training status. The small but clear additional contribution of cardiac parasympathetic activity to Yo-YoIR1 performance changes in the Australian players (table 1) confirms the association between vagal activity and readiness to perform high-intensity intermittent exercise.15 The lack of association between all perceived measures and Yo-YoIR1 performance (table 1) is in agreement with the dissociation between Lake Louise scores (recovered within 3–4 days) and high-intensity performance (impaired after 6 days) observed in young skiers at 2830 m.35 Finally, since the performance tests were conducted outdoors on sport-specific surfaces, environmental conditions could not be controlled. The potential effect of these factors on performance, perceived and HR variables therefore could not be quantified, which is a limitation of this study.
Altitude-training camps: are they worthwhile?
The increase in Yo-YoIR1 11 days after the camp was very large (figure 3), and importantly, three times greater than the increase observed earlier during the season. Although limited to only six players, these results confirm the generally reported aerobic-related performance rebound 1–2 weeks after descent from altitude.9 The exact physiological mechanisms of this improved high-intensity running capacity remain unclear, but the haematological changes reported34 should be considered. After the camp sprinting performance was further impaired; this impairment was four times greater than that earlier during the season (eg, March to April). Considering the importance of sprinting ability in soccer,46 a greater emphasis on speed training may be recommended during and following altitude training.
Conclusions
To prevent a drop in high-intensity running performance at high-altitude, acclimatisation periods of at least 2 weeks are recommended. A greater emphasis on speed training may be required during and following altitude training. HRex and HRV indices may be the most practical tools to track acclimatisation to altitude, particularly in non-altitude natives. Psychometric measures showed limited usefulness for tracking performance changes in the present setting.
What is known on this subject
-
The decreased oxygen availability at high altitude impairs aerobic exercise capacity; conversely, single sprint performance is acutely improved.
-
Psychometric and physiological measures, such as questionnaires or heart rate (HR) responses, can be used as indicators of acclimatisation to altitude.
-
At least 2 weeks of acclimatisation at the altitude of competition is generally recommended before playing matches, but information on team sports is lacking.
What this study adds
-
Two weeks of acclimatisation at high-altitude is not long enough for native sea-level players to fully recover their high-intensity running performance, despite resting measures of HR, HR variability and wellness having returned to normal.
-
A 2-week altitude training camp may impair sprint performance, probably as a result of the inability to maintain an appropriate neuromuscular load during training and matches.
-
The HR response to a submaximal running test can be used to estimate changes in high-intensity performance at altitude in native sea-level players.
References
Footnotes
-
Contributors MB, BMS,LAG-L,KH, MK,WFS, RJA, RS, CS, GDR, JCJC, NS, CJG and PCB were involved in the conception and design or analysis and interpretation of data, drafting the article or revising it critically for important intellectual content and provided their final approval of the version to be published.
-
Competing interests None.
-
Patient consent Obtained.
-
Ethics approval Ethics Committees of the Australian Institute of Sport (AIS) and of Instituto Boliviano de Biología de Altura (IBBA), the latter via University Mayor de San Andres, La Paz, Bolivia.
-
Provenance and peer review Not commissioned; externally peer reviewed.