Article Text

Abstract
Background To promote and maintain health, all adults are recommended to do moderate-intensity aerobic activity a minimum of 30 min on 5 days, or vigorous-intensity activity of 20 min on 3 days, each week. Whether these levels prevent long-term weight gain is uncertain.
Objective To assess the relationship between physical activity and long-term weight gain.
Study design An observational prospective cohort study.
Methods Weight and physical activity were measured in the Nord-Trøndelag Health Study in 1984–1986, 1995–1997 and 2006–2008. Participants (n=19 127) were classified based on physical activity into inactive, below recommended level, recommended level or above recommended level. We carried out adjusted mixed model regression analyses with weight as outcome.
Results Men maintaining physical activity above the recommendations for 33 years increased 5.6 kg, while inactive men increased 9.1 kg. For women, corresponding numbers were 3.8 kg in those above recommended physical activity levels, and 9.5 kg in inactive. In adjusted analyses, physical activity above the recommendations was associated with 2.1 kg (95% CI 1.8 to 2.4) less weight gain in men over any 11-year period, compared with inactive. Women exceeding the recommendations gained 1.8 kg (CI 1.5 to 2.2) less than inactive. Compared with inactive, the ORs of gaining meaningful weight of ≥2.3 kg were 0.79 (CI 0.69 to 0.91) and 0.70 (CI 0.60 to 0.81) if exceeding the recommendations in men and women, respectively.
Conclusions Physical activity above the current recommendations for health benefits was associated with significantly lower risk of weight gain.
- Epidemiology
- Exercise
- Exercise and/or Caloric Restriction Effects on Body Weight/Composition
- Health Promotion Through Physical Activity
- Physical Activity Promotion in Primary Care
Statistics from Altmetric.com
- Epidemiology
- Exercise
- Exercise and/or Caloric Restriction Effects on Body Weight/Composition
- Health Promotion Through Physical Activity
- Physical Activity Promotion in Primary Care
Introduction
The western world is facing an obesity epidemic, and the prevalence of obesity among US adults has now reached 35%.1 During the past 15 years, obesity prevalence has increased in Europe, and predictions suggest a sizeable further increase in the European population by 2015.2 Being overweight or obese is associated with increased overall mortality and cardiovascular disease incidence, as well as with reduced physical and social functioning and quality of life.3–5
The significant public health burden of increased prevalence of overweight and obesity strongly emphasises the need for effective strategies for weight gain prevention. As energy expended during physical activity potentially affects body weight, we need concise guidelines about the required amount of physical activity to prevent weight gain. The current recommendations on physical activity to promote and maintain health from the American College of Sports Medicine state that all healthy adults aged 18–65 should do moderate-intensity aerobic activity for a minimum of 30 min on 5 days each week, or vigorous activity for a minimum of 20 min on 3 days each week.6 The same amount of physical activity is recommended for older adults.7 Regarding cardiovascular mortality risk, there are some studies indicating that even smaller amounts of physical activity is adequate to significantly lower the risk.8 ,9 Although not being the main goal of exercise,10 weight gain prevention is acknowledged as one of the beneficial effects. It should be evaluated, however, if the current recommendations are sufficient to combat the ongoing obesity epidemic.11–13
Lee et al11 recently found that complying with the recommended activity levels (30 min of moderate activity on most of the days) was insufficient for weight gain prevention over 13 years in middle-aged women. Only when physically active for 60 min or more per day, women were less likely to gain weight. Importantly, this association was only found in women of normal weight, and no significant association between weight gain and physical activity was observed in women who were already overweight or obese. In contrast, Hankinson et al12 found that 30 min of daily physical activity was enough to prevent weight gain in young adults.
Our aim was, therefore, to examine the associations of physical activity with weight gain in men and women throughout the adult lifespan, and to investigate potential interactions with age and body mass index (BMI). Furthermore, we argue that leisure time and occupational physical activity should be considered to further explore the association between weight gain and physical activity. Our hypotheses were that higher levels of leisure time and occupational physical activity were associated with lower weight gain, and that complying with the current recommendations for physical activity would not be sufficient to prevent weight gain.
Methods
Study population
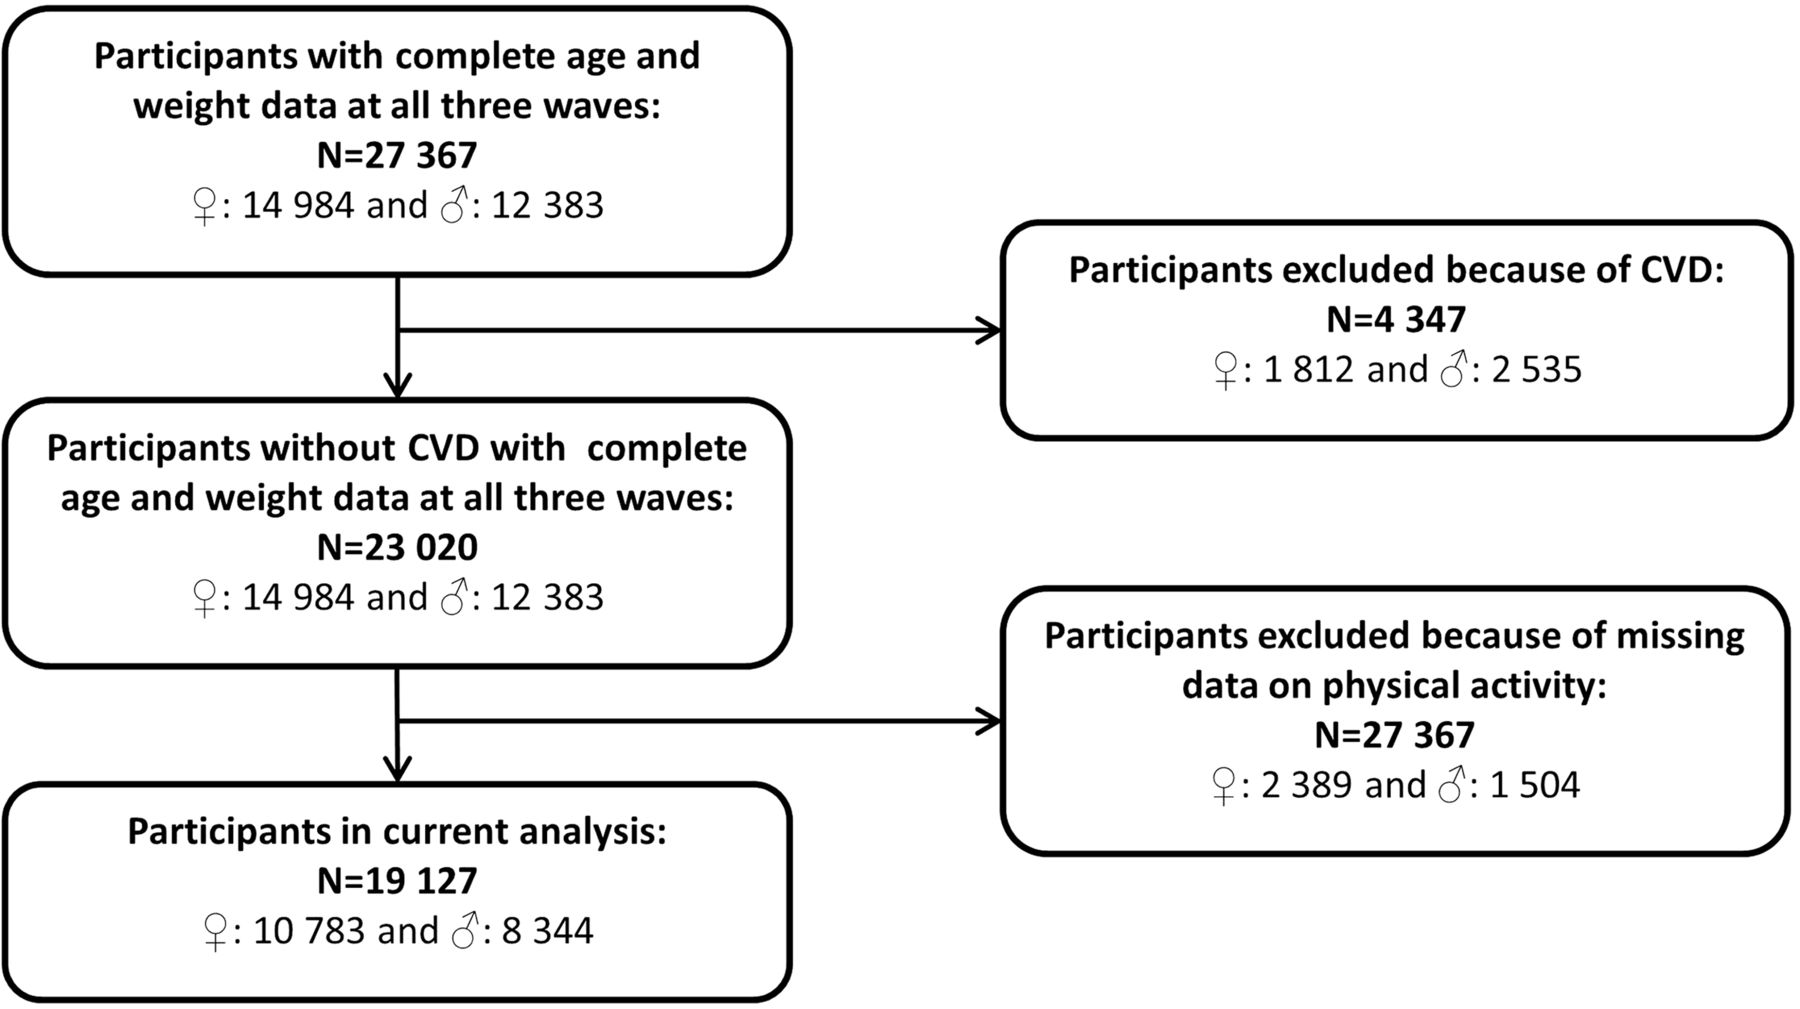
We used data from a Norwegian population study, the Nord-Trøndelag Health Study (HUNT), parts 1–3. Data collection in the HUNT study was carried out in the Nord-Trøndelag county in the middle part of Norway in three waves, first in 1984–1986 (HUNT 1, H1), second in 1995–1997 (HUNT 2, H2) and the third in 2006–2008 (HUNT 3, H3). Data collection in the HUNT studies is described in detail elsewhere.14 Briefly, all inhabitants ≥20 years in the county were invited to participate, with approximate overall participant rates in H1, H2 and H3 of 88%, 70% and 56%, respectively. The participants came for clinical visits where anthropometry, resting heart rate, blood pressure, blood lipids and glucose were measured. They also filled out questionnaires about lifestyle variables (such as physical activity, smoking, alcohol consumption) and background variables (such as education, occupation, marital status). For this study, we selected the participants with data on age, weight and physical activity at baseline in H1, and who participated in all three HUNT waves. Participants with cardiovascular disease during the follow-up period (n=4 347) were excluded, leaving 8433 men and 10 783 women (figure 1).

Flow chart of participants in the study (CVD; cardiovascular disease).
Assessment of leisure time physical activity
At baseline in H1, the participants were asked about their exercise frequency (never, less than once per week, once per week, two to three times per week or four or more times per week), duration (less than 15, 15–30, 31–60 or more than 60 min) and intensity (no sweat, sweat or exhausted). The questions on duration and intensity have been validated against direct measurements of maximal oxygen uptake.15 The ‘no sweat’ category corresponded to an intensity of about 55% of maximal oxygen uptake, regardless of the exercise duration up to 90 min, whereas the ‘sweat’ and ‘exhausted’ categories corresponded to intensities of 71–75% and 76–90% of maximal oxygen uptake, respectively, with decreased relative intensity with increasing duration of exercise.15 In H2, the participants were asked about their weekly amount of light physical activity and hard physical activity, with alternatives of ‘none’, ‘less than an hour’, ‘1–2 h’ and ‘3 h or more’. The validity of the H2 questions was found to be poorer than for the H1 questions, but the hard physical activity category was reasonably well correlated with VO2peak and with variables in the widely accepted International Physical Activity Questionnaire (IPAQ).16 In H3, the questions on physical activity were identical as in H1.
We constructed a four-level leisure time physical activity index to match with the current recommendations to promote and maintain health6; moderate-intensity aerobic activity a minimum of 30 min on 5 days, or vigorous-intensity activity of 20 min on 3 days, each week. Moderate-intensity and vigorous self-reported activity were taken into account when categorising participants, and physical activity was updated over time to allow for individual changes in activity level. The ‘inactive’ level was the one reporting no leisure time physical activity. Participants who reported physical activity below the recommendations were classified as ‘below recommended’. The ‘recommended’ level was participants reporting physical activity corresponding to the current recommendations, either as moderate-intensity exercise for 150 min each week, or as 60 min of vigorous intensity, or a combination of these, whereas participants who reported to be more active than the recommendations were classified as ‘above recommended’.
Other measurements
Occupational physical activity was assessed in all three HUNT waves and classified as ‘sedentary’, ‘walk and lift’ and ‘heavy manual work’. In the analyses, we also used data on age, gender, height, weight, BMI, sitting time, smoking status and alcohol intake. Height and weight were measured with direct measurements. BMI is weight in kilograms divided by height in metres squared. Sitting time was only measured in H3, with the question: “On a regular day, how many hours do you spend sitting?” If the participants did not answer this question, we used the sum in hours of these three questions: “How many hours per day do you usually spend in front of a computer at work?”, “How many hours per day do you usually spend in front of a computer in leisure time?” and “How many hours per day do you usually watch TV/DVD/video?”
Statistical analysis
Physical activity level differs between men and women17; therefore, we present sex-specific analyses. We compared the baseline characteristics for the participants according to the four levels of physical activity, using linear regression, linear-by-linear test for association, Kruskal-Wallis test and the Cochran-Armitage test for trend for continuous, ordinal, nominal and dichotomous variables, respectively. Linear mixed models with random intercept and slope were used to examine changes in body weight over time according to physical activity levels, using inactive participants as reference. Physical activity level was updated over time. Three models were used; model 1 adjusted for age (continuous), model 2 additionally adjusted for diabetes status (yes or no), smoking (never, former or current) and alcohol (abstainers, <1 time/14 days, 1–4 times/14 days or ≥5 times/14 days) and time period indicators of HUNT wave (H1, H2 or H3), and model 3 also adjusted for occupational physical activity (sedentary, walk and lift or heavy manual work).
We also performed stratified analyses with interaction terms to assess whether the prospective changes in body weight by physical activity levels could be modified by other factors. We investigated the potential effect modification by categorised age (<40, 40–59 or ≥60 years), BMI (<18.5, 18.5–24.9, 25.0–29.9 or ≥30 kg/m2), smoking status (current, former or never smokers) and occupational physical activity (sedentary, walk and lift or heavy manual work). Age categories were selected to give information about young adults, middle-aged and older participants.
We then assessed the OR for meaningful weight gain over time, defined as gaining ≥2.3 kg18 associated with the four physical activity categories using mixed model logistic regression analyses. Stratified analyses were conducted to assess the potential interactions with age, BMI, smoking or occupational physical activity. In separate analyses, we assessed weight change in a subgroup of 2673 participants who reported no change in physical activity over time.
We also performed sensitivity analyses to assess the robustness of our findings. For example, the association between body weight and physical activity could be influenced by time spent in a sedentary state. We examined changes in body weight associated with sedentary time only in H3 because the former two waves did not have information about sedentary behaviour. In another sensitivity analysis, we adjusted for baseline body weight measured at H1. Ninety-five per cent CIs are reported where relevant, and two-sided, p values of <0.05 were considered significant. The statistical analyses were conducted using Stata V.12.1 (StataCorp).
Results
Baseline characteristics of men and women by level of physical activity are presented in table 1. Age, weight, BMI, smoking, alcohol consumption, hypertension and occupational activity varied across physical activity groups at baseline, where active participants had favourable cardiovascular profile compared with inactive participants. The mean overall increase in weight during 22 years of follow-up was 7.7 kg (CI 7.4 to 8.1) for men and 8.5 kg (CI 8.2 to 8.8) for women. The weight gain was largest between the first and second wave, with 5.3 kg (CI 5.0 to 5.6) increase for men and 6.1 kg (CI 5.8 to 6.4) increase for women.
Characteristics of study participants according to baseline (HUNT-1) physical activity levels (N=19 127)
In multiadjusted analyses for age, smoking, alcohol and diabetes status, we found a clear dose–response association (p<0.001 for trend) between changes in body weight according to physical activity levels after allowing physical activity to be updated over an 11-year period in men and women. Compared with inactive men, above recommended level of physical activity was associated with 2.1 kg (CI 1.8 to 2.4) less weight gain, whereas recommended level of physical activity was associated with 0.7 kg (CI 0.5 to 0.9) less weight gain (p for trend <0.001). The corresponding estimates of lower weight gain among women were 1.8 kg (CI 1.5 to 2.2) and 0.5 kg (CI 0.3 to 0.7) for above recommended and recommended levels, respectively (p for trend <0.001).
We assessed modifying effects of age, BMI, smoking status and occupational activity on the association between physical activity and weight change, and found significant interactions with age and BMI in men and women. However, occupational activity and smoking modified the association only in men, and we found no evidence of interaction among women (table 2). In stratified analyses of BMI, there was a clear dose–response relationship between physical activity and weight gain only for overweight/obese men (BMI>25 kg/m2) and obese women (BMI>25 kg/m2), with a p for trend <0.001 for both. We observed less weight gain associated with above recommended levels, that is, >150 min of moderate-intensity activity or >60 min of vigorous activity each week, in overweight/obese (BMI>25 kg/m2; p<0.001) men and obese (BMI>30 kg/m2) women (table 2). Obese men and women also had significantly lower weight gain with recommended level of physical activity, that is, 150 min moderate-intensity or 60 min of vigorous activity weekly, compared with the reference category of inactive participants (table 2).
Difference in body weight in kilograms, mean (95% CI) over any 11-year period by physical activity levels
We also examined ORs of gaining ≥2.3 kg (meaningful weight gain) associated with physical activity updated over time. Compared with inactive participants, the ORs of meaningful weight gain in the above recommended category were 0.79 (CI 0.69 to 0.91) and 0.70 (CI 0.60 to 0.81) in men and women, respectively (table 3). There was a significant interaction with age for the odds of meaningful weight gain across levels of physical activity for both sexes, with lower ORs of gaining meaningful weight when physically active in older participants. In men >40 years, there was significantly reduced OR of meaningful weight gain with above recommended levels of physical activity. This was also true for women 40–59 years, whereas women >60 years had reduced OR of meaningful weight gain with recommended and above recommended levels of physical activity. BMI modified the association in women (p values for interaction <0.001), and only normal weight (BMI 18.5–24.9 kg/m2) and overweight (BMI 25.0–29.9 kg/m2) women were less likely to gain meaningful weight associated with high levels of physical activity (table 3). In men, all but the lowest BMI category (<18.5 kg/m2) had lower ORs for meaningful weight gain associated with above recommended levels of physical activity.
ORs (95% CI) for ≥2.3 kg increase in body weight over any 11-year period by physical activity levels
In subgroup analyses of men and women who reported to maintain their physical activity over the years, we observed that men who maintained above recommended levels of physical activity had increased 5.6 kg (CI 3.4 to 7.9) in body weight, while those who remained inactive had increased 9.1 kg (CI 7.9 to 10.3). Recommended levels of physical activity were associated with 7.2 kg (CI 5.5 to 8.8) increase in men. For women, maintaining above recommended levels of physical activity was associated with an increase of 3.8 kg (CI −0.2 to 7.8), compared with inactive women who increased 9.4 kg (CI 8.1 to 10.8). Recommended levels of physical activity in women were associated with an increase of 8.6 kg (CI 6.9 to 10.3; figure 2).

Weight at Nord-Trøndelag County Health Study (HUNT) 1, HUNT 2 and HUNT 3 in men and women who maintained the same level of physical activity during the whole follow-up period.
In separate sensitivity analyses, the results were not substantially different from the main analyses. When we adjusted for body weight at baseline, we found that the results were similar to the results obtained without this adjustment (see online supplementary table S1). In a cross sectional analysis of body weight and physical activity from H3, we also adjusted for sitting time in addition to the variables that were already included in the multivariable models. We observed similar dose–response inverse associations between body weight and levels of physical activity after additional adjustments of sitting time (see online supplementary table S2). Among men, the body weight was 4.4 kg (CI 3.4 to 5.3) lower in those who reported above recommended levels of physical activity, compared with inactive men. Similarly, among women who reported above recommended levels of physical activity, body weight was 6.7 kg (CI 5.7 to 7.7) lower compared with women who were inactive (see online supplementary table S2).
Discussion
In this prospective study of physical activity and body weight over three decades, we found a strong dose-dependent inverse association between activity levels and weight gain in men and women. There was an overall weight gain over time, and participants reporting of physical activity corresponding to or exceeding recommended levels of physical activity had significantly less pronounced weight gain, compared with the inactive reference category. Furthermore, only physical activity exceeding current recommendations of 150 min of moderate-intensity or 60 min of vigorous activity each week was required to prevent significant weight gain, defined as ≥2.3 kg over any 11-year period. Besides, maintaining such high levels (above recommendations) of physical activity for 22 years was associated with 3.5 and 5.6 fewer kg of weight gain compared with staying inactive during this time period in men and women, respectively.
Although extensive research has been carried out to assess the amount of physical activity required for weight loss among already overweight or obese participants, fewer studies have quantified how much physical activity is needed for weight gain prevention.17 Our results are in line with some previous studies11–13 19–23 to show an overall favourable effect of physical activity for weight gain prevention. Lee et al11 followed middle-aged women for in average 13 years, and found physical activity to be associated with less weight gain only among those with BMI lower than 25 and among women younger than 65 years. Furthermore, they compared two lower levels of physical activity, one equivalent to <150 min/week and one 150–420 min of moderate-intensity physical activity, to a reference category of ≥420 min of moderate-intensity activity. They found only the highest category, that is, ≥420 min of moderate-intensity activity, to prevent weight gain.
Our results contrast with the findings of Lee et al11 as we found that moderate amounts of physical activity, equivalent to current recommendations of 150 min of moderate-intensity activity, might be sufficient to reduce overall weight gain in men and women. We found, however, greater effects of physical activity above the recommendations.
Interestingly, we found that only physical activity above the recommended level was required to lessen the OR for meaningful weight gain (ie, ≥2.3 kg) over time, in line with findings of Lee et al.11 In our study, this association was present also for overweight women (BMI 25–29.9 kg/m2) and overweight and obese men (BMI≥25 kg/m2), as opposed to Lee et al11 who found significantly lower weight gain with high levels of physical activity in normal weight women only.
In regard to different age groups, our results are partly different than the results of Lee et al11 as we found significantly lower weight gain with higher levels of physical activity also in participants ≥65 years. Shiroma et al13 studied the association of physical activity and weight gain in men at the mean age of 65 years at baseline, and found that being inactive was associated with meaningful weight gain over time compared with being moderately active for ∼70 min/day. In line with this, we found the OR for meaningful weight gain over 11 years to be significantly reduced in men >60 years who exceeded 150 min of moderate activity or 60 min of vigorous activity. However, women >60 years also had a significantly reduced meaningful weight gain when doing 150 min of moderate-intensity activity/60 min of vigorous activity.
To summarise, our findings in older participants do not fully support other data11 ,13 as we found physical activity in older men and women to be associated in similar inverse dose–response relationship with weight gain as in young participants. Some of the differences between the mentioned studies might be caused by the different physical activity questionnaires used. In our study, we also asked about high-intensity activity, allowing categorisation of physical activity according to the recommendations proposed by Haskell et al6 stating that 150 min of moderate-intensity activity, or 60 min of vigorous activity each week, are needed for health benefits.
In a subgroup analysis of 2673 participants, we found that maintenance of physical activity above the recommended level over 22 years was associated with significantly smaller gains in weight among men and women, whereas complying with recommendations was not.
Using data from the Coronary Artery Risk Development in Young Adults (CARDIA) study, Hankinson et al12 found less weight gain in young adults who maintained an activity level corresponding to 150 min of moderate-intensity activity each week throughout young adulthood. However, our data extend these findings as we included different age groups, BMI categories, smoking status and occupational activity strata. Of note, in our study, the most pronounced difference in weight gain was seen when comparing the participants who maintained an activity level above the current recommendations and the other three groups.
Our findings suggest that women more than men have greater control of weight gain by physical activity, and this is consistent with previous results in showing sex differences for the associations between physical activity and weight gain.20 ,22 ,23 One plausible explanation for the observed sex differences may be more over-reporting of physical activity among men compared with women. In line with this, the relationship between body weight and physical activity is often found to be stronger for women when physical activity is assessed by self-report,24 ,25 whereas the relationship is similar or stronger in men when an objective measure like doubly labelled water is used.26
The adjusted and stratified analyses of daily sitting time and occupational activity suggest that physical activity at leisure time is independently associated with changes in body weight over the years. We observed similar dose-dependent association of weight gain prevention relating to above recommended levels of physical activity after additional adjustments of sitting time and occupational activity. As occupational activity, and especially the effects of sedentary time at work, would potentially affect total energy expenditure greatly, more studies are warranted to further investigate these interactions.27
Although our results showed less pronounced weight gain when exceeding current recommendations, participants in all activity levels gained weight over 22 years. Based on our data, some weight gain throughout adult life seems to be inevitable, but a high level of physical activity reduces the magnitude of weight gain in men and women. Besides, even if physical activity above the current recommendations for physical activity might be needed to prevent unhealthy weight gain, there is a vast body of literature showing that the recommended 150 min of weekly moderate activity lower the risk of chronic diseases and mortality.28–30
The main strengths of our study include a large sample size of men and women with a wide age range of 20–100 years, who were recruited from three total health surveys in one county with a high participation rate. This allowed for the prospective design with a more than 20 years of follow-up period, and with the ability to adjust for changes in physical activity levels over time. Furthermore, directly measuring body weight in a standardised way is regarded another strength as some participants tend to underestimate their weight when self-reported.31 We were able to adjust for many variables potentially confounding the relation between physical activity and weight gain, and also included occupational activity in the analyses.
Limitations include self-reported physical activity and different questionnaires in subsequent HUNT waves. However, physical activity as measured in H1 and H2 shows associations with morbidity and mortality as expected.8 ,9 ,32 ,33 Another limitation was that we did not have detailed information about diet in this population. Although a decline in energy expenditure and overnutrition may explain the increasing prevalence of obesity, it is suggested that the main reason for increased body weight is declined physical activity levels rather than increased energy intake.34 However, dietary habits are hard to analyse in population studies, and food data from large scale epidemiological studies should be interpreted with caution.35
Our data do not include waist circumference in H1. As weight per se does not distinguish between fat and muscle, and muscle tissue has a higher weight density than fat, we argue that the effects of physical activity could be higher if we could assess changes in waist circumference and not merely weight change. Finally, as the participants in the study were primarily Caucasian, reflecting the inhabitants of Nord-Trøndelag County during the study period, the generalisability of the study findings may be limited.
In conclusion, being physically active mitigated weight gain in men and women above 20 years of age in a dose–response manner. Only activity levels exceeding the current recommendations of physical activity for health benefits, that is, ≥150 min of moderate-intensity or ≥60 min of vigorous activity each week, were associated with lower OR of meaningful weight gain over time. Although the recommended level of physical activity for health benefits reduces the risk of chronic diseases, the additional impact of physical activity volume and intensity for obesity prevention warrants further investigations, and should be incorporated into future recommendations.
What are the new findings?
-
Physical activity above the current recommendations for health benefits, that is, ≥150 min of moderate-intensity or ≥60 min of vigorous activity each week, was associated with lower OR of meaningful weight gain over time.
-
Maintaining a level of physical activity above the current recommendations over the adult lifespan was associated with 3.5 and 5.6 fewer kg of weight gain compared with staying inactive in men and women, respectively.
-
Physical activity level and weight gain were inversely associated in a dose-dependent way in all age groups, in men and women.
How might it impact on clinical practice in the near future?
-
Healthcare providers who advise patients about physical activity should be aware of the level of physical activity needed to prevent long-term weight gain. The amount required is greater than the ‘guideline’ amount for health benefits.
-
Although the recommended level of physical activity for health benefits reduces the risk of chronic diseases, greater levels of physical activity are required to prevent weight gain; this should be incorporated into future physical activity recommendations.
-
Policy-makers should therefore know of the requested level of physical activity to prevent weight gain for public health initiatives.
Acknowledgments
The Nord-Trøndelag Health Study (The HUNT Study) is a collaboration between HUNT Research Centre (Faculty of Medicine, Norwegian University of Science and Technology NTNU), Nord-Trøndelag County Council, Central Norway Health Authority, and the Norwegian Institute of Public Health. We are indebted to the participants of the HUNT study.
References
Supplementary materials
Supplementary Data
This web only file has been produced by the BMJ Publishing Group from an electronic file supplied by the author(s) and has not been edited for content.
Files in this Data Supplement:
- Data supplement 1 - Online supplement
Footnotes
-
▸ Additional material is published online only. To view please visit the journal online (http://dx.doi.org/10.1136/bjsports-2014-093416)
-
Contributors TM had full access to all of the data in the study and takes responsibility for the integrity of the data and the accuracy of the data analysis. TM, UW and JN were involved in the study concept and design and drafting of the manuscript. TM, UW, SL and JN were involved in analysis and interpretation of the data and critical revision of the manuscript for important intellectual content. TM and JN were involved in acquisition of data. TM, SL and JN were involved in statistical analysis. TM and JN were involved in study supervision. UW obtained funding.
-
Funding The present study was supported by grants for K.G.Jebsen Foundation, and by the Norwegian Fund for Postgraduate Training in Physiotherapy.
-
Competing interests None.
-
Ethics approval The study was approved by the Regional Committee for Medical and Health Research Ethics (REK 2012/2196).
-
Provenance and peer review Not commissioned; externally peer reviewed.