Article Text

Abstract
Background The hamstring injury mechanism was assessed by investigating the exercise-related metabolic activity characteristics of the hamstring muscles using a muscle functional MRI (mfMRI) protocol.
Methods 27 healthy male football players and 27 football players with a history of hamstring injuries (recovered and playing fully) underwent standardised mfMR Imaging. The mfMRI protocol consisted of a resting scan, a strenuous bilateral eccentric hamstring exercise and a postexercise scan. The exercise-related T2 increase or the signal intensity shift between both scans was used to detect differences in metabolic activation characteristics (1) between the different hamstring muscle bellies and (2) between the injury group and the control group.
Results A more symmetrical muscle recruitment pattern corresponding to a less economic hamstring muscle activation was demonstrated in the formerly injured group (p<0.05). The injured group also demonstrated a significantly lower strength endurance capacity during the eccentric hamstring exercise.
Conclusions These findings suggest that the vulnerability of the hamstring muscles to football-related injury is related to the complexity and close coherence in the synergistic muscle recruitment of the biceps femoris and the semitendinosus. Discrete differences in neuromuscular coordination and activity distribution, with the biceps femoris partly having to compensate for the lack of endurance capacity of the semitendinosus, probably increase the hamstring injury risk.
- Hamstring
- Injury
- Football
- Eccentric
- MRI
This is an Open Access article distributed in accordance with the Creative Commons Attribution Non Commercial (CC BY-NC 4.0) license, which permits others to distribute, remix, adapt, build upon this work non-commercially, and license their derivative works on different terms, provided the original work is properly cited and the use is non-commercial. See: http://creativecommons.org/licenses/by-nc/4.0/
Statistics from Altmetric.com
Introduction
Hamstring injuries are the most common muscle injuries in male football players, and are associated with significant time loss.1 Given the significant re-injury rates and the high costs involved, adequate prevention and rehabilitation strategies, as well as valid return to play criteria, are of major importance.2–7
The predominant hamstring injury mechanism in football occurs during high-speed running or acceleration efforts.8 ,9 The muscle–tendon junction of the long head of the biceps femoris (BF) is most commonly injured.10 ,11 Despite the growing insights into the injury mechanism and risk factors of hamstring strain injuries, a full understanding of the underlying epidemiology is lacking, which is confirmed by the high injury incidence and recurrence rates.12–14
Biomechanical and kinematic studies have demonstrated that the BF is subject to the highest levels of muscle–tendon unit stretch throughout the crucial terminal swing phase in (high speed) running.9 ,15–17 This could possibly explain why this muscle belly is injured the most. In addition to stretch, other differences in functional muscle features between the biarticular hamstring bellies might be involved as well.
Both the semitendinosus (ST) and the BF engage in maximal eccentric activation throughout the swing phase of running (middle swing to initial stance phase). These synergists work alternatingly in complex neuromuscular coordination patterns,15 ,18 ,19 where the BF is predominantly activated during the middle (to late) swing phase and the ST is the leading player in the terminal swing phase.20 This stresses the importance of sufficient neuromuscular and intramuscular coordination between those two muscle bellies. Altered muscle activation patterns have been associated with prior hamstring injuries and an increased risk of re-injury.4 ,21
Intramuscular synergistic recruitment patterns and the quality and quantity of co-operation between the BF, ST and semimembranosus (SM) have not been investigated. Electromyography (EMG) assessment has been used as a gold standard in the evaluation of muscle recruitment and activation patterns. Owing to its poor spatial accuracy and the presence of crosstalk in the observed muscle signals, this method is not suited for the evaluation of muscle recruitment patterns within the hamstring muscle complex. Functional MRI (fMRI) can map the intramuscular and intermuscular recruitment patterns with a very high spatial accuracy22–25; however, unlike EMG, it cannot provide any real-time information about the amount and timing of the underlying muscle activity. Nonetheless, fMRI has the ability to detect and evaluate the magnitude of metabolic activity in muscle tissue. Since this technique is non-invasive and has high sensitivity and specificity, it has been used to detect exercise-related muscle activation patterns in various muscle groups (cervical flexor muscles, back extensor muscles, quadriceps, hamstrings and adductor muscles)26–29 and pathology-related compensatory muscle recruitment patterns (patellofemoral pain syndrome, chronic low back pain).30 ,31
Studies using fMRI have also evaluated muscle activity in hamstring muscle bellies during various exercises to identify the most effective exercise for injury prevention.18 ,32 However, this technique has not been used to assess the intramuscular activity proportions (and underlying neuromuscular coordination patterns) in an athletic population at risk.
This study aimed to assess how the different hamstring muscle bellies work together in synergistic coordination patterns and whether changes in neuromuscular coordination patterns are associated with hamstring injuries.
Materials and methods
Participants
The club trainer, coach, physiotherapist or sports physician was contacted and interested players were recruited from March to May 2013. Initially, 75 male football players from seven clubs in Oost-Vlaanderen, Belgium (recreational football competition) agreed to participate. Potential participants were excluded from this study if they had:
-
A history of severe knee or hip injury;
-
A history of lower back complaints/lower back complaints at present;
-
Electronic implants, foreign (ferromagnetic) bodies close to the thigh region or players suffering from claustrophobia, which made them unsuitable for MRI evaluation;
-
Less than 5 years of competitive football experience.
Players aged between 18 and 35 years were included in the study to rule out age-related pathologies. All participants were completely free from injury and ready to play at the moment of testing.
Ultimately, fifty-four players participated in this study: 27 football players without a history of hamstring injuries and 27 football players with a recent (within the last 2 seasons) history of at least one hamstring injury (one reported injury episode). A hamstring injury was defined as a football-related injury in the hamstring muscle region, preventing the player from participating in training or competition for at least 1 week. The majority of injuries within the injury group were diagnosed clinically, with or without medical imaging. The recruitment and inclusion of injured participants was based on self-report, as we were not able to contact all physicians and physiotherapists involved in the original diagnosis and rehabilitation. At the time of testing, none of the players experienced any pain or discomfort in the hamstring region during football participation or during the muscle fMRI (mfMRI) protocol in this study.
Testing procedure
Participants were instructed not to engage in intensive training or football competition 48 h prior to testing to ensure a valid measure of the exercise-related ‘T2 increase’ or ‘signal intensity shift’. The testing protocol consisted of two scanning sequences with a strenuous hamstring exercise between both scans. The difference in the transverse relaxation time of the separate hamstring muscle bellies before and after exercise (T2 increase or signal intensity shift) indicated the magnitude of underlying metabolic muscle activity.22
After completing the MRI safety checklist and signing the informed consent, the participants were familiarised with the scanning sequence and the hamstring exercise. The entire testing procedure was performed by the same researcher (JS), which minimised the risk of intertester bias. This study was approved by the Ethics Committee of the Ghent University Hospital (number of approval: EC/2013/118).
Muscle fMRI
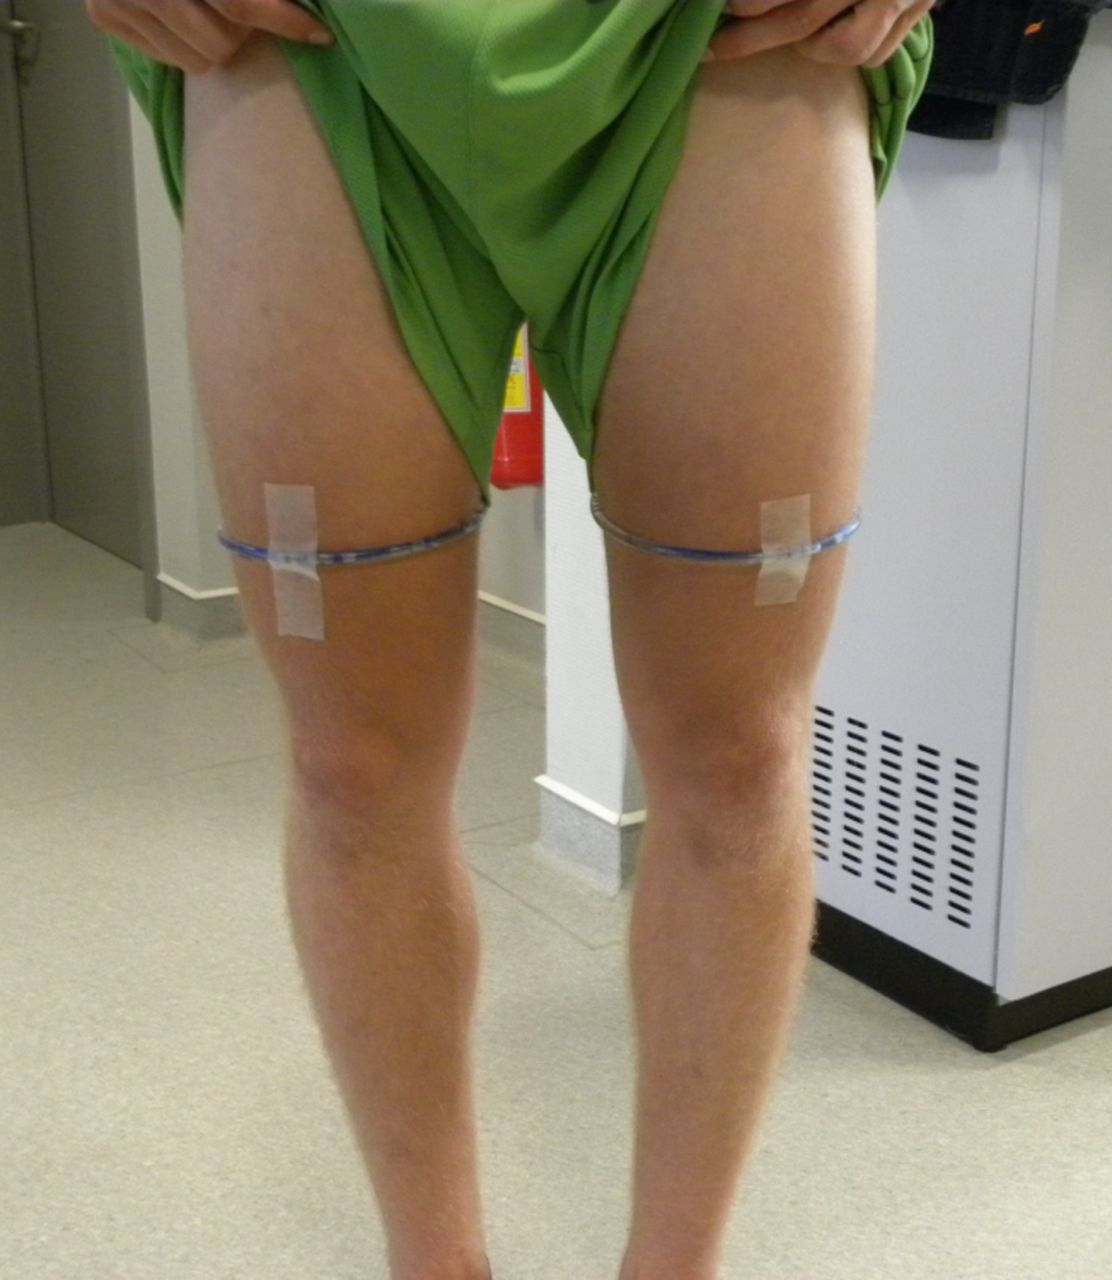
A 3 T scanner (Siemens Trio Tim, Erlangen, Germany) was used for the mfMRI protocol. The participants were positioned supine on the scanning table, which was supplied with a spine coil, with both legs extended and their feet close to the magnet. A flexible body matrix was placed on the anterior thigh area and carefully aligned with the centre of the field of view. Plastic tubes filled with sodium chloride solution was used for accurate localisation and determination of the centre of the field of view (the intended slice position) (figure 1). The centre of the body matrix was aligned with the thigh level on which the plastic tubes were fixed. Coloured tape was used to indicate this centre of image acquisition, relative to the scanning table, so that the participant's position before and after exercise was exactly the same, and the second sagittal localising sequence after exercise was not needed.

Position of the middle slice (centre of the field of view) for the T1 and both CPMG (Carr Purcell Meiboom Gill) scanning sequences.
Each participant underwent the following scanning sequences: one localising sequence, one Spin Echo T1 sequence, one CPMG (Carr Purcell Meiboom Gill) sequence before exercise and the same CPMG sequence after exercise. The CPMG scanning sequence is the main functional scanning sequence that allowed the calculation of a T2 map after scanning. This T2 map gives an indication of the metabolic status of the muscle tissue, depending on the signal intensity or the magnitude of the T2 relaxation parameter (T2 time constant of muscle water). The localising sequence was performed only once to minimise the time span between the end of the exercise session and the second CMPG acquisition. As the T2 shift half-life is only 7 min,22 ,33 running a second localiser after exercise may have resulted in an underestimation of the exercise-induced metabolic changes within the hamstring muscles.
A Spin Echo T1 (SET1) sequence was added to the functional scanning protocol for more accurate region of interest (ROI) identification and selection in the post hoc analysis. The contrast of a T1 scan is substantially higher than the contrast within a T2 image, so the T1 image made it possible to discriminate the different hamstring muscle bellies from one another in the T2 map more accurately (table 1).
Spin echo T1 and CPMG T2 slice positioning and image acquisition parameters
The middle slice (or the centre between both middle slices for the SET1 sequence) was located on the upper border of the distal third of the thigh, which was marked using the fluid filled tubes (figure 1). This field of view centre was chosen because this specific upper thigh region consists of the highest muscle tissue/connective and tendon tissue ratio. Imaging parameters were identical for both the CPMG sequence before and after exercise.
Hamstring exercise
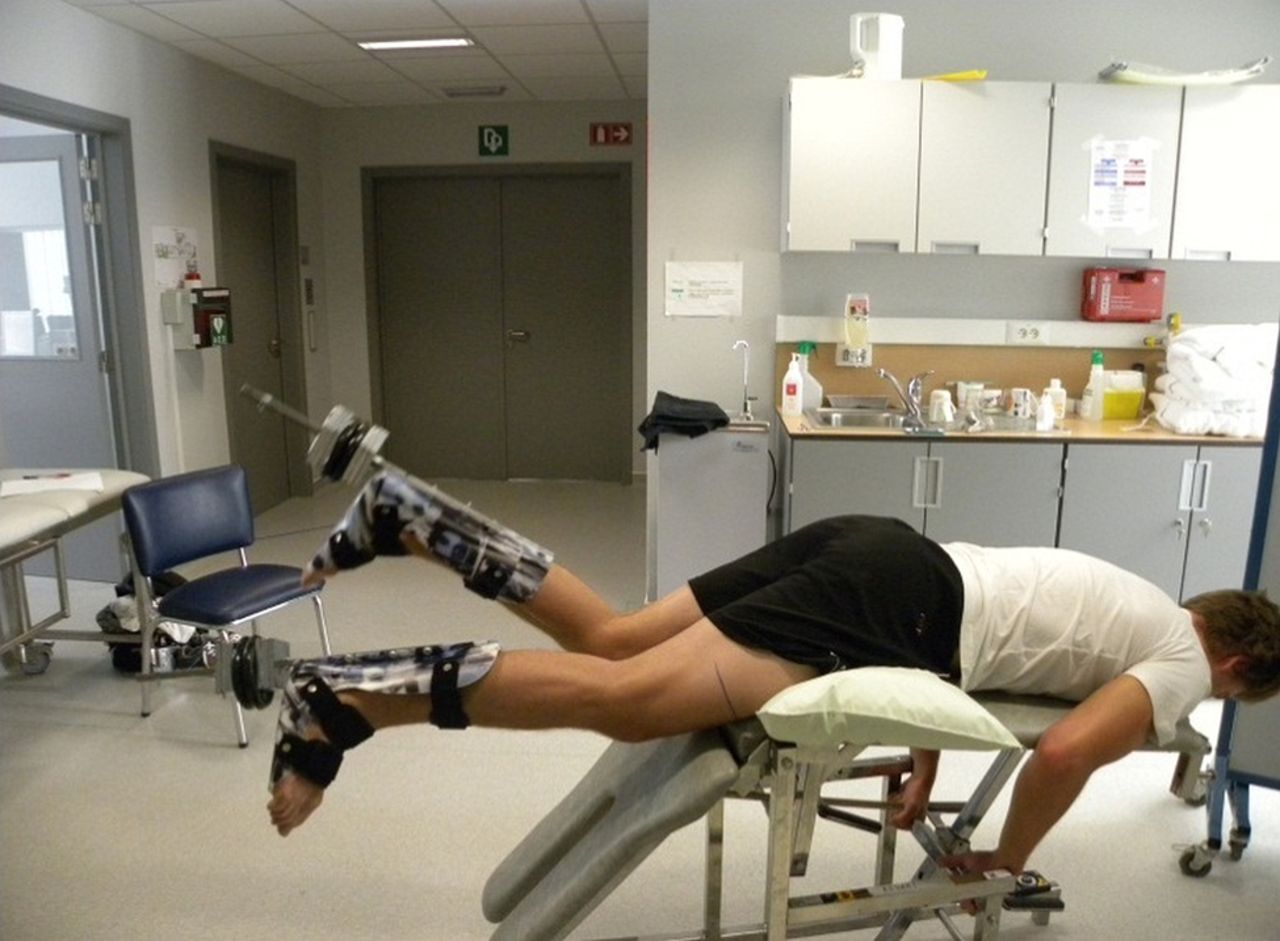
Participants performed a prone leg curl exercise between both functional CPMG sequences. They were positioned prone on a 60° incline exercise table with a degree of hip flexion and were instructed to flex and extend both knees alternately from 90° of knee flexion to full extension with a weight of 5 kg attached to each foot. Participants were instructed to flex and extend both knees at a constant 90 Hz pace, monitored by a metronome. This exercise was chosen to mimic the hamstring mechanics in running (hip flexion and knee extension that had to be controlled and decelerated against gravity) while also providing a fairly high muscle loading to induce a sufficient metabolic activation response (there is a linear relationship between exercise intensity and magnitude of T2 increase). Participants completed the exercise to exhaustion (corresponding to a score of 20 on the Borg Ratings Scale of Perceived Exertion) because this guaranteed a sufficient metabolic muscle response and because fatigue has already repeatedly been identified as an important actor within the hamstring injury risk.2 ,4 ,34 ,35 Hip and knee joint deviations in the frontal (abduction—adduction) and transverse (internal—external rotation) planes were prohibited because this would influence the muscle activation patterns (figure 2).

Prone leg curling exercise in between both CPMG (Carr Purcell Meiboom Gill) scanning sequences of the testing procedure.
When the participants indicated exhaustion and the exercise could no longer be performed with quality, they were submitted to the second CPMG sequence within 1 min. The time to exhaustion and the number of repetitions were recorded.
Data analysis
Acquired images were converted into T2 maps for calculation of the mean transverse relaxation times in the different ROIs using the T2Processor software (copyright P. Vandemaele, Engineer, GIFMI UZ Gent). The T2 value was calculated via the formula: Sn=S0×exp (−TE/T2), where Sn represents the signal intensity, expressed in milliseconds, at a given TE within the scanner's original signal intensity S0.
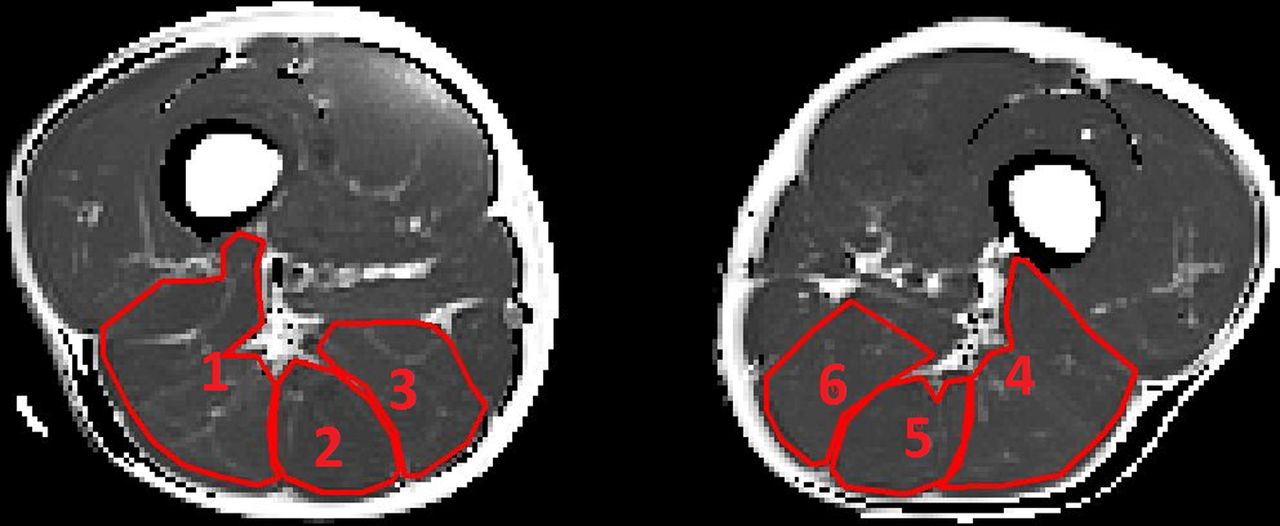
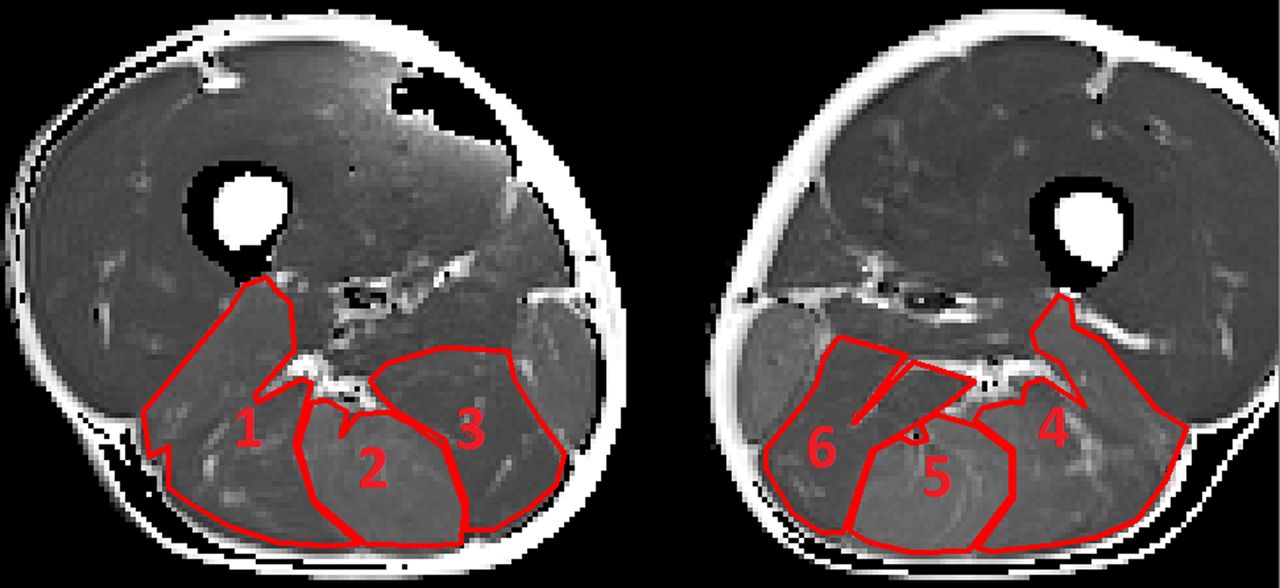
For the functional CPMG sequence, five slices were taken at the upper border of the distal third of the thigh in both legs before and after exercise (with an interslice distance of 2 mm). In each of the 10 acquired images (10 slices), 6 ROIs were selected for relaxation time (T2) analysis, representing the BF, ST and SM in both the right and the left leg. Muscle bellies were systematically selected as ROI, with strict inclusion of muscle fibre tissue and exclusion of fatty tissue, neurovascular structures and connective tissue (figures 3 and 4).

Region of interest selection in the T2-weighted (T2 map) image before exercise. (1) R BF, (2) R ST, (3) R SM, (4) L BF, (5) L ST and (6) L SM (BF, biceps femoris; L, left; R, right; SM, semimembranosus; ST, semitendinosus).

Region of interest selection in the T2-weighted image (T2 map) after exercise. (1) R BF, (2) R ST, (3) R SM, (4) L BF, (5) L ST and (6) L SM (BF, biceps femoris; L, left; R, right; SM, semimembranosus; ST, semitendinosus).
The slices were taken at the proximal limit of the distal third of the upper leg, which included the entire BF as well as a sufficient diameter of the ST and SM muscle bellies (figure 1).
After selecting the ROIs and adjusting the threshold in the T2 map to ensure that only muscle tissue was included, the T2 relaxation time was calculated for each ROI in every slice, using the T2Processor software. The final T2 relaxation time of each muscle before and after exercise was the mean T2 value, retained out of the five slices. Intratester reliability was assessed using the contralateral leg transverse relaxation times of each one of the hamstring muscle bellies before and after exercise in the control group.
Statistical analysis
To compare the formerly injured leg of the injury group with a healthy leg of the control group without having to deal with the factor ‘leg dominance’ as a confounder, we recorded the ratio dominant/non-dominant leg involvement in the injury group and applied this ratio in the control group so that the same subdivision could be made randomly. In this way, an equal dominance/non-dominance ratio was achieved in both groups. In the injury group, 17 (63%) players sustained their latest hamstring strain injury in their dominant leg. In the control group, the same number of dominant legs (and non-dominant legs) was included for analysis.
We evaluated the normality of the data distribution for the different variables using the Shapiro-Wilk test. To check for confounders, we evaluated the similarity of anthropometric features as well as the level of competition and playing position in both groups, using multivariate analysis of variance (MANOVA) and χ2 hypothesis testing.
Mixed model analysis was performed to check for significant differences in baseline transverse relaxation time and the activity-related T2 increase between (1) the different hamstring muscle bellies and (2) both groups, taking into account the between-participant variability (random variable ‘playerID’). MANOVA and independent Student t tests were used to evaluate possible between-group differences for the separate hamstring muscle bellies.
We also used an independent samples Student t test to check for differences in the hamstring muscle load bearing capacity by comparing the duration of the prone knee bending exercise between the injury group and the control group (‘time to exertion’). Finally, associations between the mfMRI measures were evaluated with the Pearson and Spearman correlation coefficients.
Data analysis was done with the SPSS V.21 Statistical Software package (IBM Corp., New York, USA), and the level of significance was set at α=0.05.
Results
Anthropometrics and injury characteristics
There were no differences in anthropometrics between both groups (table 2). The injury group sustained their last hamstring injury between 21 months and 1 month before testing (mean (SD) 6 (4) months). The duration of the rehabilitation period following their latest hamstring injury varied from 7 to 84 days, with a mean time loss of 28±22 days, indicating that players with both grade 1 and grade 2 muscle strain injuries were included. All players were treated conservatively by a sports physiotherapist.
Participant information
Exercise-related T2 increase
The intraclass correlation coefficient (ICC) for the baseline measurements were 0.925, 0.724 and 0.737 for the BF, the ST and the SM, respectively. The ICC for the postexercise measurements were 0.892, 0.801 and 0.856 for the BF, the ST and the SM, respectively.
The overall exercise-related metabolic response was significantly higher in the injury group. There was a significant difference in the amount of metabolic activity in the entire hamstring muscle of 4.8% (p<0.027), with a mean T2 increase of 18.20±10.03% in the control group and a mean T2 increase of 22.87±9.29% in the injury group (table 3).
The average T2 relaxation times of the individual muscle bellies gathered before (T2 pre) and after (T2 post) exercise, the relative T2 increase (%) of the individual muscle bellies (relative to the resting state T2 relaxation time and corresponding metabolic status) and their combined average
Aside from the between-group difference in the mean T2 increase of the entire hamstring muscle, the individual hamstring muscle bellies of the formerly injured players presented a higher metabolic response after exercise (figure 5).
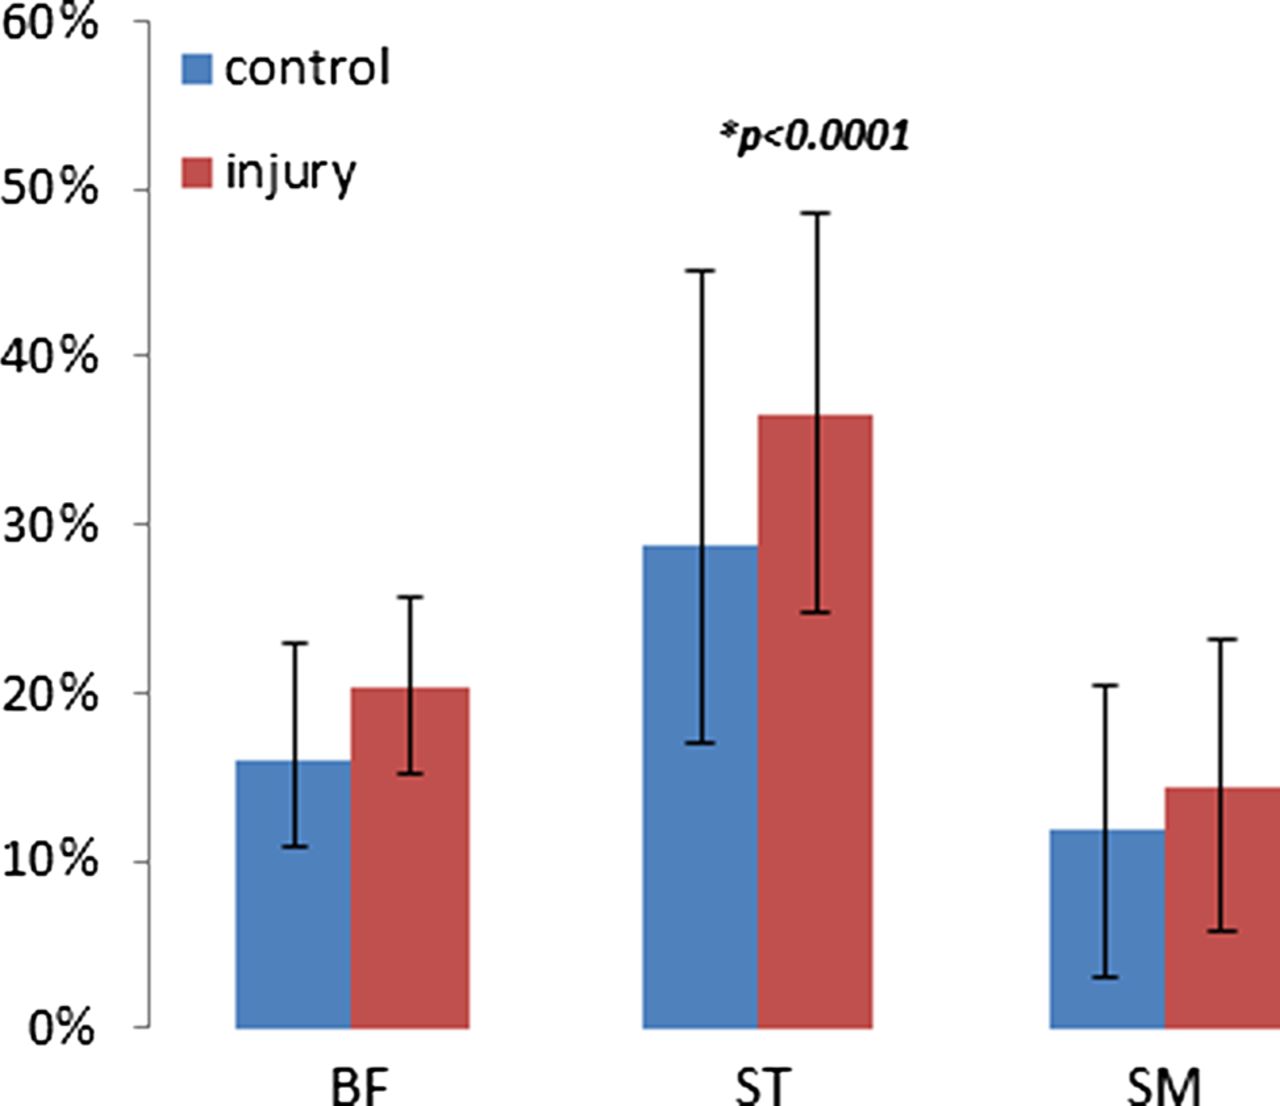
Exercise-related increase in transverse relaxation time of muscle water representing the magnitude of the metabolic muscle activity in the separate muscle bellies (BF, biceps femoris; ST, semitendinosus; SM, semimembranosus).
There were significant differences in the magnitude of metabolic activity between the three hamstring muscle bellies within the injury and control groups, with the ST presenting significantly higher levels of metabolic activity compared to its medial and lateral counterparts (p<0.0001). This within-group activity divergence between the separate muscle bellies appeared to be similar in both groups (Figure 5).
The synergistic role of the different muscle bellies and their individual contribution to the exercise-related T2 increase were assessed by the ratio of the individual activity of the BF, the ST and the SM, respectively, to the summated T2 increase of the entire hamstring portion (share individual muscle=(amount of individual T2 increase)/(summated T2 increase of the entire hamstring muscle)). In this way, a percentage was attributed to the T2 increase in each muscle belly, relative to the total hamstring activity (equalised with 1 or 100%). There were differences in the individual activity shares between the homonymous hamstring muscle bellies in both groups. The ST demonstrated a 14.4% higher metabolic activation than the BF (p<0.001) and a 19.7% higher activation than the SM (p<0.001). The BF, in its turn, demonstrated 5.2% more metabolic changes than the SM (p=0.015). This supports the finding that the ST has an important share in the metabolic provision (figure 6). We also found that the discrepancy between these relative percentages were significantly smaller in the injury group, with the BF and the SM presenting slightly more metabolic changes, and the ST presenting slightly less metabolic changes within the total T2 increase after exercise. The magnitude of intramuscular activity imbalance was evaluated by looking at the total difference in metabolic muscle activity between the separate hamstring muscle bellies (the magnitude of intramuscular activity variability), which was significantly lower in the injury group (mean difference=3.47%; p=0.039). In this group, the percentage of intramuscular activity variability was 10.23±3.2%. The control group displayed more intramuscular differences in metabolic activity between the BF, the ST and the SM, with a mean magnitude of intramuscular activity variability of 14±7.5%.

The individual share/portion of each individual muscle belly within the summated T2 increase (metabolic muscle response) for the hamstring muscles in the control group (light bars) and the injury group (dark bars) (BF, biceps femoris; SM, semimembranosus; ST, semitendinosus).
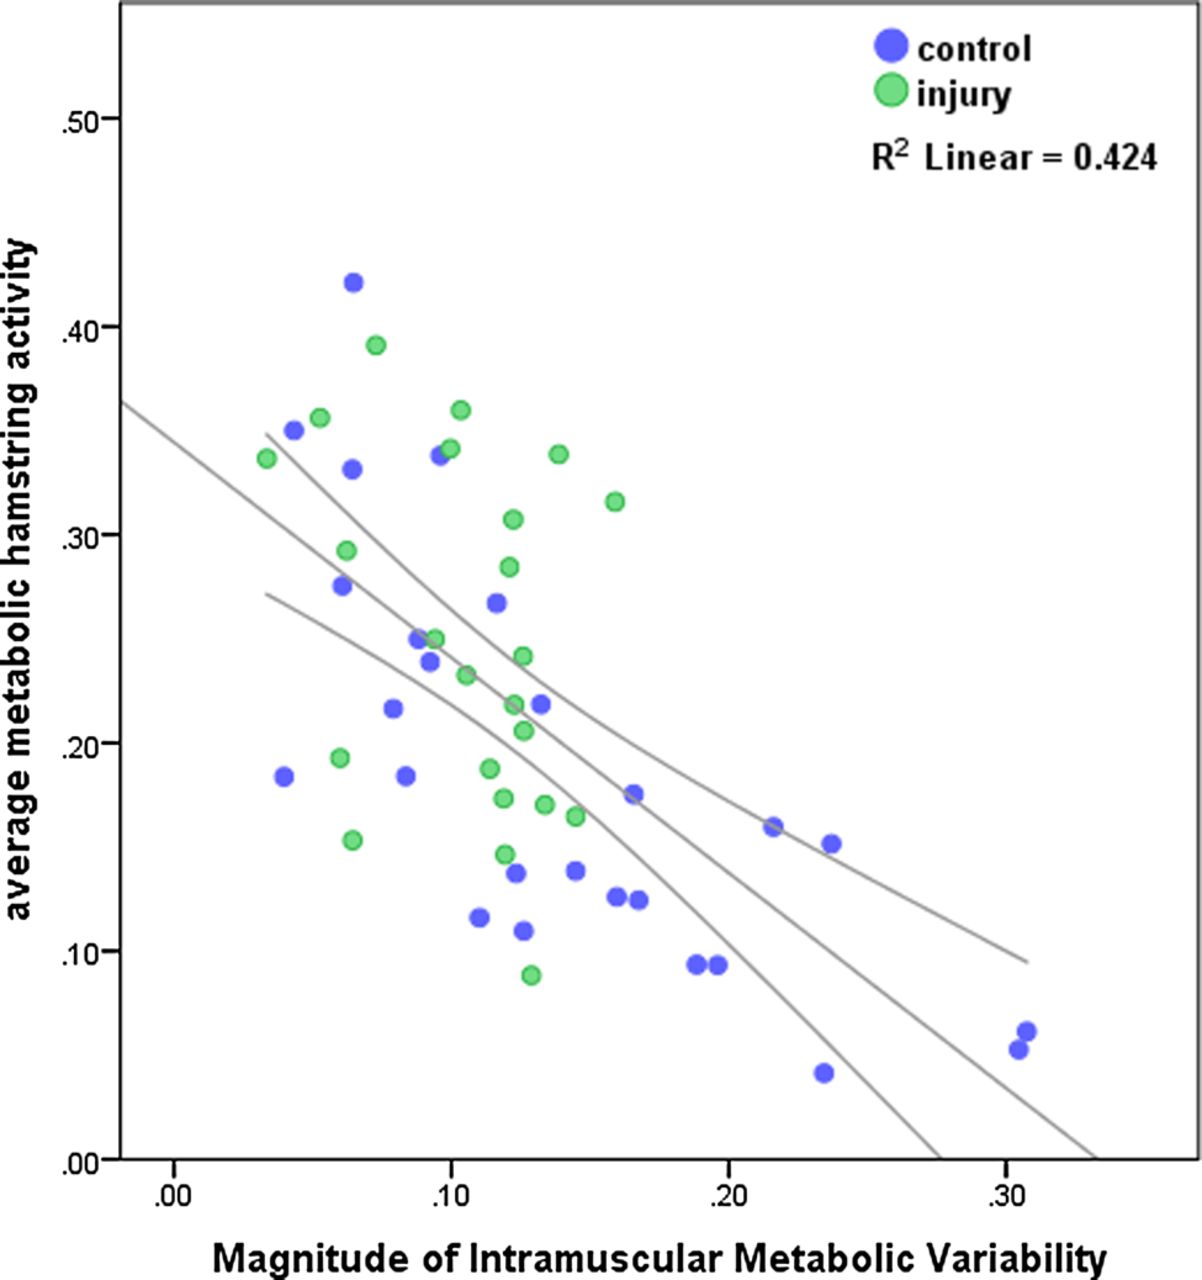
Furthermore, this magnitude of intramuscular activity variability was strongly negatively correlated with the average exercise-related T2 increase (Pearson correlation coefficient=–0.651; p<0.001; figure 7).

Scatter-dot diagram of the negative linear relation between the magnitude of the metabolic muscle response due to exercise and the magnitude of the intramuscular activity variability: the higher the variability, the lower the T2 increase and vice versa.
Since the magnitude of the exercise-related metabolic muscle response or T2 increase is highly dependent on the baseline T2 value (resting state metabolic status), possible differences in baseline T2 between the injury group and the control group would have biased our results.24 ,36 ,37 Multivariate analysis (general linear model) compared the resting state T2 values for the different muscle bellies between both groups, and revealed no influence of the factor ‘injury’ on the resting state T2 values: p values of 0.881, 0.728, 0.581 and 0.968 for the BF, the ST, the SM and the entire hamstring muscle portion, respectively (cf. table 3).
Time to exertion
The mean time to exertion in the injury group was significantly lower compared to the control group: 219 s (04′07″)±151 s and 292 s (05′26″)±109 s, respectively, with a mean difference of 72.9 s (01′13″), p=0.045.
Time elapsed since the last injury and injury severity
The time elapsed since the last hamstring injury and the duration of the corresponding rehabilitation period (time loss period) were not associated with the magnitude of the exercise-related metabolic muscle response or with the magnitude of intramuscular activity variability (table 4).
Spearman correlations between the injury-mfMRI time interval and the rehabilitation duration of the last hamstring injury and the mfMRI outcome measures
Discussion
This study demonstrated significantly more symmetrical activation patterns between the BF, ST and SM in the injury group compared to the control group. The prominent role of the ST was evident in both groups. However, in the injury group, the activity of the ST was partly traded in for more involvement of its synergists.
The ST seems to be activated most during the prone leg curling exercise. Previous research reported that the ST had the highest muscle activity and was recruited more than both the BF and the SM in strength exercises and in locomotion.15 ,38–42 This activation pattern appears to be the result of a sophisticated, complex neuromuscular coordination within the hamstring muscle complex, which possibly provides the most efficient muscle functioning and most economic force production. Previous research demonstrated that the ST has the highest levels of muscle activity during the terminal swing phase (whereas the BF is predominantly active from the middle to late swing phase),15 where the hamstring muscle group has to withstand the highest levels of muscle tendon stretch and negative work. This supports our hypothesis and suggests that under high loading conditions, the ST has a prominent role in producing and controlling the torques around both hip and knee joints.
We also found a high correlation between the magnitude of intramuscular activity variability and the mean exercise-related T2 increase, with higher exercise-related signal intensity shifts in the presence of a more balanced muscle recruitment pattern. This finding suggests that the more symmetrical and less dissociated the hamstring muscles work together, the higher the physiological changes will be inside the recruited muscle fibres. More intramuscular variability can thus be associated with a lower metabolic turnover and more economic muscle functioning.
More symmetrical muscle activation (lower level of intramuscular dissociation) might imply compensatory and (mal)adaptive neuromuscular coordination patterns, causing the hamstring muscle bellies to contract less efficiently, with earlier onset of pH changes and muscle fatigue. These aberrant muscle recruitment patterns may contribute to an elevated risk of hamstring injury under high loading circumstances, as seen in track and field sports.
Interestingly, the BF and the ST are most frequently injured in running-related hamstring strains. The complex inter-relationship, synergistic activation and fibre recruitment patterns between the BF and the ST (which share a proximal tendon) indicate that both muscle bellies are highly interdependent in terms of the magnitude of tissue loading and the adequacy of muscle functioning. 18–20 ,41 ,42 When one muscle displays an aberrant recruitment pattern (both in timing as in spatial distribution of fibre recruitment), excessive load would be placed on its neighbour which would also induce excessive tensile shear stresses close to the proximal myotendinous aponeurosis of both muscle bellies.
Bourne et al43 published a cross-sectional study in which they observed the mfMRI activation patterns of the different hamstring muscles during a specific sprinting task. They evaluated the differences in recruitment patterns between the formerly injured and the healthy hamstrings in five track or field athletes after a sprinting task. Contrary to our findings, they reported a decrease in T2 shift and hence lower levels of underlying metabolic activity in the formerly injured hamstring muscle belly, compared to the homonymous hamstring muscle in the contralateral leg. Given that the T2 increase represents the magnitude of the underlying metabolic changes in the recruited muscle fibres, a higher T2 increase and a lower exercise capacity (duration to exhaustion) in our findings would demonstrate a less effective and less economic recruitment pattern in the hamstring muscle, which has a lower strength endurance and loading capacity. The exercise-related T2 increase or signal intensity shift indicates physiological changes within the muscle fibre, which are caused by osmotic changes in intracellular fluid volumes and pH, in turn triggered by the accumulation of metabolites. Therefore, this outcome measure gives an indication of the efficiency of muscle recruitment and the muscle fibre endurance capacity. Why the above mentioned study demonstrated opposite results, might be explained by the differences in study population and sample size, as well as the possibly longer time span between the sprinting task and the second functional scanning sequence.
The similarity in baseline T2 values in our study sample, demonstrates no between-group difference in metabolic fibre characteristics. Since the exercise-related signal intensity shift did differ between the injury group and the control group, it is likely that the formerly injured hamstrings have a lower loading capacity and display less efficient recruitment patterns, as the injured group also scored significantly lower in terms of strength endurance (lower time to exertion). These compensatory recruitment patterns could possibly make the homonymous muscle more prone to future injury. Indeed, biomechanical and isokinetic testing after clinically and functionally recovered and rehabilitated hamstring strain injuries have shown that eccentric strength deficits as well as altered running kinematics, with a decreased stride length, smaller knee extension and hip flexion angles, are present at time to return to play.44
Our study outcome supports the finding that predominantly the BF and secondly the ST are prone to injury in high-speed running (heavy eccentric loading). When the ST cannot keep up with its former predominant role in force production and negative work delivery (due to injury) under high eccentric loading circumstances, the BF will compensate for this functional deficit. Owing to the smaller fascicular length of the BF muscle, compared to the ST,45 it is less stretch tolerant and less suited to contribute to energy storage through negative work and to control the hip and knee torques in its distal range of motion in this crucial terminal phase of running. As a consequence, even minor deficits in ST functioning or coordination within the synergistic interplay of the BF and the ST would cause one or both muscles to fail.
In line with our findings, we suggest that injury to the BF and/or the ST most probably occurs because the BF is not optimally suited for force production in the distal range of motion and the ST probably is more prone to premature acidification and the onset of fatigue.
There were some limitations to this study. We chose the prone leg curling exercise with free weights in order to simulate the hamstring loading characteristics in running and to provide an adequate exercise intensity. We are aware that hamstring loading in the prone leg curling exercise is very different from hamstring loading in high-speed running, so the muscle recruitment patterns could differ substantially. Owing to the exercise intensity-dependency and the short half-life of the activity-related signal intensity increase, we chose not to include a sprinting protocol in our study. As we found substantial differences between the injury group and the control group, we believe that these differences are attributable to prior hamstring injuries, even though the exercise could not mimic the biomechanics and kinematics of sprinting. Exercise related T2 increase has a very high spatial specificity, and may have been different had we decided to make axial slides at another level or at multiple levels of the thigh. The influence of the location of the hamstring injury (involvement of the BF or the ST as well as the proximodistal location of the lesion within the tendon–muscle–tendon continuum) was not known. Since we did not have medical imaging of the hamstring injury of all participants in the injury group, and since an extra subdivision within the injury group, based on injury location, would consequentially lower the power of this study, we chose to keep the injury group together. Finally, although there was no association between the (1) time elapsed since the last injury and the injury severity (duration of the last rehabilitation period) and (2) the intramuscular activity variability or the magnitude of the exercise-related metabolic muscle response, this might have been due to the small sample size. Therefore, no conclusions or assumptions should be made about mfMRI in establishing injury severity and readiness for return to play.
Conclusion
This study evaluated the magnitude and the distribution of the metabolic changes within the hamstring muscles after a strenuous eccentric hamstring exercise. A more symmetrical muscle recruitment pattern in the formerly injured group of male football players was found, corresponding to higher levels of metabolic activation within the entire hamstring muscle. The injury group had a lower exercise capacity, suggesting that hamstring injuries in football are associated with compensatory neuromuscular activation and recruitment patterns in heavy eccentric loading, causing the hamstring muscle to acidify and fatigue prematurely and to a greater extent. This may explain the high re-injury rate in male football competition. Since the control group presented a higher magnitude of dissociation and variability in hamstring muscle recruitment, we suggest that the exact quality and quantity of hamstring muscle recruitment and the underlying neuromuscular coordination mechanisms are critical in the hamstring injury mechanism and injury risk. mfMRI has proven to be a valid and reliable technique to monitor this complex synergist interplay.
Clinicians should account for complex neuromuscular mechanisms within the hamstring muscle unit, especially for the BF and the ST. Instead of focusing on the BF, which gets injured most frequently, attention must be paid to training and strengthening both the BF and the ST. The function of the ST is critical in injury prevention and performance progression and deserves the same (if not more) attention as the function of the BF.
What is already known on this topic?
-
Running-related hamstring strain injury location can partly be explained by the high levels of muscle-tendon unit stretch and elongation seen in the long head of the biceps femoris.
-
Muscle functional MRI is being used to assess (compensatory) muscular recruitment patterns within and between adjacent muscles in association with pathology or after specific exercises.
-
In running and analytical exercises, the biceps femoris, semitendinosus and semimembranosus work together as synergists in complex neuromuscular recruitment patterns. The exact quality of this recruitment in terms of timing and magnitude has not been identified to date.
What this study adds
-
Football players with a history of hamstring injury present increased, more symmetrical metabolic activity levels within their hamstrings and a lower hamstring muscle loading tolerance, possibly indicating inadequate rehabilitation and an increased risk of re-injury.
-
The biceps femoris and semitendinosus engage in complex synergistic activation patterns during heavy eccentric loading, in which the semitendinosus has a predominant function and elicits the highest metabolic muscle activity. Compensatory and less dissociative hamstring muscle activation patterns might be related to the risk of hamstring injuries in football players.
Acknowledgments
The authors gratefully acknowledge the assistance of P Vandemaele, Engineer of the Ghent University Hospital (GIFMI-UZ Gent), for his assistance in the MR scanning and data processing series. Furthermore, they would like to thank their colleagues at the Department for Rehabilitation Sciences and Physiotherapy for their kind support, as well as the participants of this study, without whom this paper could not have been accomplished. For their financial support, the authors’ gratitude goes out to the Agency for Innovation by Science and Technology in Flanders (IWT—Brussels, Belgium), who made this MRI—research possible.
References
Footnotes
-
Contributors EW customised the study design, guided the statistical analysis and the writing process. DVT provided valuable assistance during the testing procedures and gave constructive feedback during the data analysis. LD was involved in the preparation of the scanning sequences and data analysis. JS was in charge of the participant recruitment, testing procedure and data analysis, and wrote this manuscript.
-
Competing interests None.
-
Patient consent Obtained.
-
Ethics approval The University Hospital of Ghent.
-
Provenance and peer review Not commissioned; externally peer reviewed.