Article Text

Abstract
Introduction Hyperglycaemia accelerates collagen cross-linking in tendons, which may manifest as an increased thickness or as an altered response to load (Reddy 2003). Type 1 diabetes mellitus (T1DM) is a unique population exhibiting hyperglycaemia independent of obesity and low physical activity. Ultrasound tissue characterisation (UTC) quantifies the structural integrity of a tendon based on the alignment of collagen, represented as echo-types (I-IV) (van Schie et al. 2010). Recent work using UTC has shown a transient response in tendon structure at day 2 post maximal competitive load, which returns to baseline by day 4 (Docking et al. 2012; Rosengarten et al. 2014). The aim of this study was to measure Achilles tendon response to a 10km run among individuals with T1DM and controls.
Methods This case-control study was performed in the setting of a social running club for people with T1DM. Participants had their Achilles tendon scanned using UTC before a 10km run (Day 0), and at Day-2 and -4 post run. Anterior-posterior (AP) diameter 2 cm proximal to the calcaneal disappearance was also determined. Participant demographics were recorded and participants completed the VISA-A questionnaire. HbA1c and blood glucose were also measured. All analysis of UTC scans was performed in a blinded fashion. As UTC data was not normally distributed, non-parametric statistical analyses were performed. A Mann-Whitney U test was used for between group Day 0 comparison of echo-types and AP thickness, and a related-sample Friedman’s test was used for within group comparison of echo-types across days.
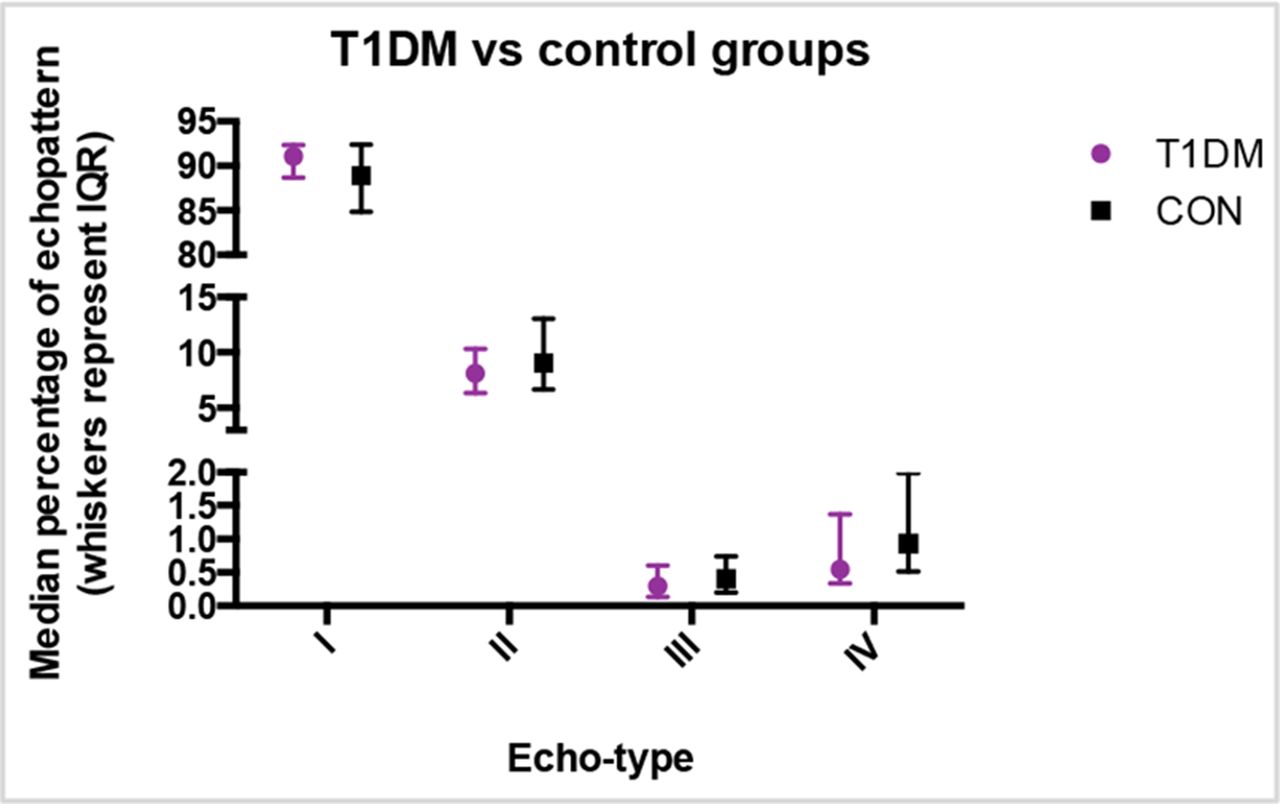
Results Seven T1DM participants (5 men, 2 women; mean ± SD age 38 ± 7 years) and ten controls (4 men, 6 women; age 33 ± 7 years) were included in the study. Participants all regularly ran ≥5km in a recreational capacity with an average weekly distance of 18 ± 3 km. VISA-A scores were 94 ± 11 (T1DM) and 94 ± 10 (control). Baseline Achilles tendon structure was the same in control and T1DM groups for all four UTC echo-types (I-IV) (Figure 1) and for AP thickness (p > 0.05). The Achilles tendon echopattern on UTC did not alter over the four-days post exercise in either group (Figure 2).

Median ± IQR for echo-types I-IV in T1DM and control group at Day 0

Median ± IQR for echo-types I-IV for Day 0, 2 and 4 in the (A) T1DM and (B) control grou
Discussion A novel finding that Achilles tendon baseline structure and response to a 10 km run over 4-days is the same in controls and T1DM. This suggests that T1DM individuals who are regularly physically active do not undergo the same structural changes to their Achilles tendon as previously demonstrated in the general diabetic population.
References Docking et al. Vet J. 2012;194: 338–42
Reddy, J Orth Research. 2003;21: 738–43
Rosengarten et al. BJSM 2013–092713;Online, 2014
van Schie et al. BJSM 2010;44, 1153–9