Article Text

Abstract
Background The FIFA has implemented an important antidoping programme for the 2014 FIFA World Cup.
Aim To perform the analyses before and during the World Cup with biological monitoring of blood and urine samples.
Methods All qualified players from the 32 teams participating in the World Cup were tested out-of-competition. During the World Cup, 2–8 players per match were tested. Over 1000 samples were collected in total and analysed in the WADA accredited Laboratory of Lausanne.
Results The quality of the analyses was at the required level as described in the WADA technical documents. The urinary steroid profiles of the players were stable and consistent with previously published papers on football players. During the competition, amphetamine was detected in a sample collected on a player who had a therapeutic use exemption for attention deficit hyperactivity disorder. The blood passport data showed no significant difference in haemoglobin values between out-of-competition and postmatch samples.
Conclusions Logistical issues linked to biological samples collection, and the overseas shipment during the World Cup did not impair the quality of the analyses, especially when used as the biological passport of football players.
- Football
This is an Open Access article distributed in accordance with the Creative Commons Attribution Non Commercial (CC BY-NC 4.0) license, which permits others to distribute, remix, adapt, build upon this work non-commercially, and license their derivative works on different terms, provided the original work is properly cited and the use is non-commercial. See: http://creativecommons.org/licenses/by-nc/4.0/
Statistics from Altmetric.com
Introduction
The Fédération Internationale de Football Association (FIFA) introduced doping controls in 1966 to ensure a fair competition prior and during the FIFA World Cup tournaments.1 The doping controls of the 2014 FIFA World Cup in Brazil were managed by the FIFA Medical Office and the FIFA Sports Medical Committee, as done for all the previous World Cups. Antidoping procedures were applied in accordance with the FIFA antidoping regulations and the respective WADA International Standards.2 ,3 Prior to the World Cup finals, an extensive campaign of out-of-competition (OOC) antidoping tests was organised to collect blood and urine samples from individual players from the 32 qualified countries, corresponding to a total of more than 750 OOC samples.4 This collection was the first step to implement the athlete biological passport (ABP), a new strategy in football.5–8 During the 64 matches played in Brazil, a further 300 blood and urine samples were collected in competition (IC). The real effect on the blood values for the biological passport obtained after a football game has not been really investigated until now.
This study aimed to compare the results of the analyses for several key biological parameters obtained in the OOC and the IC phases. This will preview the application of the biological passport in football. In addition, we aimed to provide a global picture of the antidoping analyses results in football.
Methods
Samples collection
For the OOC testing programme, 32 teams were tested during their training camp period, which extended from 3 March to 6 June 2014. In total, 779 urine samples, 769 whole blood samples (EDTA) and 773 serum samples were collected during the OOC. All sampling procedures were performed unannounced by a team of specially trained doctors and nurses according to the location of the teams. Samples from one team were grouped into a single parcel and sent to the laboratory, either by courier or delivered by hand under controlled temperature conditions as defined in the applicable regulations.2 During this precompetition phase, most of the samples were collected during training camps in the following countries: Austria, Belgium, France, Greece, Italy, the Netherlands, Norway, Portugal, Spain, Switzerland, the UK, Argentina, Brazil, Chile, Costa Rica, Mexico, the USA and Uruguay (figure 1).

Map of countries where out-of-competition samples were collected and geographical position of the Swiss Laboratory for Doping Analyses (LAD). In Europe: Austria, Belgium, France, Greece, Italy, the Netherlands, Norway, Portugal, Spain and Switzerland. In Americas: Argentina, Brazil, Chile, Costa Rica, Mexico, the USA and Uruguay.
FIFA World Cup 2014 took place in Brazil, from 12 June to 13 July, in 12 different venues (figure 2).
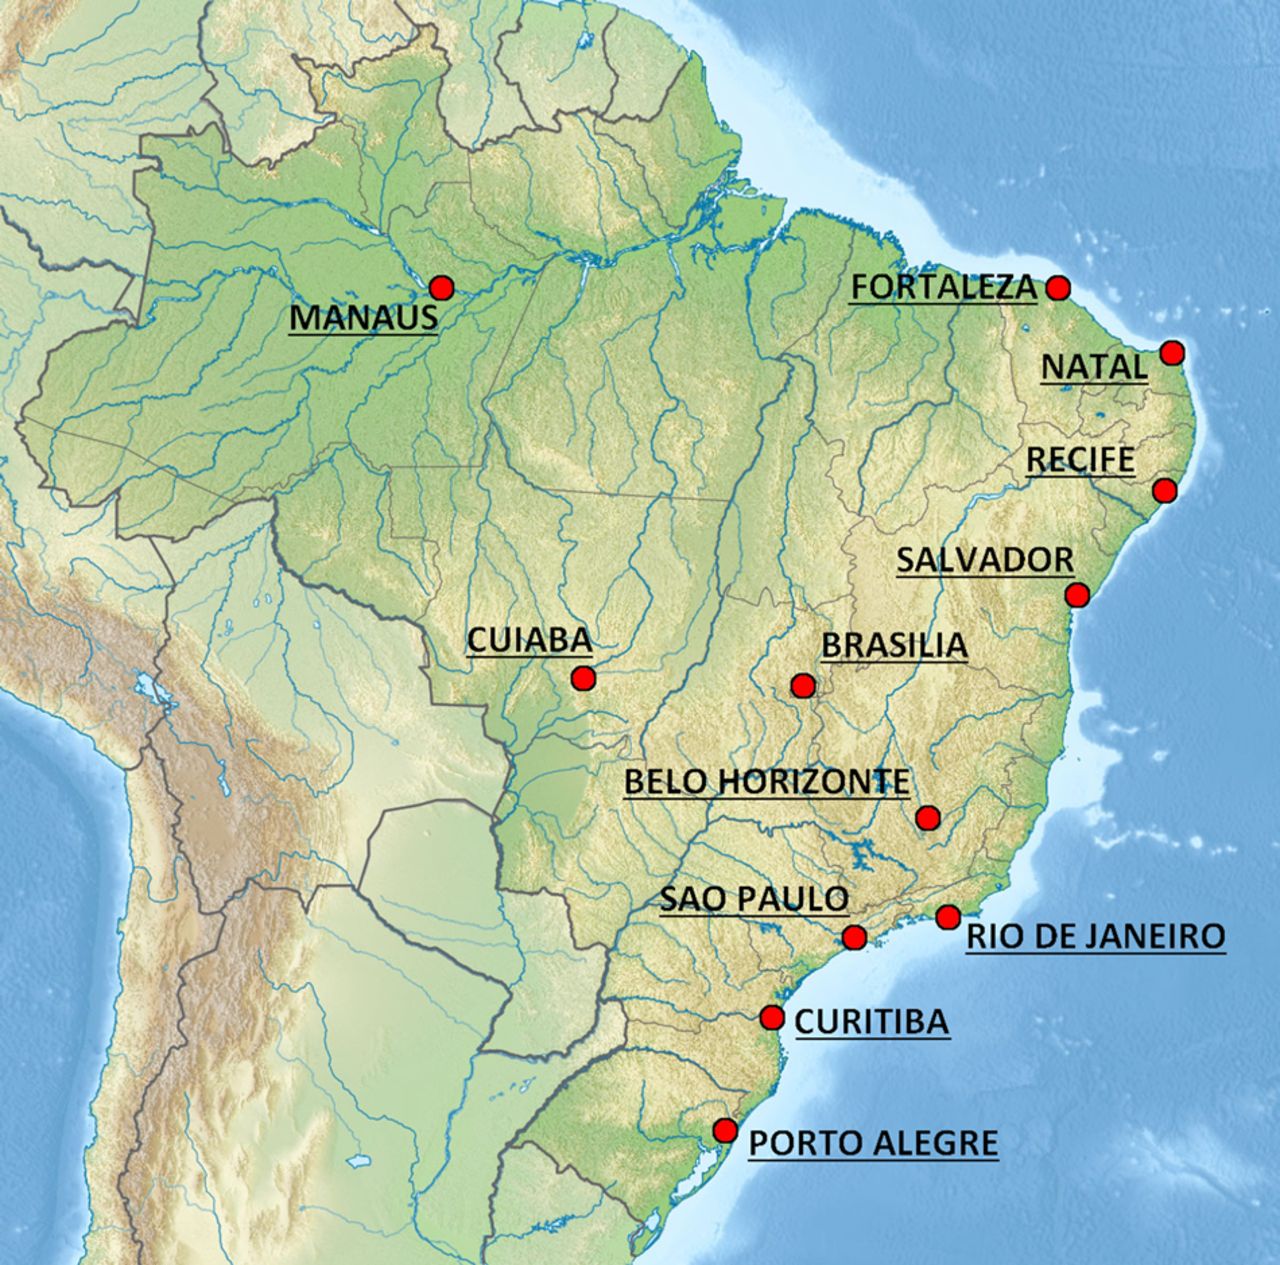
The 12 venues in Brazil for the 2014 FIFA World Cup.
In total, 300 urine samples, 305 EDTA and 307 serum samples were taken in the IC period of 64 matches. Each football game corresponded to one bundle was delivered to the Laboratory of Lausanne.
Sample delivery
To ensure fair competition during the tournament, results for tests were produced before the next match for each team. To achieve this, the transportation schedule was prepared in advance by the staff of the FIFA Medical Office. The local organising committee in Brazil coordinated with courier companies to ensure transportation conditions for the samples as described by the International Standard for Testing inside Brazil and overseas. Samples were kept at a refrigerated temperature between the collection sites and the laboratory. The delivery time for the shipments during the competition is described in the figure 3 and table 1. All samples arrived at the laboratory in less than 48 h, allowing the whole blood samples to be analysed in time as described in the WADA guidelines.
Delivery times and temperatures of refrigerated boxes at reception to the laboratory during the IC phase.

Delivery time of samples from the 12 venues to the laboratory during the 2014 FIFA World Cup.
In table 1, the analyses turnaround time is shown. The mean time for both urine and serum analytical reports to the FIFA Medical Office were made in less than 24 and 31 h, respectively. In these conditions, all results were reported in due time, prior to the next game for each participant in the competition. Temperatures of blood and serum samples were measured on the arrival in the laboratory and these met the international standards for testing. Samples were transported under appropriate refrigerated conditions.
Sample analysis
All urine samples were analysed with the established and accredited antidoping analytical methods. Quantification of the steroid profile was performed on a Hewlett Packard 6890 GC system plus gas chromatography system coupled to a Hewlett Packard 5973 Mass Selective Detector (Palo Alto, California, USA) mass spectrometer. Screening analyses for the detection of anabolic steroids (class S1) were performed on an Agilent 7890B gas chromatography system coupled to a Triple Quadrupole 7000B (Wilmington, Delaware, USA). Both instruments were used in standard antidoping analytical conditions.9–11 Before injection, urine samples were prepared as follows: 20 μL of ISTDs (methyltestosterone 200 ng/mL, testosterone-d3 80 ng/mL, epitestosterone-d3 40 ng/mL, androsterone-d4 glucuronide 200 ng/mL and stanozolol-d3 40 ng/mL), 1 mL of boiled phosphate buffer (0.8M, pH 7) and 50 μL of β-glucuronidase from Escherichia coli were added to 2.5 mL of urine. Prior to incubation, samples were left for 1 h at 50°C or overnight at 37°C (16 h). After hydrolysis, pH was adjusted to 8.5–9 with carbonate buffer (Na2CO3/NaHCO3 1/10, w/w) and liquid–liquid extraction (LLE) was performed with 5 mL of methyl tert-butyl ether. The organic layer was then transferred and evaporated to dryness, and residue was derivatised with 50 μL of MSTFA-NH4I-ethanethiol (1000:2:3, v/w/v) at 60°C for 20 min.
Compounds of classes S3, S4, S5, S6, S7, S8 and S9 were screened using an ACQUITY UPLC liquid chromatography system coupled to a Xevo TQ-S triple quadrupole MS from Waters (Milford, Massachusetts, USA). In total 100 µL of urine were diluted with 900 µL of buffer (ultrapure H2O with 0.6 µg/mL of mefruside as internal standard) before injecting into the LC-MS system running under conditions previously published,12 with a modified linear gradient going from 2% to 98% of organic phase over 6 min followed by a column re-equilibration step at initial mobile phase conditions for 3 min. This ‘dilute and shoot’ approach allowed the screening of the majority of β-2 agonists, hormone and metabolic modulators, diuretics and masking agents, stimulants and cannabinoids. Glucocorticoid aliquots came from the sample preparation described above for the anabolic steroids but after the LLE step, evaporation was followed by addition of 100 µL of the mixture 80/20 H2O with 0.1% formic acid/acetonitrile to 0.1% formic acid.
The Steroidal Module of the ABP is based on the premise that samples collected on a longitudinal basis should show an athlete's physiological levels of hormones unaffected by any doping practice.13 The athlete's steroidal variables are collected and analysed over a period of time through the usual urine tests and then the steroid profile is measured. It consists of the urinary concentrations of testosterone (T), epitestosterone (E), androsterone (A), etiocholanolone (Etio), 5α-androstan-3α,17β-diol (5αAdiol) and 5β-androstan-3α,17β-diol (5βAdiol), together with the urine sample specific gravity (SG). T concentration is one of the six parameters included in the steroid profile. In case of abnormal steroid profiles data (T/E ratio over 4.0; T concentration greater than 200 ng/mL or concentration of A or Etio greater than 10 000 ng/mL14), the method for determining the isotopic composition of the relevant analytes is applied. This includes gas chromatography, a subsequent combustion to CO2 and finally, mass spectrometric analyses of this gas in a specific multicollector mass spectrometer (gas chromatography combustion-isotope ratio mass spectrometry, GC-C-IRMS). The 13C/12C ratio, expressed in δ13C values (%), were determined for T metabolites and compared with that of urinary reference steroids within the sample.
Sample extraction procedures and IRMS analyses are described as ‘procedure A’ by Saudan et al.15
Luteinizing Hormone (LH) and human chorionic gonadotropin (hCG) were measured once in every urine sample (OOC and IC) using the Immulite 2000XPI instrument (Siemens Healthcare Diagnostics Products Ltd, Llanberis, UK) and the LH (ref. L2KLH6) and HCG kits (ref. L2KCG6). In case of hCG confirmation procedure, the intact hCG was detected by sandwich ELISA method (Human Chorionic Gonadotropin ELISA, ALPCO, USA).
While every urine sample was analysed, serum samples were partly screened for erythropoiesis-stimulating agents (ESAs), hematide and recombinant human growth hormone (rhGH). Among the 773 serums collected during the OOC period, 65 were screened for hematide, 203 for ESAs and 198 for rhGH whereas hematide, ESAs and rhGH were screened IC in 17, 135 and 125 samples, respectively. On reaching the laboratory, serum samples were centrifuged and aliquoted to follow WADA guidelines, especially regarding rhGH analyses.
Previously published hematide method16 was applied using 100 µL of serum submitted to an enzymatic digestion with subtilisin and a solid phase extraction step before running on the ultra-high performance liquid chromatography–tandem mass-spectrometry (UHPLC-MS-MS) analytical tool as described above from Waters.
ESAs were tested in serum samples subjected to affinity purification with EPO Purification Kit (MAIIA Diagnostics). Samples were passed to 10% in buffer (20 mM Tris pH 7.5, 0.1 M NaCl, 0.1% Tween 20 and 0.02% NaN3). The diluted serums were passed through Millex GV filters (0.22 μm), purified by immunoaffinity and eluated with 50 μL Desorption (low pH) buffer. Then, pH-neutralisation was performed by addition of 5 μL adjustment buffer (0.1 M Bis-Tris pH 7.0, 0.1 M NaCl, 10 mM glycine, 0.1% Tween 20 and 0.02% NaN3). SARCOSYL-PAGE was performed as previously described by Reichel et al17 with minor modifications. BlotCycler technology (Precision Biosystems, Mansfield, Ohio, USA) was used for incubations (blocking and antibodies) and washing steps at 4°C.
rhGH isoforms analyses were made using the WADA-approved kits18 and by following manufacturer instructions. Briefly, 150 µL of serum were loaded with 50 µL of furnished buffer. After incubation (2 h at room temperature), tubes were extensively washed. A total of 200 µL of acridinium-labelled secondary antibodies were added and incubated for 2 h. After systematic washing, tubes were revealed with hydrogen peroxide. A luminometer (LB953, Berthold, Switzerland) allowed the quantification of the signal emitted by acridinium oxidation. Calculation of rhGH isoforms ratio was based on the standard curves loaded in parallel from routine samples.
The 1077 EDTA samples (771 OOC and 306 IC) were analysed after being received at the laboratory and according to the ABP Operating Guidelines.19 Every sample was analysed twice, on the same day, on the same haematology analyser (Sysmex XN-2000; Sysmex Europe, Norderstedt, Germany). If the results between two measures on the same instrument were >0.1 g/dL for haemoglobin (HGB) and/or >0.15% for reticulocytes percentage (RET%) (for values equal or below 1.00%) or 0.25% (for values above 1.00%), duplicate measurements were repeated once again on the same analyser. Instruments were submitted to regular internal and external quality control procedures as required by the Standards of Laboratory Medicine.
All FIFA biological samples were analyzed in dedicated batches which included regular positive and negative controls as described in the standard operating procedures which are a part of the ISO 17025 scope of accreditation of the Swiss Laboratory for Doping Analyses and as per procedures of the International Standard for Laboratories.3
Results
Preanalyses
Prior to initial testing procedures in the laboratory, two preanalytical measurements were performed on a sample: pH and SG. As shown in figure 4A, pH is distributed normally for all urine samples, with no value exceeding the critical value of 8.5. No significant difference was found between OOC and IC samples with regard to pH and the distribution is comparable to previous results described in similar football competitions.20 ,21

pH (A) and specific gravity (B) of OOC and IC urine samples from the 2014 FIFA World Cup (IC, in competition; OOC, out of competition).
SG was also measured on all urine samples for preanalytical purposes and for the correction of the concentrations of endogenous steroid metabolites according to the WADA technical document dedicated to endogenous anabolic androgenic steroids measurement.14 This parameter also indicates the hydration state of the player at the time of sample collection.
The distribution of the SG values for all IC and OOC urine sample tests is shown in figure 4B. Higher SGs were measured for the OOC urine samples (mean: 1.017) compared to the IC samples (mean: 1.014).
Overall results of antidoping analyses
Clenbuterol
Among the 779 urine samples collected OOC, 4 samples, collected in Mexico and Spain, showed traces of clenbuterol. Two of these samples were reported as negative because clenbuterol concentrations were below the reporting limit of the laboratory (5 pg/mL) whereas the other two samples contained clenbuterol concentration of about 50 pg/mL and were reported as adverse analytical findings (AAF).
Tramadol and formestane
Among the samples collected OOC, 7 contained tramadol parent compound (ranging from 16 to 5 µg/mL) and metabolite (ranging from 130 ng/mL to 3.5 µg/mL). One urine sample contained an abnormally high concentration of formestane (73 ng/mL).
Glucocorticoids, hCG and LH
Among the 300 IC samples, 3 contained glucocorticoids (prednisone and prednisolone, triamcinolone acetonide, budesonide metabolite) above the WADA minimum required performance limit (MRPL) of 30 ng/mL and in another sample prednisolone was detected at a concentration below the MRPL.22 Immulite screening quantification of hCG revealed that one sample contained hCG at a concentration of 13.6 mIU/mL. Additionally, one sample presented an elevated LH concentration (69 mIU/mL).
Amphetamine
One IC sample was reported as AAF for the presence of amphetamine at a concentration of about 600 ng/mL. However, the presence of the substance was explained by a valid therapeutic use exemption (TUE) for a treatment against attention deficit hyperactivity disorder.
Endogenous steroid profiles
Distribution of T concentrations with and without correction with SG is depicted in figure 5. Without correction, a high number of samples have a T concentration in the low range of 0–10 ng/mL (figure 5A). Considering the SG distribution, as shown in figure 4B, more samples have an SG lower than 1.020, which then produced an increase of apparent T concentration after correction (figure 5B). Adjustment of T concentrations was calculated using the formula described in the technical document:14

The distribution observed after correction is similar to the T/E ratio distribution illustrated in figure 6.

Distribution of T concentrations (in ng/mL) in urine samples from the 2014 FIFA World Cup. (A) T concentrations without correction. (B) T concentrations after correction with SG (IC, in competition; OOC, out of competition, SG, specific gravity; T, testosterone).

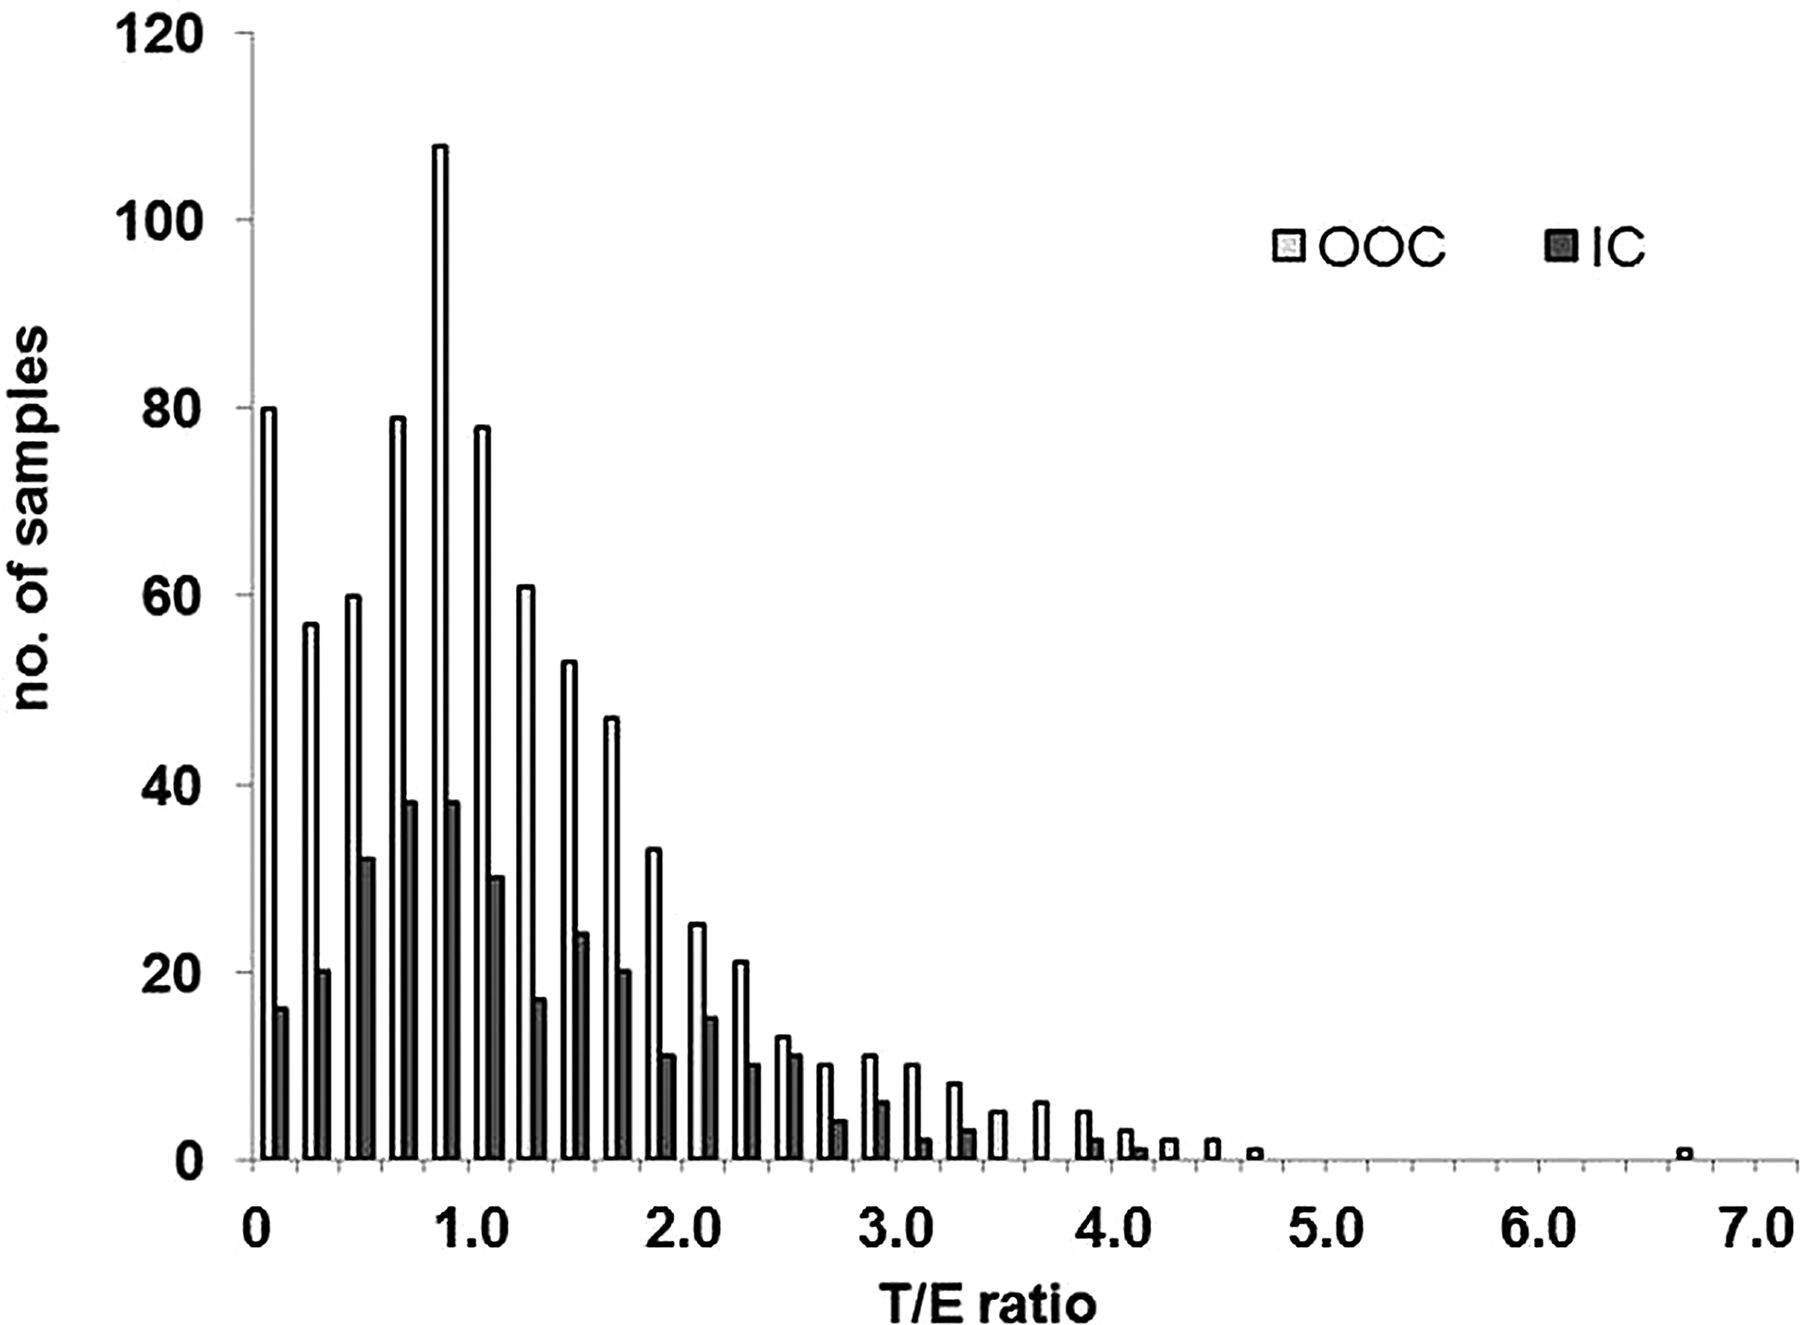
T/E ratio distributions measured in urine collected out-of-competition (OOC) and in competiton (IC).
Nine OOC samples having a T/E ratio higher than 4.0 (ranging from 4.2 to 6.7) and one IC sample having a T/E ratio of 4.1 were analysed by GC-C-IRMS to determine a potential exogenous origin of T abuse. All of these were reported as negative as IRMS results clearly showed an endogenous origin of T and/or its precursors. Steroid profile data of players tested 3 times or more (OOC and IC) were integrated in the adaptive model of the Steroidal module of the ABP. Two examples are given in figures 7 and 8.
Haematological parameters
Whole blood samples were collected from all the qualified players during the OOC tests and all tested players after the games. The WADA procedures for the blood tests, as described in the operational guidelines for the biological passport, were entirely applied, except for the 2 h delay before blood collection after the match. In the operating guidelines, the appendix A is dedicated to the blood sample collection requirements.19 “If collection occurs after training or Competition, test planning shall … ensure testing does not occur within two hours of such activity…If for some reason, the Sample was taken within two hours of training or competition, the nature, duration and intensity of the exertion shall be recorded.”
For logistical reasons, the 2 h wait after exercise was not feasible at the FIFA World Cup and, therefore, was not applied. In fact, antidoping tests in football right after the game have always been challenging because of the players. In principle, blood collection is not time-consuming, in contrast to urine sampling. For this reason, the antidoping authorities of FIFA collect the blood tests as soon as the player arrives in the antidoping collection room, directly after the game. Depending on the location of the antidoping room in the stadium and the duration of press interviews, the time after exercise can vary from 15 and 90 min, if the player was still on the pitch at the end of the game. Furthermore, the nature and the duration of participation in the competition were recorded.
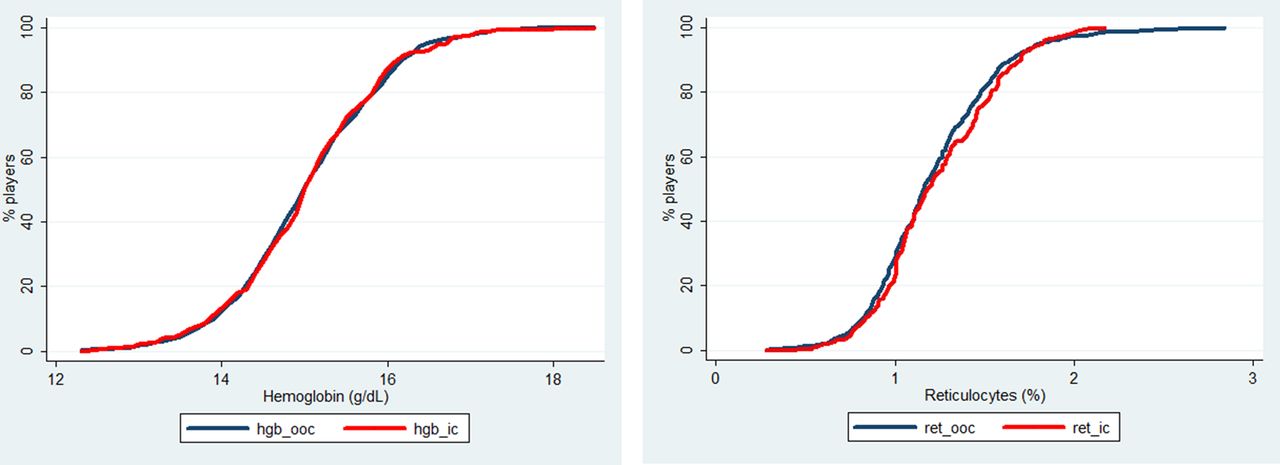
Even though the World Cup tournament is not considered as a controlled study, the data obtained on the field can give a good indication of the real effect of a football match on these parameters. Figure 9 shows that the parameters measured for the red cell lines are not significantly different between IC and OOC samples.

Steroid passport and concentrations (without SG correction) of a player with a normal UGT2B17 genotype (A, androsterone; CV, coefficient of variation; E, epitestosterone; Etio, etiocholanolone; IC, in competition; LH, luteinizing hormone; OOC, out-of-competition; SG, specific gravity; T, testosterone; 5αAdiol, 5α-androstan-3a,17β-diol; 5βAdiol, 5β-androstan-3a,17β-diol).
The cumulative frequency distribution curves of the haemoglobin concentrations and the reticulocyte percentage, the two main components of the blood passport (figure 10) do not show any difference between OOC and IC samples. Contrary to what was shown at Euro 2008,21 there was no significant effect of the competition on the values of these critical blood parameters.

Steroid passport and concentrations (without SG correction) of a player with del/del UGT2B17 genotype (A, androsterone; CV, coefficient of variation ;E, epitestosterone; Etio, etiocholanolone; IC, in competition; LH, luteinizing hormone; OOC, out-of-competition; SG, specific gravity; T, testosterone; 5αAdiol, 5α-androstan-3α,17β-diol; 5βAdiol, 5β-androstan-3α,17β-diol).
Most of the players did not have more than 2–3 blood tests (1 OOC and 1–2 IC) then it was not deemed relevant to establish a blood passport at this stage for all players. Groups of players were established as a function of their position in the field and the time they played during the matches.
As observed in table 2, there is homogeneity in the blood data between the different groups, with no significant effect within the groups, if the collection was done IC or OOC.
Blood passport values of players depending on their position and the time spent on the field
Discussion
Preanalyses
The measurement of pH allowed the laboratory to check if the urine degraded before or during the transportation process, for example, by bacterial contamination. In the case of an elevated pH (>8.5), the steroid profile could be affected as bacterial contamination was clearly described to be a confounding factor impacting the endogenous anabolic steroid concentrations (T and related compounds) and the profile interpretation.23 ,24 SG was a useful parameter to evaluate the hydration status during the competition phase, especially in hot and extreme weather conditions. During the competition phase, the SG results show that all players were well hydrated, which was not necessarily the case during the OOC tests.
Clenbuterol
Clenbuterol abuse in sports is an important topic in the fight against doping as this compound is used and authorised for animal feeding in specific countries. Meat contamination has previously resulted in the presence of a small amount of clenbuterol in urine samples of tested football players as well as volunteers.12 ,25–28 Clenbuterol abuse in different countries is far from solved and AAF in urine samples collected in different countries, particularly in Mexico, continues to be present on a regular basis.
Tramadol and formestane
Tramadol is part of the WADA monitoring programme and laboratories report these cases as negative. Formestane is considered as a potent aromatase inhibitor that could minimise side effects of anabolic steroids abuse by reducing the conversion into oestrogens29 ,30 and therefore, it is included in the S4 class of the WADA forbidden list. Formestane could also stem from endogenous origin.31 The WADA defines a threshold for which additional analysis is performed to prove the endogenous or exogenous origin of this substance. During the 2014 FIFA World Cup in Brazil, the technical document stated that “GC-C-IRMS analysis shall be conducted before reporting an Adverse Analytical Finding for Samples containing formestane at less than 150 ng/mL”.22 GC-C-IRMS confirmation analysis was performed following the method published by Piper et al30 and the results indicated an endogenous origin of formestane leading to a negative reporting of the sample.
Glucocorticoids, hCG and LH
Glucocorticoids are part of class S9 of the WADA list32 and are prohibited when administered by oral, intravenous, intramuscular or rectal routes. Administration through alternative routes is justified by a TUE ruled by the dedicated WADA International Standard for TUEs (ISTUE).33 Three urine samples contained glucocorticoids above the MRPL; after consultation with the FIFA Medical Board, a valid TUE was effective for all of them and the results were reported as negative.
According to the WADA guidelines for reporting and management of hCG findings,34 “samples producing a concentration of total hCG above 5 mIU/mL on the Initial Testing Procedure, laboratory shall perform a confirmation procedure to quantify intact hCG.” If the intact form concentration is still above 5 mIU/mL, the laboratory reports an AAF, otherwise an atypical finding (ATF) report is produced. The confirmation analysis was performed on the sample containing performed 13.6 mIU/mL. ELISA kit showed that intact hCG fell below 5 mIU/mL and thus, the laboratory reported the sample as ATF. No threshold has been defined for LH in urine to report a case as AAF, but high amount of urinary LH could be a marker of T or other anabolic steroids manipulation.35 ,36 A close analysis of the steroid profile of this sample allowed the laboratory to consider the case as negative.
Endogenous steroid profiles
The OOC distribution of the T/E ratio clearly shows the already published bimodal figure9 ,37 ,38 which was explained by genetic polymorphism of the enzyme involved in the T metabolism.39–41 A complete deletion of the UGT2B17 gene (del/del genotype) involved in the phase II (glucuronidation) metabolism results in a decrease of urinary T excretion and thus, results in lower T/E ratio compared to the normal mean value of 1–1.2. In contrast, the IC samples repartition of the T/E ratios does not follow this bimodal distribution. This could stem from the early disqualification of the Asian teams after the first round of the tournament, as the del/del genotype has been shown to be significantly higher among Asian people compared to the other ethnicities.42 ,43
The ABP uses the athlete's own values rather than population values as a basis for evaluation. The longitudinal profile of specific markers (5αAdiol/5βAdiol, A/T and T/E ratios) was analysed to determine if any atypical patterns were present. Before the introduction of the ABP steroid module, if the T/E ratio was greater than 4, the laboratory had to perform an IRMS analysis to detect the use of exogenous (from outside the body) steroids. With this ‘population reference’ approach, only high values resulted in IRMS testing. Now, with the adaptive model, the intraindividual variation of specific markers is considered to perform or not to perform an IRMS test.
An important feature of the urinary steroid profile is the stability of the ratios issued from steroid quantification. Whereas A/Etio, 5αAdiol/5βAdiol and A/T are more subjected to variations,9 the T/E ratio has proven to be stable over time.44–47 This characteristic has been at the origin of the implementation of the steroidal module of the ABP.8 ,38 ,48 Since January 2014, the adaptive model is applied on all the analytical data provided by the WADA accredited laboratories in Antidoping Administration and Management System (ADAMS). Figures 7 and 8 depict the longitudinal profiles of a ‘normal’ subject and most probably del/del player, respectively. Even if no genotyping has been performed on the players, it is highly credible that participants with a collapsed T concentration in urine and thus with low T/E ratio (below 0.5) are depleted in enzyme responsible for T excretion in urine. As observed in figures 7 and 8, the adaptive model shows stable measurement during the OOC and IC period. The fact that all samples were analysed in the same laboratory with the same analytical procedure favoured the stability of the ABP profiles. Even if the robustness and reliability of steroid profile quantification is insured by WADA from among all the accredited laboratories, it is a well-known fact that variability increases when several methods and techniques are used.23 ,49

Blood parameters in OOC and IC samples. Percentage of OOC values were calculated considering the IC data as 100% (HCT, haematocrit; HGB, haemoglobin; IC, in competition; IRF, immature reticulocyte fraction; MCH, mean corpuscular haemoglobin; MCHC, MCH concentration; MCV, MC volume; OOC, out-of-competition; RBC, red blood cell (erythrocyte) count and Ret, reticulocyte percentage.
Cumulative frequency distribution curves for haemoglobin (left panel) and reticulocytes (right panel) in the in competition (red line) and out-of-competition (black line) samples.
Summary
The main lesson learned from the FIFA World Cup 2014 were: (1) meticulous organisation of antidoping tests on the field and well-controlled shipments of samples to the laboratory by the antidoping authority does not compromise the samples. This allows the accredited laboratory to provide valid results. (2) No differences were observed between ou-of-competition and postcompetition for haematological values.
Acknowledgments
The authors would like to thank all the technical and administrative staff of the Swiss Laboratory for Doping Analyses who were fully engaged during the OOC and IC periods linked to 2014 FIFA World Cup Brazil. They are grateful to Violette Allora, Anne Ballif, Charlotte Brunner, Christèle Carruzzo, Mélanie Johner, Alexandra Melchior, Roxane Rochat, Rita Saugy, Magali Wicht, Giuseppe Ciminera and Michel Delcioni for their precious and reliable collaboration. The authors also thank the FIFA collaborators, namely, Martin Vaso, Monika Keller, Anja König, Philipp Tobler and Alexis Weber for their logistical and technical support before and during the 2014 FIFA World Cup Brazil 2014.
References
Footnotes
-
Contributors JD and MS conceived the study design and the antidoping programme. NB, NJ, CE, BM, CS, SG, NL, FM, RN, LP and NR managed the samples and data analyses. NB and MS wrote the first draft and all authors contributed to the revision of the final manuscript.
-
Competing interests None.
-
Provenance and peer review Not commissioned; externally peer reviewed.