Article Text

Statistics from Altmetric.com
Sports injury prevention is a priority area in BJSM 1 and recent commentaries have stressed the need to consider relationships between sports injuries in longitudinal data sets.2 ,3 Players can sustain none, one, or more than one injury over a season of follow-up. Subsequent injuries are statistically related to prior injuries because they occur in the same person. This is true even when the two injuries are clinically distinct.2 ,4 ,5
It is always important to collect, analyse and report data on subsequent injuries in injury incidence studies. Figure 1 shows a hypothetical cohort of five players followed over one season of 10-week duration. This example assumes that all players are injury-free at the start of the season and addresses acute onset injuries rather than those due to repetitive microtrauma. The figure contains considerable information on each player: how long they were followed up; the number of injuries they sustained; how long before they sustained their first injury; and how long after any injury it took before they sustained their next one. Open circles indicate points at which players were injured, and stars indicate when follow-up was censored (eg, player 2 was only followed up for 7-weeks for non-injury reasons). A player does not accrue time at risk when he/she is unable to participate. For example, all of player 3's injuries result in time loss (TL) from the sport for healing and rehabilitation. None of player 5's injuries, on the other hand, result in any TL; these are known as non-TL injuries.

Hypothetical prospectively collected injury data.
The problem
Longitudinal sports injury data are often analysed in one of the three ways:
A risk,
A rate,
Time to first injury (hazard).
All three approaches have profound limitations.3 ,6
Some studies report injury incidence in terms of the number of injured players divided by the number of players on the team at pre-season (far right hand side, figure 2). This is the average probability of injury, which is a risk. A risk answers a question often voiced by players and/or their families at pre-season: What is the probability that I will be hurt this season? To compute a one-season risk, the data for each player is reduced to a binary outcome: yes—sustained ≥1 injury, and no—remained injury free. Such analyses ignore how many injuries people sustain, as well as ignore the timing between subsequent injuries. In our figure, players 1 and 3 contribute the same information to a risk, despite of the fact that player 3 has three injuries and player 1 has one injury.
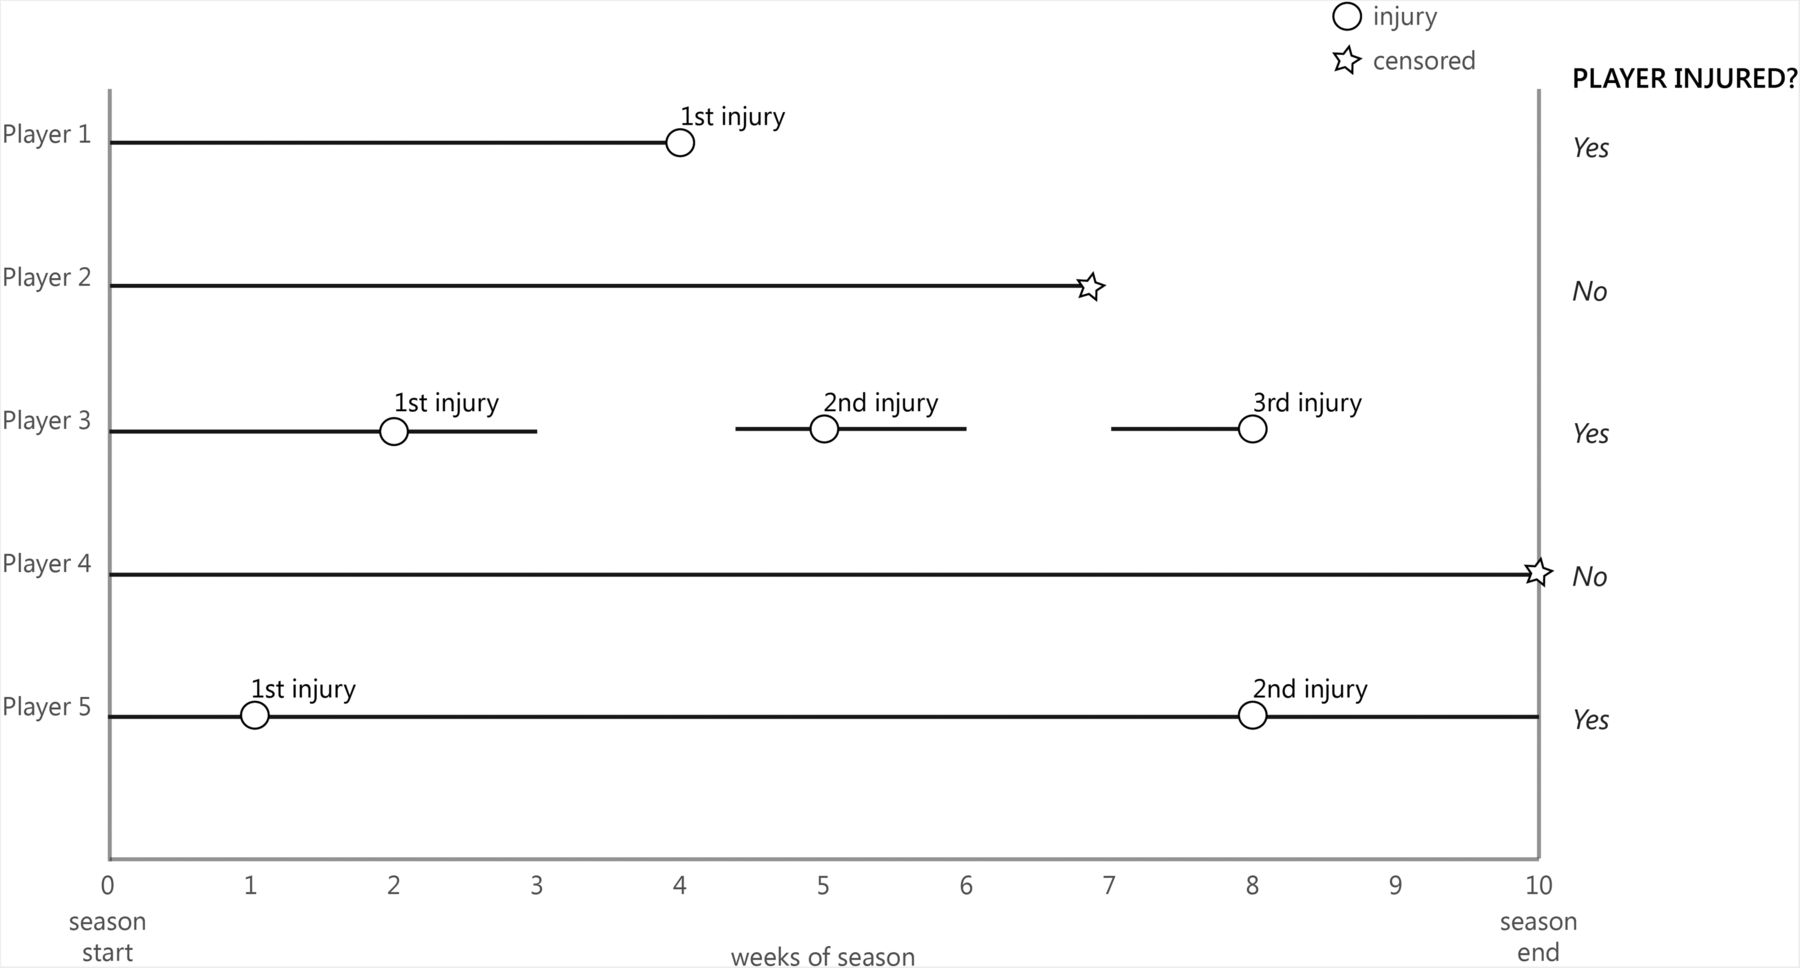
Common approach to reporting injury incidence in terms of injured athletes.
An alternative approach is the injury rate. The rate (or ‘incidence density’) is the number of injuries divided by the total person-time at risk (far right hand side, figure 3). Scientists use rates because, unlike risks, they use more of the injury information and account for variation in follow-up between respondents. However, rate does not have an obvious interpretation for non-scientists. A problem with rates is that the measure still ignores the length of time between injuries and inherently assumes that multiple injuries to the same person were unrelated. Thus, three non-TL injuries to three different players followed for 3 weeks each yields the same rate as three non-TL injuries to the same player followed for 9 weeks. However, these are two different situations from clinical and resource allocation standpoints.7
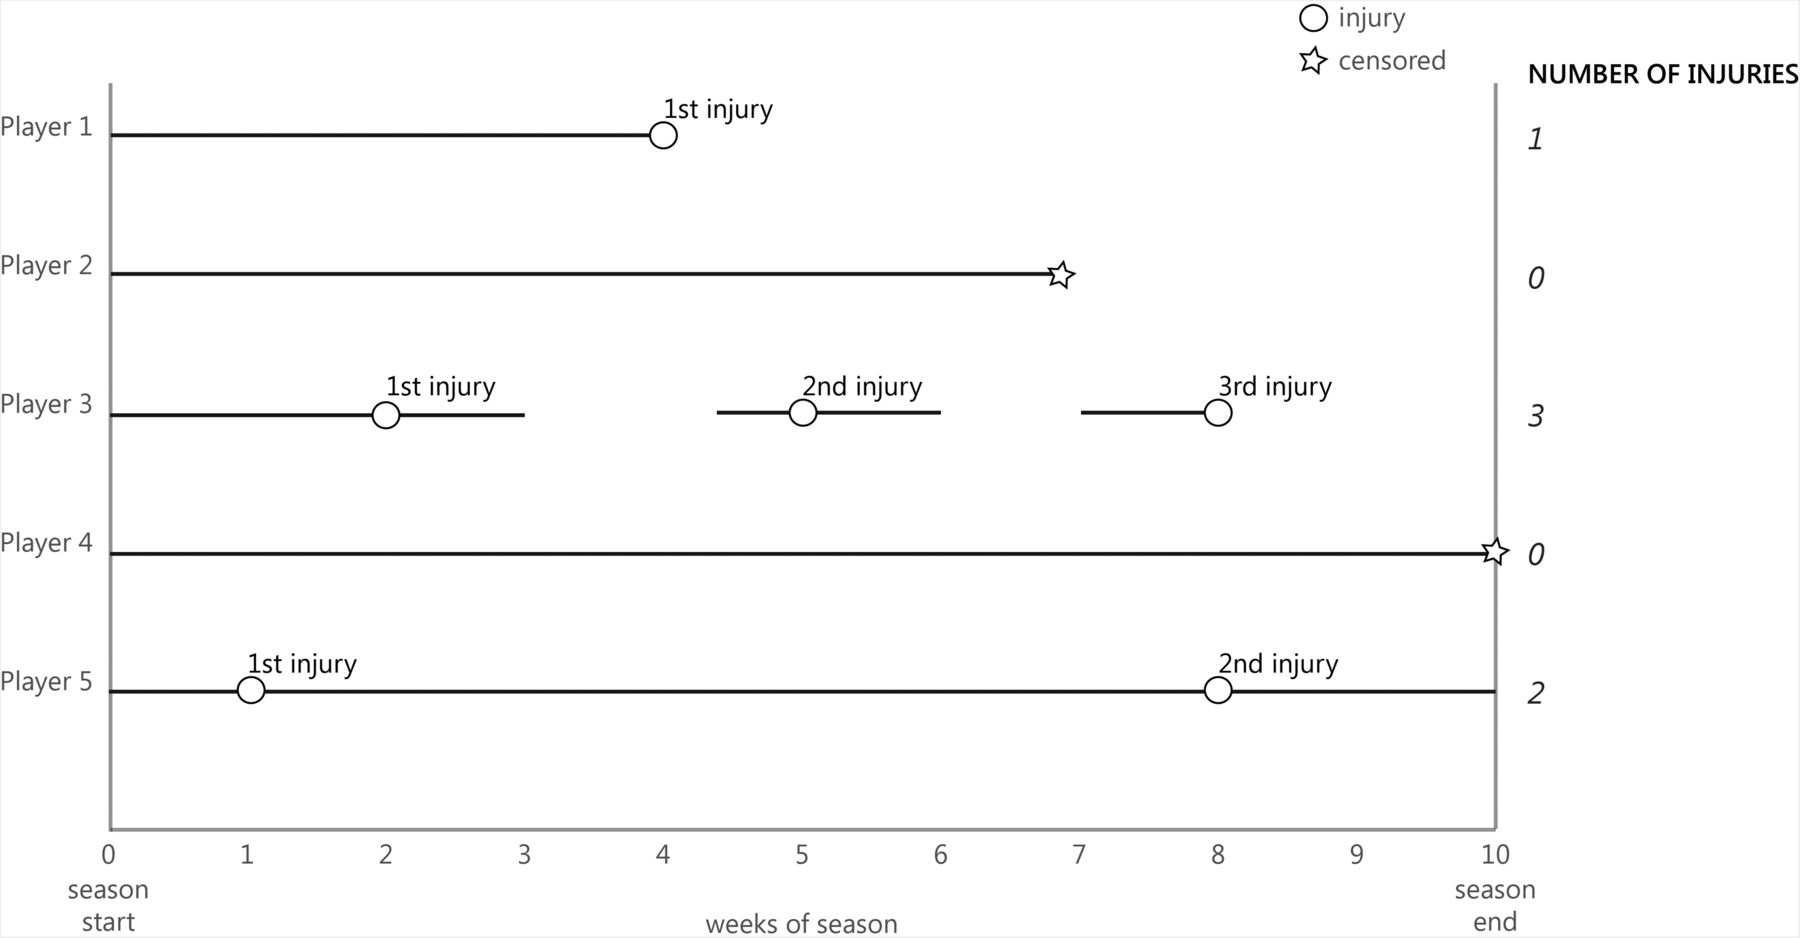
Common approach to reporting injury incidence in terms of injury counts.
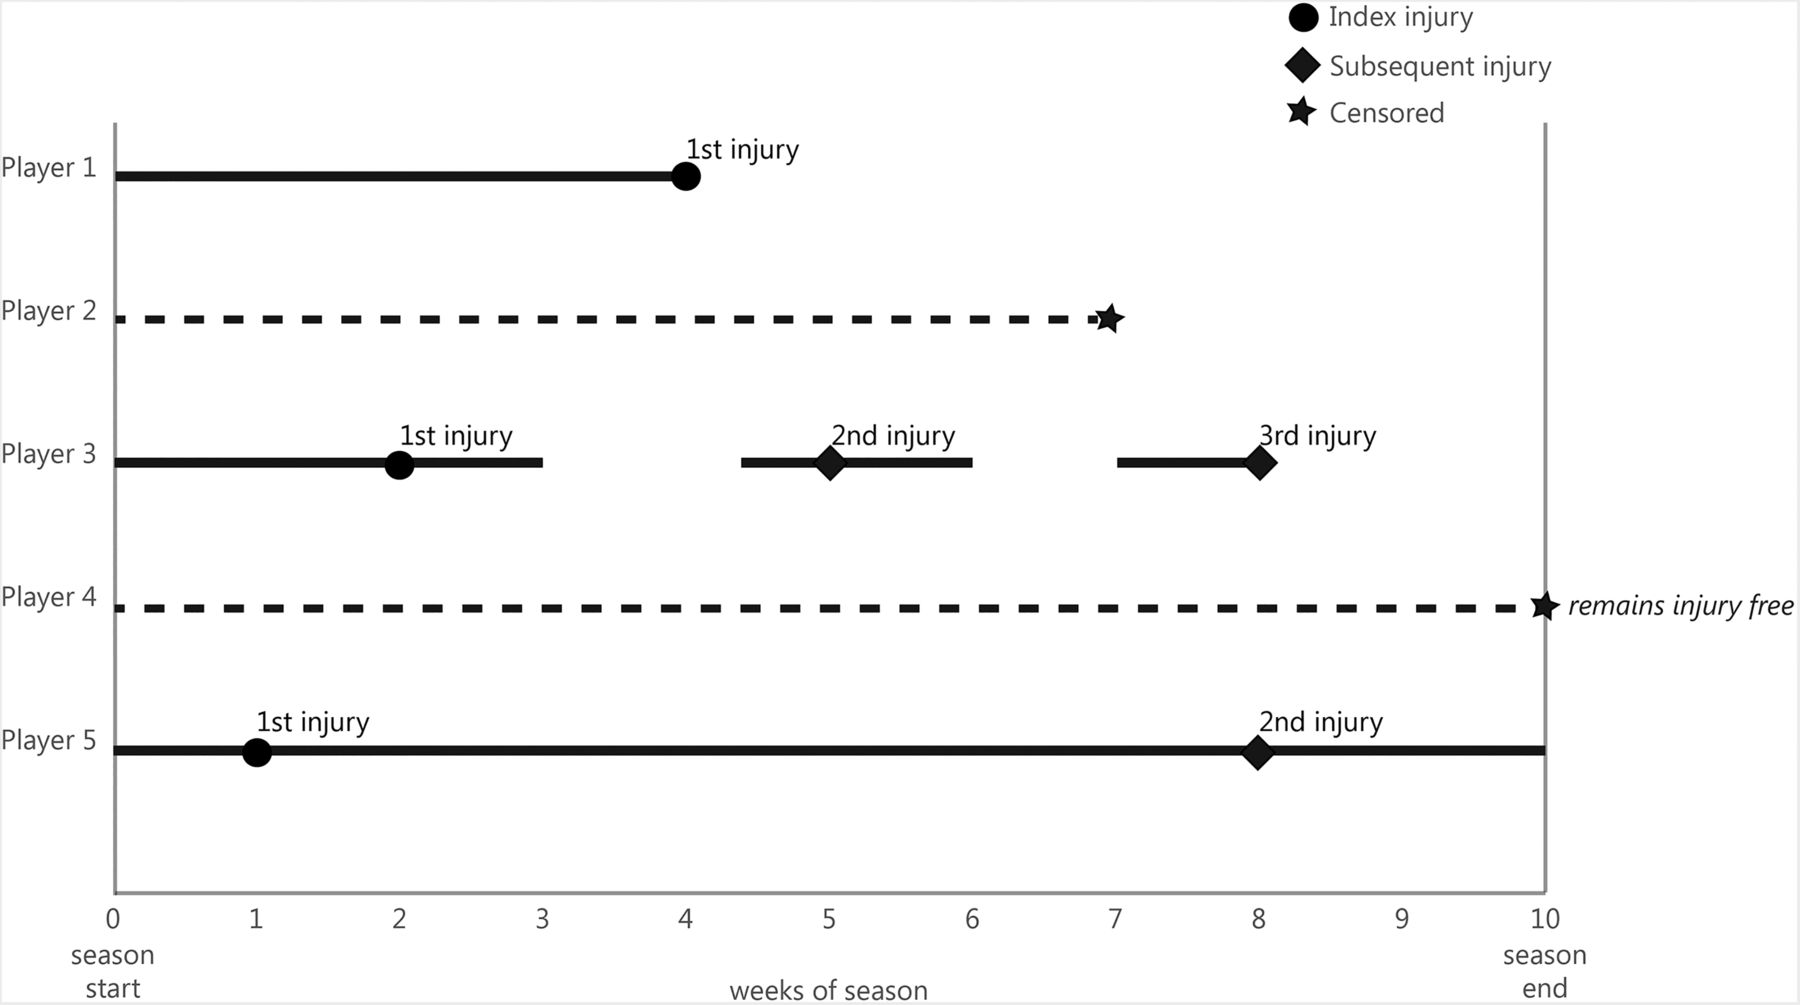
The third approach is to use simple survival analysis to compute time to first injury (bold lines, figure 4). This quantity is known as initial hazard and it is equivalent to a rates analysis in which all respondents are censored after their first injury. But by limiting analysis to time to first injury only, this approach also excludes information about subsequent injuries. Thus data on only one injury is included for player 2 and data on two subsequent injuries is excluded from the player 3's injury profile.

Common approach to reporting injury incidence in terms of time to first injury.
The solution
Appropriate survival analysis methods are now available that make full use of all longitudinal sports injury data (figure 5). These use essentially the same model as simple survival with the modification that all time intervals are included: to first injury, between all subsequent injuries and through to the end of follow-up. When injuries are coded as index or subsequent injuries according to a classification such as the subsequent injury categorisation (SIC) model,2 relationships between injuries can be determined and analysed. Statistical techniques for longitudinal data sets incorporating all injuries and the intervals between them are relatively simple to implement in most statistical software and often merely comprise applying the standard survival model to a restructured data set8 or extensions to the usual Cox regression model.3

Illustration of relationships between index and subsequent injury.
Summary
Significant time and resources are expended collecting high-quality longitudinal injury data. However, most data analyses from these studies do not adequately address repeated injury events on the same athlete, and therefore squander useful data. More efficient analysis models are described in the statistical literature but, regrettably, are uncommon in sports medicine.3 Importantly, the quality of the scientific evidence needed to underpin clinical decision-making about recurrent injuries is lacking because the appropriate statistical techniques for subsequent injuries are currently underutilised.9 Therefore, it is recommended that sports injury epidemiologists use the SIC to fully make use of all relevant longitudinal sports injury data (as shown in figure 5).
Acknowledgments
This material was presented by Caroline F Finch as part of a conference presentation at the Be Active 2014 Conference organised in Canberra, Australia by Sports Medicine Australia. She was awarded the ASICS Best Paper Injury Prevention award for her presentation at this conference.
Footnotes
Twitter Follow Caroline Finch at @CarolineFinch
Funding CFF is funded by a National Health and Medical Research Council (NHMRC) Principal Research Fellowship (ID1058737). ACRISP is one of the International Research Centres for the Prevention of Injury and Protection of Athlete Health supported by the IOC. The University of North Carolina Injury Prevention Research Center is partially supported by an award R49CE002479 from the National Center for Injury Prevention and Control, Centers for Disease Control and Prevention.
Competing interests None declared.
Provenance and peer review Not commissioned; externally peer reviewed.