Article Text

Abstract
Background Depression represents a growing public health burden. Understanding how screen time (ST) in juveniles may be associated with risk of depression is critical for the development of prevention and intervention strategies. Findings from studies addressing this question thus far have been inconsistent. Therefore, we conducted a comprehensive systematic review and meta-analysis of data related to this question.
Methods The meta-analysis was conducted in accordance with the PRISMA guideline. We searched the electronic databases of PubMed, Web of Science and EBSCO systematically (up to 6 May 2015). OR was adopted as the pooled measurement of association between ST and depression risk. Dose–response was estimated by a generalised least squares trend estimation.
Results Twelve cross-sectional studies and four longitudinal studies (including 1 cohort study) involving a total of 127 714 participants were included. Overall, higher ST in preadolescent children and adolescents was significantly associated with a higher risk of depression (OR=1.12; 95% CI 1.03 to 1.22). Screen type, age, population and reference category acted as significant moderators. Compared with the reference group who had no ST, there was a non-linear dose–response association of ST with a decreasing risk of depression at ST<2 h/day, with the lowest risk being observed for 1 h/day (OR=0.88; 95% CI 0.84 to 0.93).
Conclusions Our meta-analysis suggests that ST in children and adolescents is associated with depression risk in a non-linear dose–response manner.
- Depression
- Physical activity
- Psychology
- Sedentary
- Adolescent
This is an Open Access article distributed in accordance with the Creative Commons Attribution Non Commercial (CC BY-NC 4.0) license, which permits others to distribute, remix, adapt, build upon this work non-commercially, and license their derivative works on different terms, provided the original work is properly cited and the use is non-commercial. See: http://creativecommons.org/licenses/by-nc/4.0/
Statistics from Altmetric.com
Introduction
With advances in technology, screen time (ST), including watching television, using a computer and playing video games, is becoming a central component of the daily lives of young children and adolescents and their most common sedentary behaviour,1 which is a construct separate from simple lack of physical activity2 and defined as any waking behaviour characterised by an energy expenditure of no more than 1.5 metabolic equivalent tasks while in a sitting or reclining posture.3 It has been estimated that infants aged 8–18 years in the USA spend an average of more than 7 h/day watching television, using a computer and playing video games.4 Given that this trend may continue to increase, it is important that we understand the possible impacts of extensive ST on children and adolescents.
The displacement hypothesis5 ,6 suggests that time spent on screen-based activities may replace time participating in more productive and/or active activities, especially activities involving physical movement and interpersonal communication, and thus may affect the physical and mental health of young people. Concordant with this hypothesis, ST-based sedentary behaviour has been associated with risks of a variety of diseases, including cancer,7 cardiovascular disease,7 obesity,8 sleep problems, diminished psychological well-being9 and depression.10 ,11
Depression is defined as a cluster of specific symptoms with associated impairment,12 which represents a global public health burden, even for children and adolescents. Depression in juveniles is associated with substantial functional impairment and psychological health problems,12 ,13 such as substance abuse,14 impaired psychosocial functioning15 and suicide risk,16 as well as relevant to a series of psychological health disorders in later adult life.17 To evaluate whether ST-based sedentary behaviour may be associated with risk of depression in children and adolescents is critical in better guiding appropriate prevention and intervention strategies, in the hope of decreasing the burden from depression.
Depressed mood, depression syndromes and depression disorders reflect three levels of depression.18 In practice, levels of depression in juveniles have been assessed mainly by way of self-reported, parent-reported and teacher-reported depression scales, such as the Beck Depression Inventory (BDI),19 the Center for Epidemiologic Studies Depression Scale (CES-D)20 ,21 and the Children's Depression Inventory (CDI).22 Each has a different rubric regarding levels or symptoms of depression. For instance, the traditional cut-off of the CES-D for indication of depression is 16; however, some have used 23 to indicate probable depression.23
The findings of studies examining the potential association between ST and risk of depression in juveniles have been inconsistent. Most studies reported a linear association of ST with depression; for example, while some reported a significant positive association between computer use and depression,24–26 others have suggested negative27 or null28 associations. These contradictions may be related to the use of different methodologies, including different measures and populations. In recent years, a growing number of studies24–26 ,29 ,30 have reported a non-linear association of ST in juveniles with depression. They found that groups which had excessive or no ST had a higher risk of depression level compared with the occasional or regular ST group, suggesting that appropriate ST may be associated with lower juveniles’ depression symptoms. Similar non-linear associations were found between electronic gaming and prosocial behaviour, life satisfaction and internalising and externalising problems.31 However, since different reference groups were used in these studies, it remains unclear for the definite appropriate ST for children and adolescents for preventing depression development.
Paediatricians’ ST recommendations are based largely on expert opinion or narrative reviews1 ,32 for general physical and mental health; evidence-based ST-related sedentary behaviour guidelines are lacking. A prior review of three studies9 summarised the association between screen-based sedentary behaviour and depression in adolescent girls, but did not include any quantitative assessments. A meta-analysis33 pooled estimation of association between sedentary behaviour and the risk of depression across all ages from 13 cross-sectional studies and 11 longitudinal studies, and found an increased risk of developing depression for the highest versus non-occasional/occasional sedentary behaviour (RR=1.25; 95% CI 1.16 to 1.35). However, there was no pooled estimation of association between ST and depression for children and adolescents or any other special ages. Also, there was no dose–response analysis to explore associations of different amount of ST with depression risk. Therefore, a more comprehensive meta-analysis is needed to clarify the dose–response association between ST in juveniles and depression risk to better elucidate the putative association.
We report a comprehensive systematic review and meta-analysis summarising all available evidence related to the association between ST and depression in juveniles. We conducted a meta-analysis of all observational studies to pool the risk of depression with ST in preadolescent children and adolescents, and quantified a dose–response association. Our primary hypothesis is that excessive ST is associated with a higher risk of depression in preadolescent children and adolescents, with a non-linear dose–response relationship. On the basis of the theory of sex differences in coping mechanisms when dealing with depression34 and the evidence that depression risk may increase with age,13 ,35 we hypothesised that gender and age would be moderating factors of this association.
Methods
We reported this systematic review and meta-analysis in accordance with the PRISMA guideline36 (see Research Checklist).
Search strategy.
The electronic databases of PubMed, Web of Science and EBSCO were searched systematically (up to 6 May 2015) without restricting the population, publication type or language. The following MeSH terms and their combinations were used in the search: sedentary behav*, screen time, sitting time, television view*, watching television, computer use, internet use, video game*, electronic game*, depress*, children, boy*, girl*, teen*, and adolescent*. The asterisk indicates that the search was inclusive of larger words that contained the word or word fragment. We also screened the bibliographies of retrieved articles to identify additional studies.
Inclusion and exclusion criteria
Studies were included if the following criteria were fulfilled: had an observational cross-sectional, case–control or longitudinal study design (including cohort design); reported correlation index of depression with ST (including television, computer/internet use, video games), such as OR, RR or correlation coefficients; participants’ average ages at the time when ST was measured were in the range of 5–18 years. Studies not meeting all inclusion criteria were excluded. Articles were also excluded if: they reported mixed sedentary behaviour, among which the association between ST and depression could not be separated; measurement of screen behaviour included other types besides ST (eg, special content such as violent video games). Two authors screened all titles and abstracts and then scrutinised potential eligible studies independently. If multiple articles reported the same research, the one with the most complete information was included.
Data extraction
Data and characteristics of included studies were extracted by two investigators independently using EpiData V.3.1 and Excel software. Any differences were resolved by discussion. Extracted characteristics included the first author's name, study design, country, publication year, study year, sample size, participants’ ages and genders, outcomes, duration of follow-up for prospective studies, number of cases (dose–response), type and level of ST, ST reference category, depression assessment, correlation index of depression with ST, and matched or adjusted covariates in the statistical analysis.
Quality assessment
We referenced the MOOSE37 and STROBE38 guidelines and conducted a systematic review of tools for assessing quality in observational studies in epidemiology.39 We used the following rubric for grading study quality: one point for appropriate selection of study participants; two points for proper measurements of ST and depression, respectively; one point for appropriate methods outlined to deal with any design-specific issues (recall bias, interviewer bias for cross-sectional studies and biased loss to follow-up for longitudinal studies); one point for methods of control of confounding and one point for appropriate statistical methods.
Statistical analyses
OR was used as a measurement of the association for the most included studies (10/16) that reported ORs with 95% CIs. The most appropriate adjusted effect sizes were used if available. We converted relevant data for studies not reporting the ORs and 95% CIs, with multiple methods. For one study24 that reported RR and 95% CI, we estimated OR from RR using the formula proposed by Zhang and Kai.40 For two studies41 ,42 that reported ORs with SEs or p values, we estimated 95% CIs from SEs or p value.43 For one cross-sectional study and three longitudinal studies27 ,44 ,45 that reported correlation coefficients, we converted the coefficients to ORs with 95% CIs.46 Finally, for one study that reported mean values with SEs, we converted them to Cohen's d value with the combined group of non-gamer and <1 h/day as the reference category; we then converted the values to an OR with 95% CI (see online supplementary file S1).46 Only one effect size was selected from each report to be pooled. When an individual study reported effect sizes based on multiple screen types, we combined effect sizes and used the overall datum for the pooling analysis. If applicable, the ORs were recalculated using the 0 h/day or occasional/day category as the reference category.47 One study48 used a reference group with an ST >2 h/day, and we recalculated the OR and 95% CI as inverses.46 The method proposed by Hamling et al49 was used to combine multiple categories’ effect sizes. Reports stratified by gender were treated as separate reports. We used a DerSimonian and Laird random-effects model to attain an overall OR and 95% CI because most of the studies included in this meta-analysis were not functionally identical.
Dose–response association was estimated by a generalised least squares trend estimation.47 ,50 Data were extracted from eligible studies that reported multiple levels of ST with corresponding ORs and 95% CIs, as well as distributions of cases and controls. Two studies25 ,29 reported only multiple levels of ST with distributions of cases and controls, and we computed unadjusted ORs and 95% CIs of their data based on the exposure distributions of cases and controls. The crude ORs reported in this meta-analysis are within 10% of the adjusted ORs, indicating that they are approximately equal.47 We then examined both linear and non-linear associations of ST with depression risk with a two-stage random-effects dose–response analysis.51 We tested the non-linear association by hypothesising that the coefficient of the second and the third splines were both equal to zero.
Heterogeneity between studies was evaluated with the Q statistic and quantified by I2. To test the robustness of the results, we performed sensitivity analyses. We also conducted subgroup analyses to explore the sources of the heterogeneity. On the basis of the literature, the following six potential moderators were examined: screen type, gender, age, population, reference category and study quality. Qbetween values of subgroups were calculated (Qtotal—Qwithin) and were tested for significance to determine group differences.46 Publication bias was detected by funnel plot asymmetry, and measured with Begg's52 and Egger's53 tests. Further adjustment for publication bias was evaluated by the trim and fill method if significant publication bias was found.54 Statistical significance was defined as p<0.05. Statistical analyses were performed with STATA V.12 software (StataCorp LP, College Station, Texas, USA).
Results
Characteristics of the included studies
Our comprehensive literature search and screen indicated that 16 studies (12 cross-sectional studies24–26 ,28–30 ,41 ,42 ,48 ,55–57 and 4 longitudinal studies,27 ,44 ,45 ,58 including 1 cohort study58), from a total of 21 reports, including a total of 127 714 participants (115 241 in cross-sectional studies and 12 473 in longitudinal studies), met our inclusion criteria (figure 1).

Flow chart of article screening process.
The characteristics of the included studies are summarised in online supplementary table S1 (see online supplementary table S1). The sample sizes varied widely across cross-sectional studies (from 160 to 75 066) and longitudinal studies (from 198 to 10 347). All of the studies involved both male and female participants; gender groups were analysed separately in five cross-sectional studies. The mean participant age was <14 years in six studies and >14 years in six studies; mean age was not reported in the four remaining studies. Four studies were conducted in Europe, five in North America, two in Australia and five in Asia.
Several reference categories were used in the 16 analysed studies. Four studies used 0 h/day or occasional as the reference category, three used 1 h/day (cumulative), four used 2 h/day (cumulative) and others analysed continuous ST. Three studies did not adjust for any covariates. Controlled factors included age (n=6), gender (n=7), grade (n=4), body mass index (n=2), socioeconomic status (n=5), parents’ education (n=4), race (n=2) and smoking (n=2). The average quality score of all included studies was 4.44, with nine studies obtaining a quality score ≥5 (see online supplementary table S2).
ST and depression risk
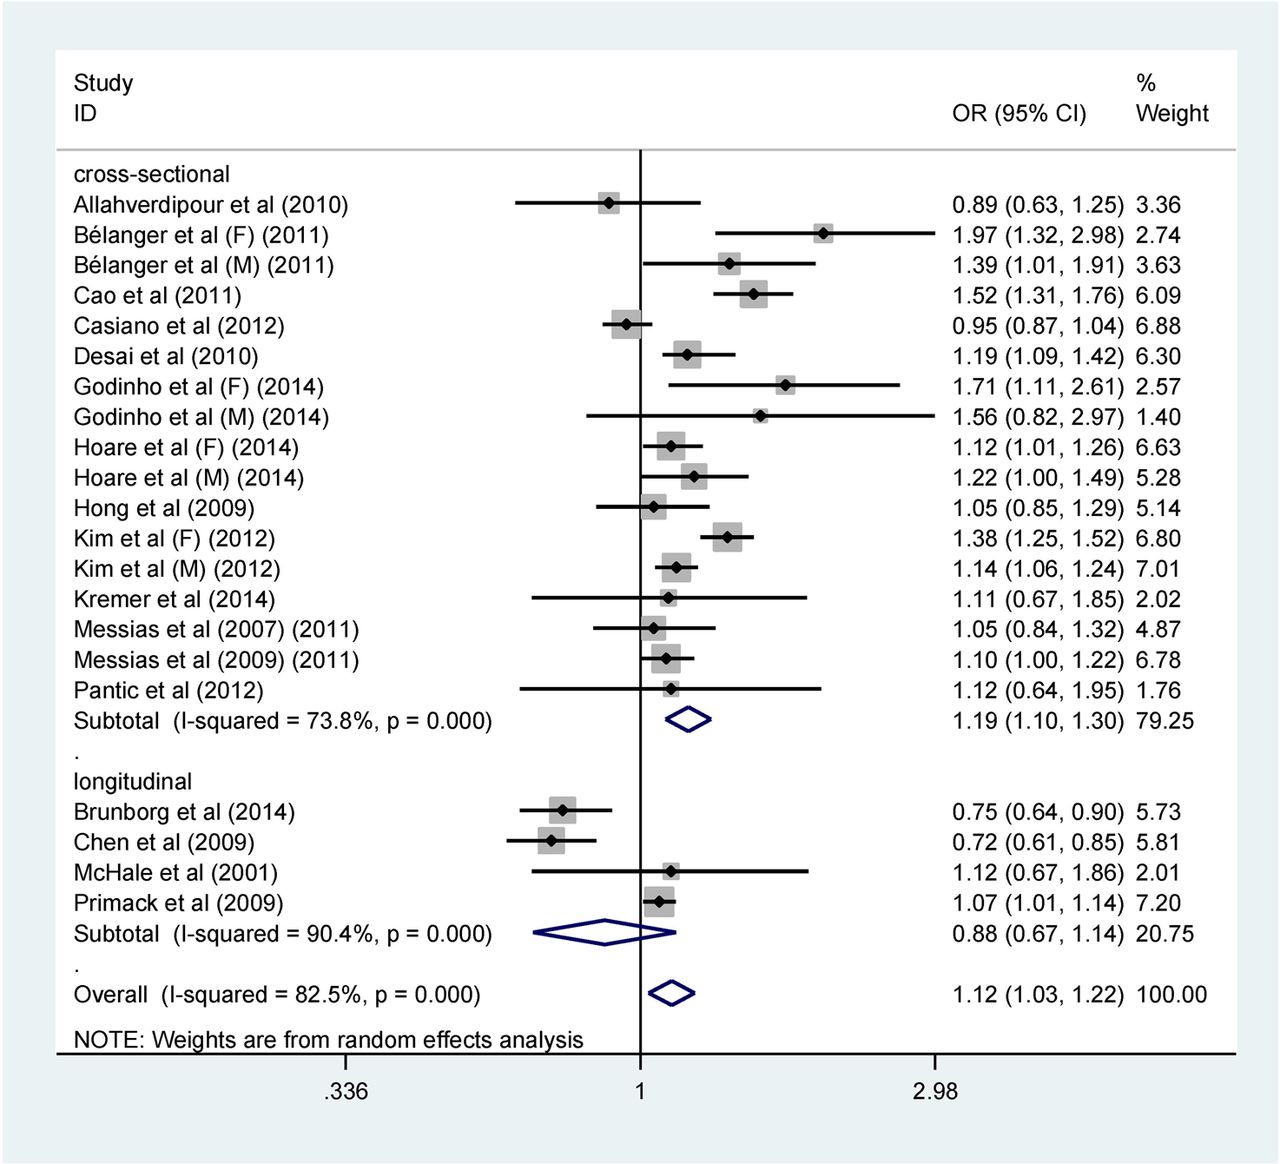
As presented in figure 2, the overall pooled OR was 1.12 (95% CI 1.03 to 1.22; p=0.007) with high heterogeneity (I2=82.5%). The combined OR was 1.19 (95% CI 1.10 to 1.30; p<0.001) for cross-sectional studies and 0.88 (95% CI 0.67 to 1.14; p=0.327) for longitudinal studies. Both study types had high heterogeneity (I2 of 73.8% and 90.4%, respectively).

Forest plot of the association between depression risk and screen time (hours/day) in children and adolescents by study design. OR of depression risk for higher daily screen time compared with reference groups and corresponding 95% CI (F, female; M, male).
Subgroup and sensitivity analyses
Subgroup analyses are shown in table 1. The association was moderated by age, population and reference group.
Moderation analyses for screen time-depression association
In sensitivity analyses in which studies were omitted one by one, no one study caused heterogeneity across the studies or influenced the results markedly (see online supplementary figure S1). There were no significant changes for results of overall studies and cross-sectional specific studies when the converted studies27 ,44 ,45 ,55 ,57 were excluded from analyses. For longitudinal studies, only one study with a significant effect size in the reverse direction remained (table 2).
Sensitivity analysis of screen time and risk of depression in juveniles
To identify the potential effects of adjusted variables on the association, we carried out several additional sensitivity analyses by excluding studies that did not adjust for any covariates, studies without any adjustment for family or socioeconomic status and studies without any adjustment for health risk behaviour, respectively. Only one sensitivity analysis of excluding studies that did not have any adjustment for family or socioeconomic status led to a significant change of effect size (OR from 0.88 to 1.07) in longitudinal studies (see table 2).
Publication bias
Begg's rank correlation test (p=0.487) and Egger's linear regression test (p=0.642) suggested that there was no significant publication bias (see online supplementary figure S2).
Dose–response association between ST and depression risk
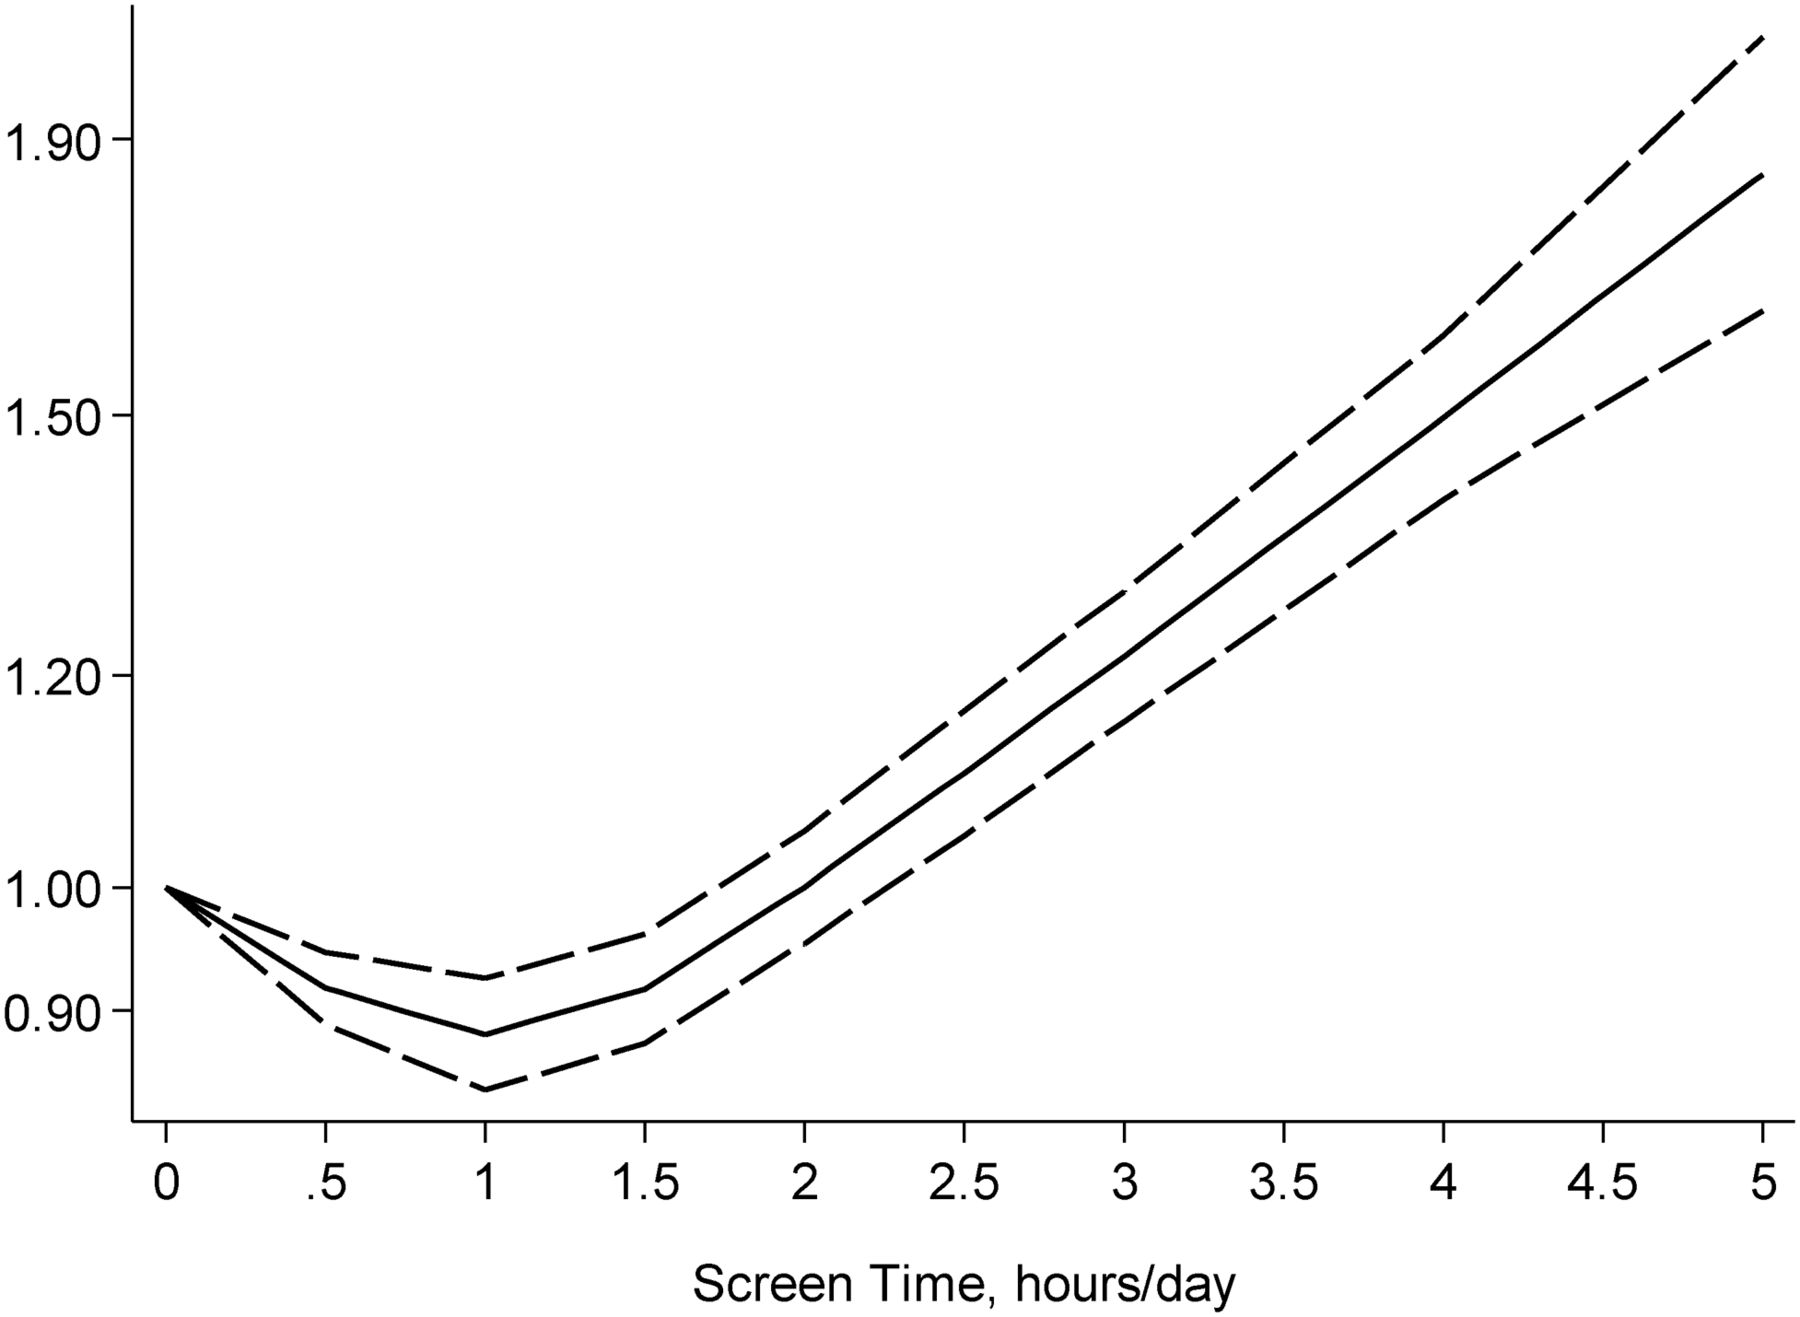
Four studies25 ,26 ,29 ,30 (7 reports) were used for the dose–response analysis. The analysis showed a curvilinear relationship between ST and risk of depression (p<0.001 for non-linearity; figure 3). There was a dose–response association of ST with a decreasing risk of depression when STs were <1 h/day further when ST were. Inversely, there was a continuously increasing risk of depression with increasing ST beyond 1 h/day. Compared with the reference group who had no ST, the estimated ORs of depression risk were 0.92 (95% CI 0.89 to 0.95) for 0.5 h/day of ST, 0.88 (95% CI 0.84 to 0.93) for 1 h/day, 0.91 (95% CI 0.87 to 0.96) for 1.5 h/day, 0.99 (95% CI 0.94 to 1.04) for 2 h/day, 1.08 (95% CI 1.03 to 1.14) for 2.5 h/day, 1.19 (95% CI 1.13 to 1.26) for 3 h/day, 1.46 (95% CI 1.36 to 1.57) for 4 h/day, and 1.80 (95% CI 1.60 to 2.02) for ≥5 h/day.

The dose–response relationship for the association between screen time in children and adolescents and risk of depression (solid line) as estimated by a generalised least squares trend estimation. Screen time was modelled with a restricted cubic spline in a two-stage random-effects dose–response model. The ORs are plotted on the log scale. Dashed lines represent the 95% CIs for the spline model. No screen time served as the referent category.
Time of television, video games, or computer use and depression risk
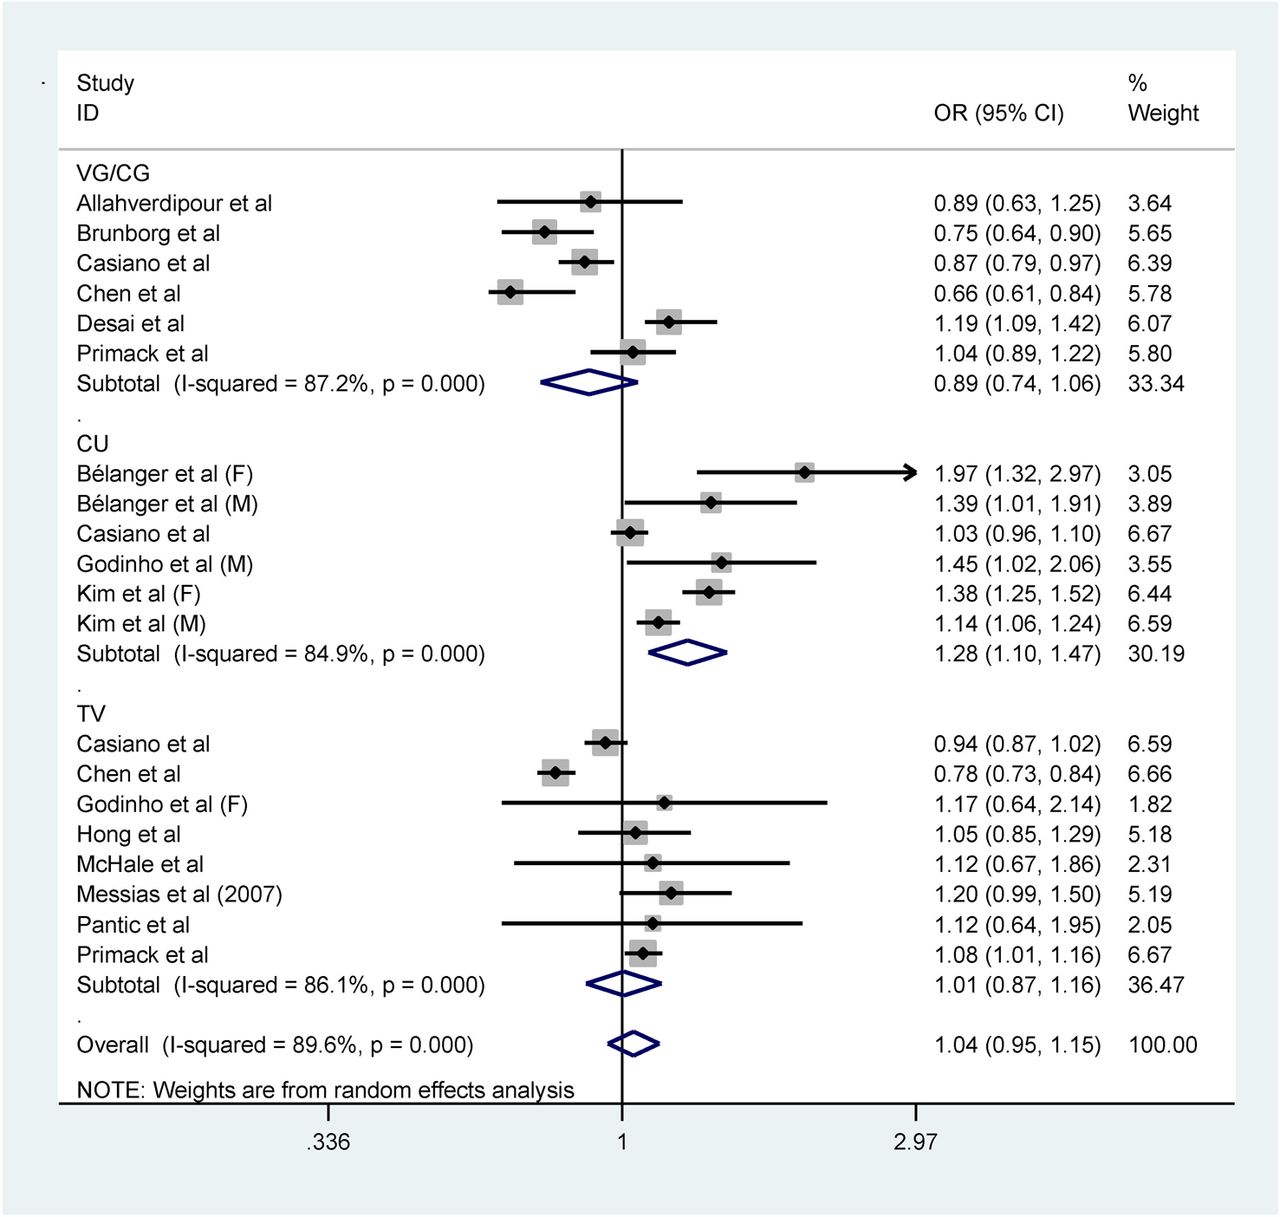
Thirteen studies (20 reports) demonstrated an association between time spent on watching television, playing video games or using a computer and depression risk (figure 4). The pooled OR estimates were 1.01 (95% CI 0.87 to 1.16) for watching television, 0.89 (95% CI 0.74 to 1.06) for playing video games and 1.28 (95% CI 1.10 to 1.47) for computer use. Significance tests of effect size showed that only computer use was related to depression risk (p=0.001). Heterogeneity of the association between computer time and depression risk was caused mostly by two large studies. When we omitted them,26 ,28 there was no heterogeneity for the pooled estimate effect (I2 from 82.8% to 0%). Exclusion of the two studies led to a higher effect size (OR=1.41; 95% CI 1.29 to 1.54). Heterogeneity of the association between television time and depression risk was caused mostly by one study. When we omitted this study,27 there was much less heterogeneity for the pooled estimate effect (I2 from 86.1% to 35.5%). Exclusion of this study led to an inverse effect size (OR=1.04; 95% CI 0.96 to 1.13). No study significantly caused heterogeneity in the video games group.

Forest plot of the association between depression risk and screen time (hours/day) in children and adolescents by screen type. OR of depression risk for higher daily screen time compared with reference groups and corresponding 95% CI (F, female; CU, computer/internet use; M, male; TV, television; VG/CG, video games/computer games).
Discussion
In the present meta-analysis, we quantitatively evaluated the association of ST with depression risk in preadolescent children and adolescents. Compared with the reference groups, those with more daily ST had a 12.3% increase in risk of depression. ST of approximately 1 h/day was associated with a reduced risk of depression, whereas beyond 2 h/day of ST, higher ST values were associated with a continuously increasing risk of depression. Compared with the reference group, those with 0.5, 1 and 1.5 h/day of ST had a 8%, 12% and 9% reduction in risk of depression, respectively, whereas those with 2 h/day of ST had an approximately equal risk of depression as those with no ST. Meanwhile, individuals with 2.5, 3, 4 or ≥5 h of ST per day had an 8%, 19%, 46% and 80% increased risk relative to no ST, respectively. These findings are consistent with the recommendations and guidelines of developed countries regarding limiting ST. Findings regarding the dose–response association provide a better clarification of the association between ST and depression risk, indicating that ST in moderation may actually be associated with lower depression.
It is worth noting that an insignificant reverse association with risk of depression was detected in longitudinal studies. However, when we excluded studies with no adjustment for family or socioeconomic status, two studies with high-quality scores suggested a significantly increased risk of depression (OR=1.07; 95% CI 1.01 to 1.14), with no heterogeneity. This relationship does not necessarily mean causality. There is also another possibility that previous depression state in juveniles lead to a different choose to ST. Only two longitudinal studies44 ,45 reported this association with reversed results (r, −0.07; r, 0.03). The currently available evidence is not sufficient yet to fully address the issue of reverse causality. Additional prospective studies are warranted.
Few studies have evaluated the association between ST and mental health.7 ,9 In a review of four studies, Temmel and Rhodes59 suggested that psychological factors such as depression were positively associated with ST. In another review of three studies involving adolescent girls, Costigan et al9 found a positive association between ST and depression, as well as a meta-analysis conducted by Zhai et al.33 The pooled risk of the included cross-sectional studies in our meta-analysis was largely consistent with these previous reviews, and the findings support the notion that excessive ST is associated with a higher risk of depression in preadolescent children and adolescents.
One interesting finding in this meta-analysis is that we detected a significant curvilinear dose–response association between ST and risk of depression. Typically, guidelines and recommendations32 ,60 emphasise an overall positive association between ST and morbidity risk. However, the present findings suggest that when ST is limited to 0–2 h/day, ST is associated with a lower risk of depression, and the lowest risk is detected at ST of 1 h/day. Such potential benefits32 could be related to screen behaviours enhancing children's ability to read and visualise images and, consequently, improving academic performance. Alternatively, kids may benefit psychologically from processing humorous content in television, the internet and video games.58 However, it is worth noting that the small size of the reference groups may be non-comparable in other ways and have caused a misleading non-linear dose–response curve. Our studies in dose–response analysis, however, ranged from 69 to 8102 in the reference groups. Still, there may be some other uncontrolled covariates which could influence the results. Follow-up dose–response studies with complete controlling for all relevant covariates are needed to clarify this question.
Relative to the other two screen types, those who reported spending more time on the computer had a 27.6% increase in risk of depression compared with the reference group. Potentially, this effect could be due to the relative openness of the computer content, especially the internet, compared to television and video games, if youth are being exposed more readily to negative information on their computers than they would otherwise encounter. Still, there may be a possibly significant difference in other covariates between the reference groups and the exposed groups influencing the results, for example, the size of the reference groups may be small and non-comparable in other ways. Not reporting the size of multiple levels of ST in some studies precluded us from clarifying this question.
In our meta-analysis, only the pooled estimate for boys was significant. However, there was no evidence of significant heterogeneity between the two groups. This result is not consistent with a previous study58 in which a significantly lower risk of developing depression was associated with greater total media exposure (including television, videocassettes, video games and radio) in young women. It is possible that computer use, which was not assessed in their study, may underlie the different outcomes of the two studies. Also, sample size as well as other covariates may explain this result. Further studies with appropriate adjustments are needed to clarify this issue.
We observed a significant ST-depression risk in teenagers <14 years, but not in those over 14 years. Compared with the reference group, teenagers <14 years with more ST per day had a 25% increased risk of depression. The result is consistent with a previous research48 which found a significant interaction effect of age group and ST on depression (OR=0.77; 95% CI, 0.59 to 0.99; reference, younger (10–11 years)), suggesting that higher ST was associated with higher depression risk and this was especially true for younger children. For having an inherent biological need, the younger children are more active.61 ST, however, may replace time participating in active activities,6 and thus may affect younger children more substantially. Besides, younger children have greater vulnerability to negative information from screen use, which also makes fewer opportunities for self-development and interpersonal communication,48 ,62 and thus may be more susceptible to depression.
Study population played a significant moderating role in the association between ST and depression risk. Only studies conducted in Australia demonstrated a significant correlation: those who spent more time on screen had a 14.2% increased risk of depression compared with the reference groups. No heterogeneity was found, which suggests that the result was robust in this group. After excluding one longitudinal Norwegian study,44 which reported correlation coefficients, there was a strong association between ST and depression risk for the European studies (OR=1.54; 95% CI 1.27 to 1.87) with no evidence of significant heterogeneity (I2=0%), suggesting that individuals in exposed groups have a 54.3% increase in risk of depression compared with reference individuals. No significant correlation was detected in North America and Asia. More studies that consider population effects are needed to clarify this issue.
After dividing the reference groups into four types, we found that relative to the <2 h/day reference group, exposed groups had a remarkable 33.4% (95% CI 1.13 to 1.57) increase in risk of depression. Conversely, a 21.3% (95% CI 0.67 to 0.92) reduction in risk of depression was found in studies reporting correlation coefficients, which indicates that conversion from a correlation coefficient to an OR may somehow transform the real association. Results from data converted from correlation coefficients should be interpreted with caution.
There was no association between ST and depression risk in studies using 0 h or <1 h/day as the reference category. This result is consistent with the curvilinear association of ST with depression risk in our dose–response analysis, indicating that the ST-depression risk association breaks at the 2 h/day cut-off. However, the non-significance may be caused by the smaller size of the reference groups, which made it non-comparable in other ways. Also, some other uncontrolled variables may influence the results. Further studies with proper controlling for relevant covariates are needed to clarify this issue.
In our meta-analysis, we quantified systematically the does–response association between ST and depression risk in preadolescent children and adolescents for the first time. The combined sample size was large. Our study supported that screen type, age, study population and reference group were potential sources of heterogeneity. The dose–response analysis showed a curvilinear association of ST with depression risk, which helped clarify the pattern of association.
Youth today are exposed to screen experience on a level never observed before. Greater efforts to disseminate information about the negative effects of too much ST in relation to risk of depression are needed to prevent negative public health outcomes of excessive ST. Such information can be distributed to parents directly or by way of educators and paediatricians. For countries or regions where screen use is not yet highly prevalent (eg, some developing countries), findings from this meta-analysis may provide a theoretical basis for development of policies or recommendations regarding appropriate ST for youth.
This study had several potential limitations. Owing to the nature of observational studies, it is difficult to exclude potential biases induced by other lifestyle factors.63 Although the data were adjusted for potential confounding variables in most of the included studies, such adjustments were variable across studies. Notably, most of the studies did not adjust for physical activity, even though physical activity has been shown to be a protective factor for mental health including depression.64 ,65 Although we performed several sensitivity analyses of excluding studies without adjustment for some important covariates, there may be other potential covariates that influenced the results, such as family history of mental illness including depression. Additionally, the measures of depression were not uniform across the studies, and not all of the included studies reported estimated effects of multiple differentiated ST, limiting a comprehensive analysis. Furthermore, some other new screen types were not included in our study, such as tablets and smartphones. Further studies are needed to answer this research question. Finally, the findings in this study should be interpreted with caution; however, since 1 h/day of ST may be associated with a lower risk of depression, ST may be still associated with other risks. Dose–response association analyses between ST and other physical and mental health outcomes, such as obesity, heart disease and cancer, are needed to clarify this issue.
Conclusion and practical implications
For preadolescents and adolescents, ST is associated with depression risk in a non-linear dose–response manner. ST is associated with a higher risk of depression when it exceeds 2 h/day, whereas less ST may be associated with a lower risk of depression, with the lowest risk being correlated with 1 h/day. Our study supports current recommendations of limiting ST to promote the health of children and adolescents.
What are the findings?
This is the first meta-analysis estimating the dose–response association of screen time and depression in children and adolescents.
The current meta-analyses suggested that screen time in children and adolescents was associated with depression in a non-linear dose–response manner.
Screen time is associated with a higher risk of depression when it exceeds 2 h/day, whereas lesser screen time may be associated with a lower risk of depression, with the lowest risk being 1 h/day.
How might it impact on clinical practice in the future?
Appropriate screen time in juveniles may be potentially beneficial for the primary prevention of depression. Further prospective studies are needed to confirm this finding.
Further research should assess the potential influence of relevant covariates on the association between screen time in juveniles and depression risk, such as physical activity and family history of mental illness.
Further prospective studies are needed to explore whether there exists mutual causality between screen time and depression.
References
Supplementary materials
Supplementary Data
This web only file has been produced by the BMJ Publishing Group from an electronic file supplied by the author(s) and has not been edited for content.
- Data supplement 1 - Online supplement
- Data supplement 2 - Online figure S1
- Data supplement 3 - Online figure S2
- Data supplement 4 - Online table S1
- Data supplement 5 - Online table S2
Footnotes
Contributors ML and SY contributed to the conception and design. ML and LW were involved in the data analysis and all the authors interpreted the results. ML drafted the manuscript, which was revised by LW and SY. All the authors approved the version to be published.
Funding This research received no specific grant from any funding agency in the public, commercial or not-for-profit sectors.
Competing interests None declared.
Provenance and peer review Not commissioned; externally peer reviewed.