Article Text

Abstract
The aim of this study was to determine the precise effect of plyometric training (PT) on vertical jump height in healthy individuals. Meta-analyses of randomised and non-randomised controlled trials that evaluated the effect of PT on four typical vertical jump height tests were carried out: squat jump (SJ); countermovement jump (CMJ); countermovement jump with the arm swing (CMJA); and drop jump (DJ). Studies were identified by computerised and manual searches of the literature. Data on changes in jump height for the plyometric and control groups were extracted and statistically pooled in a meta-analysis, separately for each type of jump. A total of 26 studies yielding 13 data points for SJ, 19 data points for CMJ, 14 data points for CMJA and 7 data points for DJ met the initial inclusion criteria. The pooled estimate of the effect of PT on vertical jump height was 4.7% (95% CI 1.8 to 7.6%), 8.7% (95% CI 7.0 to 10.4%), 7.5% (95% CI 4.2 to 10.8%) and 4.7% (95% CI 0.8 to 8.6%) for the SJ, CMJ, CMJA and DJ, respectively. When expressed in standardised units (ie, effect sizes), the effect of PT on vertical jump height was 0.44 (95% CI 0.15 to 0.72), 0.88 (95% CI 0.64 to 1.11), 0.74 (95% CI 0.47 to 1.02) and 0.62 (95% CI 0.18 to 1.05) for the SJ, CMJ, CMJA and DJ, respectively. PT provides a statistically significant and practically relevant improvement in vertical jump height with the mean effect ranging from 4.7% (SJ and DJ), over 7.5% (CMJA) to 8.7% (CMJ). These results justify the application of PT for the purpose of development of vertical jump performance in healthy individuals.
- CMJ, countermovement jump
- CMJA, countermovement jump with the arm swing
- DJ, drop jump
- ES, effect size
- PT, plyometric training
- SJ, squat jump
- SSC, stretch-shortening cycle
- Δtot, effect of PT on vertical jump height
Statistics from Altmetric.com
- CMJ, countermovement jump
- CMJA, countermovement jump with the arm swing
- DJ, drop jump
- ES, effect size
- PT, plyometric training
- SJ, squat jump
- SSC, stretch-shortening cycle
- Δtot, effect of PT on vertical jump height
Leg muscle power in general, and vertical jump performance in particular, are considered as critical elements for successful athletic performance,1–3 as well as for carrying out daily activities and occupational tasks.4,5 Much research has been focused on the development of vertical jump performance. Although various training methods, including heavy-resistance training,6,7 explosive-type resistance training,7,8 electrostimulation training9 and vibration training,10 have been effectively used for the enhancement of vertical jump performance, most coaches and researchers seem to agree that plyometric training (PT) is a method of choice when aiming to improve vertical jump ability and leg muscle power.11–14
PT refers to performance of stretch-shortening cycle (SSC) movements that involve a high-intensity eccentric contraction immediately after a rapid and powerful concentric contraction.15 For the lower body, PT includes performance of various types of body weight jumping-type exercise, like drop jumps (DJs), countermovement jumps (CMJs), alternate-leg bounding, hopping and other SSC jumping exercises.16 Effects of PT on vertical jump performance have been extensively studied. Numerous studies on PT have demonstrated improvements in the vertical jump height.6–8,14,15,17–29 In contrast, a number of authors failed to report significant positive effects of PT on vertical jump height,1,14,30–34 and some of them even reported negative effects.35 Thus, at present, definitive conclusions regarding the effects of PT on vertical jump performance cannot be drawn.
Several factors, including training programme design (type of exercises used, training duration, training frequency, volume and intensity of training), subject characteristics (age, gender, fitness level) and methods of testing different types of vertical jumps may be responsible for the discrepancy among PT literature. However, potentially the most important factor responsible for the observed conflicting findings is the sample size used in training interventions. For example, it is well known that sample size influences the power to detect real and significant effects.36 The typical sample size in almost all previous studies on PT ranged between 8 and 12 subjects per group, meaning that, by using statistical power of 80% and an αlevel of 0.05, these studies could detect only effect sizes (ESs) ⩾1.2.36 Evidently, most PT studies had insufficient statistical power to detect not only small to moderate, but even large treatment effects.
One method that allows us to overcome the problem of small sample size and low statistical power is the meta-analysis. Meta-analysis is a quantitative approach in which individual study findings addressing a common problem are statistically integrated and analysed.37 As meta-analysis effectively increases overall sample size, it can provide a more precise estimate of effect of PT on vertical jump height. In addition, meta-analysis can account for the factors partly responsible for the variability in treatment effects observed among different training studies (see previous text). Given the general importance of vertical jump ability in athletic performance,1–3 and in assessment of human muscle power capabilities,1,38,39 as well as general popularity of PT among coaches and athletes,11–13 it would be of both scientific and practical relevance to determine a precise estimate of the effect of PT on vertical jump ability. Thus the purpose of this study was to use the meta-analytical approach to examine the effects of PT on vertical jump height, with special reference to the type of vertical jump test used. We also seek to understand whether these effects were specific with respect to the subject characteristics and the training programme applied.
METHODS
Literature search and study selection
The following databases were searched using CSA Ilumina search engine: MEDLINE (1966–Sep 2006), ERIC (1966–Sep 2006), Physical Education Index (1970–Sep 2006) and PsychINFO (1960–Sep 2006). We used the following combination of search terms and Booleans: plyometric OR pliometric OR stretch-shortening cycle OR drop jump OR depth jump OR jump training AND controlled trials. In addition, manual searches of relevant journals and reference lists obtained from articles were conducted. The present meta-analysis includes studies published in journals that have presented original research data on healthy human subjects. No age, gender or language restrictions were imposed at the search stage. Abstracts and unpublished theses/dissertations were excluded from this analysis due to lack of methodological details. Inclusion criteria applied in this study were as follows: (1) randomised and non-randomised trials that included a comparable control group; (2) land-based PT studies which lasted ⩾4 weeks; (3) studies that used vertical jump height as a dependent variable; and (4) studies published in peer-reviewed journals. Online searches of the included databases yielded 437 citations; 96 of these were eliminated as duplicate references. An inspection of the remaining titles and abstracts identified 58 published investigations that applied a lower-body PT in healthy individuals. Eight additional articles were found by manual searches of the journals. A detailed inspection of these 66 articles revealed 50 articles that evaluated the effects of PT on vertical jump height. Hand searches of reference lists of the retrieved articles and two reviews3,40 resulted in the inclusion of an additional five articles. We also included our recent original article currently in press in a peer-reviewed journal.14 Of the selected 56 articles that evaluated the effects of PT on vertical jump height, 27 (one published in non-English language29) met our inclusion criteria. Numerous studies were excluded on the grounds of having no control group.2,15,35,41–48 Some studies were excluded as they combined PT intervention with other types of strength training like weight training,49–60 sprint training61 or electrostimulation training.62 One study was excluded as it studied the effects of aquatic PT.63 Finally, three studies were excluded because of insufficient data to calculate magnitude of the mean effect.8,34,64 Four publications met our inclusion criteria but failed to report changes in vertical jump height (the authors reported changes in muscle power estimated from jump height and body mass).1,32,65,66 In these cases, a personal contact was made with the authors to retrieve appropriate information for vertical jump height. However, the authors of one study did not respond to our request, therefore we excluded this article from our analyses.65
Coding and classifying variables
Each of the studies that met our inclusion criteria was recorded on a coding sheet. The major categories coded included (1) study characteristics, (2) subject characteristics, (3) training programme characteristics and (4) primary outcome characteristics. The study characteristics that were coded for included author(s) name, year of publication and the number of subjects. Subject characteristics that were coded for included age, gender and fitness level. Gender was coded as a variable representing the proportion of men in the sample (eg, 1 for all men; 0.5 for five women and 5 men; 0 for all women). Fitness level was coded as “non-athletes” (all the subjects in this group were recreationally trained) and “athletes” (competitive level). Training programme characteristics (PT groups only) that were coded for included duration of the training programme (ie, number of weeks), total number of training sessions, total number of foot contacts performed during the whole training period and type of training applied (DJ training, CMJ training or versatile jump training that included various body weight jumping drills). Finally, primary outcome characteristics that were coded included four types of vertical jump height tests commonly used in studies on PT: concentric-only squat jump (SJ), slow SSC CMJ, fast SSC DJ and standard countermovement vertical jump with the arm swing (CMJA). Mean (SD) for the primary outcomes in both plyometric and control groups, both before and after treatment, were extracted. In two cases, where the authors reported mean (SD) using figures rather than numeric values,25,30 the authors were personally contacted to retrieve appropriate information for vertical jump height. Separate meta-analysis was performed for each vertical jump test.
Quality assessment
The PEDro Scale was used to assess methodological quality of the studies.67 It is an 11-item scale designed for rating methodological quality of randomised controlled trials. The answer to each criterion is a simple yes/no and each satisfied item (except for item 1) contributes one point to the total PEDro Score (range: 0–10 points). The scale items are:
1. Eligibility criteria were specified.
2. Subjects were randomly allocated to groups (in a crossover study, subjects were randomly allocated an order in which treatments were received).
3. Allocation was concealed.
4. The groups were similar at baseline with respect to the most important prognostic indicators.
5. There was blinding of all subjects.
6. There was blinding of all therapists who administered the treatment.
7. There was blinding of all assessors who measured at least one key outcome.
8. Measurements of at least one key outcome were obtained from more than 85% of the subjects initially allocated to groups.
9. All subjects for whom the outcome measurements were available received the treatment or control condition as allocated, or where this was not the case, data for at least one key outcome were analysed by “intention to treat”.
10. The results of between-group statistical comparisons are reported for at least one key outcome.
11. The study provides both point measurements and measurements of variability for at least one key outcome.
Statistical analysis
The size of the effect of PT on vertical jump height (Δtot) is given by the difference between the mean change in jump height of subjects in the plyometric group (Δplyo) and the control group (Δcon). We used two approaches for pooling the data across studies. In the first approach, we expressed Δtot relative to the mean value of the control group—that is, in percentage values. In the second approach, we expressed the effect in standardised units quantified by calculating an ES. The ESs were calculated by dividing Δtot (ie, Δplyo−Δcon) by the pooled SD of the change scores of the plyometric and control groups. This approach was adopted as some authors reported marked differences in the mean vertical jump height between the plyometric group and the control group at baseline.19,24,25,31,68 For the studies that did not report SD of the change scores, these were estimated from the SDs extracted before and after training by assuming a correlation of 0.75 between measures taken before and after training (details are given in Higgins and Green69). The correlation of 0.75 was selected on the basis of the findings of Adams34 who showed, on six independent and relatively large subject samples, that the correlation between jump heights measured before and after 7 weeks of PT is mainly >0.75. This was further verified by calculating the correlation between jump heights before and after training for the 16 studies included in our analyses that reported SD for change scores.69 Median correlation of 0.81 and 0.84 was obtained for the plyometric and control groups, respectively. Thus, we believe that the selected correlation coefficient of 0.75 can be considered appropriate. The calculated ESs were then corrected for small-sample bias.37 According to Cohen,36 an ES of 0.2 is considered as a small effect, 0.5 as a moderate effect and 0.8 as a large effect.
Heterogeneity of effects for each vertical jump height test was assessed by using the quantity I2, as suggested by Higgins et al.70 In brief, I2 was calculated as follows: I2 = 100% · (Q–df)/Q, where Q is Cochran’s χ2 heterogeneity statistic and df the degrees of freedom. The Cochran’s Q is calculated by summing the squared deviations of each trial’s estimate from the overall meta-analytical estimate. I2 describes the percentage of variability in point estimates which is due to heterogeneity rather than sampling error. I2 values of 25%, 50% and 75% represent low, moderate and high statistical heterogeneity, respectively.70 Although the heterogeneity of effects in our meta-analyses ranged from 0% to 33% (see Results section), we decided to apply a random-effects model of meta-analysis in all the cases. To test the robustness of these analyses, we also calculated and reported a fixed-effects model.
Publication bias, as well as evidence of outliers, was examined by funnel plots of the SEs of the estimate of the effect versus calculated ESs. Subsequently, three studies (two studies for the DJ and one study for the SJ) were excluded from the meta-analyses owing to unrealistically large positive effects (table 1). In addition, publication bias was also statistically evaluated by calculating rank correlations between effect estimates and their SEs (ie, Kendall’s τ statistic71). A significant result (p<0.05) was considered to be suggestive of publication bias.
Chronological summary of investigations included in the meta-analyses of effects of plyometric training on vertical jump height
It should also be noted that some studies reported >1 primary outcome owing to >1 plyometric groups and/or vertical jump tests measured. We treated these outcomes as independent data points. However, to examine the influence (sensitivity) of each study on the overall results, analyses were performed with each study deleted from the model. If the effect and CIs in the sensitivity analysis lead to the same conclusion as the primary meta-analysis value, the results are considered robust.
Subgroup analyses for each primary outcome included both subject’s fitness level (non-athletes vs athletes) and type of training programme applied (three different types of PT programmes), and were performed using analysis of variance-like procedures for meta-analysis.37 Meta-regression was used for analysing the relationship between the ES and the selected subject or training characteristics: subject’s age, gender, duration of the training period, number of training sessions and number of foot contacts. Finally, pooled estimates were statistically compared by comparing the overlap of their CIs. The level of significance was set to p<0.05.
RESULTS
Descriptive statistics
Altogether, 26 published investigations were included in the meta-analyses. In all, 15 of the 26 investigations provided ⩾2 primary outcomes (through multiple treatment groups and/or >1 vertical jump height tests) giving 13 ESs for the SJ, 19 ESs for the CMJ, 14 ESs for the CMJA and 7 ESs for the DJ. Table 1 summarises the characteristics of the included studies. Note that three ESs (one for the SJ and two for the DJ; table 1) from two studies were excluded from the meta-analyses owing to unrealistically large positive effects. Altogether, 1024 subjects (849 males and 175 females, or 83% males vs 17% females) were included in the meta-analyses. When distributed over particular primary outcomes, this number was 253 subjects for SJ, 405 subjects for CMJ, 297 subjects for CMJA and 69 subjects for DJ. The average sample size per group was 11 (range: 5–33) subjects. Mean age of the subjects included in this study ranged from 11 to 29 years, with ∼55% of the subjects being aged between 20 and 22 years.
Studies included in the meta-analyses had an intervention duration ranging from 4 to 24 weeks, a total number of training sessions ranging from 12 to 60 and a total number of foot contacts ranging from 468 to 7500.
Methodological quality
The median PEDro Quality Score assessing methodological quality of the included studies was 5 out of 10 (range 3–5; table 1). The results of PEDro Scale showed that two studies18,66 failed to randomise the subjects into groups. Note, however, that all studies failed to satisfy the following five methodological criteria: treatment allocation concealment, blinding of all subjects; blinding of all therapists, blinding of all assessors; and intention to treat analyses (ie, items 3, 5, 6, 7 and 9, respectively).
Primary outcomes
Table 1 reports the individual percentage and changes in ES in the primary outcomes and summarises the pooled estimates of the effects of PT on vertical jump height.
Squat jump
For the SJ, pooled estimate of the effect of PT was 4.7% (95% CI 1.8 to 7.6%). When expressed in standardised units, this effect was rather small (ES = 0.44, 95% CI 0.15 to 0.72). A somewhat higher pooled estimate was observed when a fixed-effect model was used (ES = 0.47, 95% CI 0.21 to 0.72). The statistical heterogeneity of effects of PT on the SJ was moderate (I2 = 33%). When each study was removed from the model once, the ES ranged from 0.35 (95% CI 0.10 to 0.62) to 0.55 (95% CI 0.31 to 0.80). Both funnel plot and Kendall’s τ statistic (r = 0.05; p = 0.86) showed no evidence of publication bias for the SJ.
Countermovement jump
Pooled estimate of the effect of PT on CMJ was 8.7% (95% CI 7.0 to 10.4%). Expressing the data as ES indicated the large effect (ES = 0.88, 95% CI: 0.64 to 1.11). Almost identical pooled estimate was obtained with a fixed-effect model (ES = 0.87, 95% CI 0.67 to 1.06). We also observed low statistical heterogeneity of effects for the CMJ (I2 = 11.4%). Finally, when each study was removed from the model once, the ES ranged from 0.83 (95% CI 0.63 to 1.03) to 0.89 (95% CI 0.69 to 1.09). Note, however, that an inspection of the funnel plot as well as Kendall’s τ statistic (r = 0.42; p = 0.012) suggest the presence of publication bias in the CMJ.
Countermovement jump with the arm swing
Overall, PT resulted in improvement in the CMJA of 7.5% (95% CI 4.2 to 10.8%). Pooled ES value of 0.74 (95% CI 0.47 to 1.02) suggests that this effect was moderate to large. A somewhat lower pooled estimate was observed when a fixed-effect model was used (ES = 0.71, 95% CI 0.49 to 0.93). Heterogeneity of effect for the CMJA was moderate (I2 = 29.6%). When each study was removed from the model once, changes in ES ranged from 0.67 (95% CI 0.42 to 0.93) to 0.79 (95% CI 0.51 to 1.08). Similar to the CMJ, both funnel plot and Kendall’s τ statistic (r = 0.49; p = 0.016) suggest the presence of publication bias in the CMJA.
Drop jump
For the DJ, pooled estimate of the effect of PT was 4.7% (95% CI 0.8 to 8.6%), similar to the one observed for the SJ. Expressing the data as ES indicated moderate effect (ES = 0.62) with relatively large CI (95% CI 0.18 to 1.05) probably owing to the small number of studies analysed. Identical pooled estimate was obtained with a fixed-effect model (ES = 0.62, 95% CI 0.18 to 1.05). This is not surprising, as the heterogeneity measure I2 was equal to zero. When each study was removed from the model once, changes in ES ranged from 0.57 (95% CI 0.09 to 1.09) to 0.66 (95% CI 0.18 to 1.14). No qualitative (funnel plot) or quantitative (r = 0.18; p = 0.82) evidence of publication bias was found in the DJ.
There were no significant differences in the pooled effects between four vertical jump tests. However, it should be stressed that the effect of PT was nearly twice as high in the CMJ than that in the SJ.
Subgroup analyses
No significant differences in the ES (all p>0.05) were found between non-athletes and athletes for each of the four vertical jumps. Moreover, there were no significant differences (all p>0.05) in treatment effects between different PT programmes.
Meta regressions
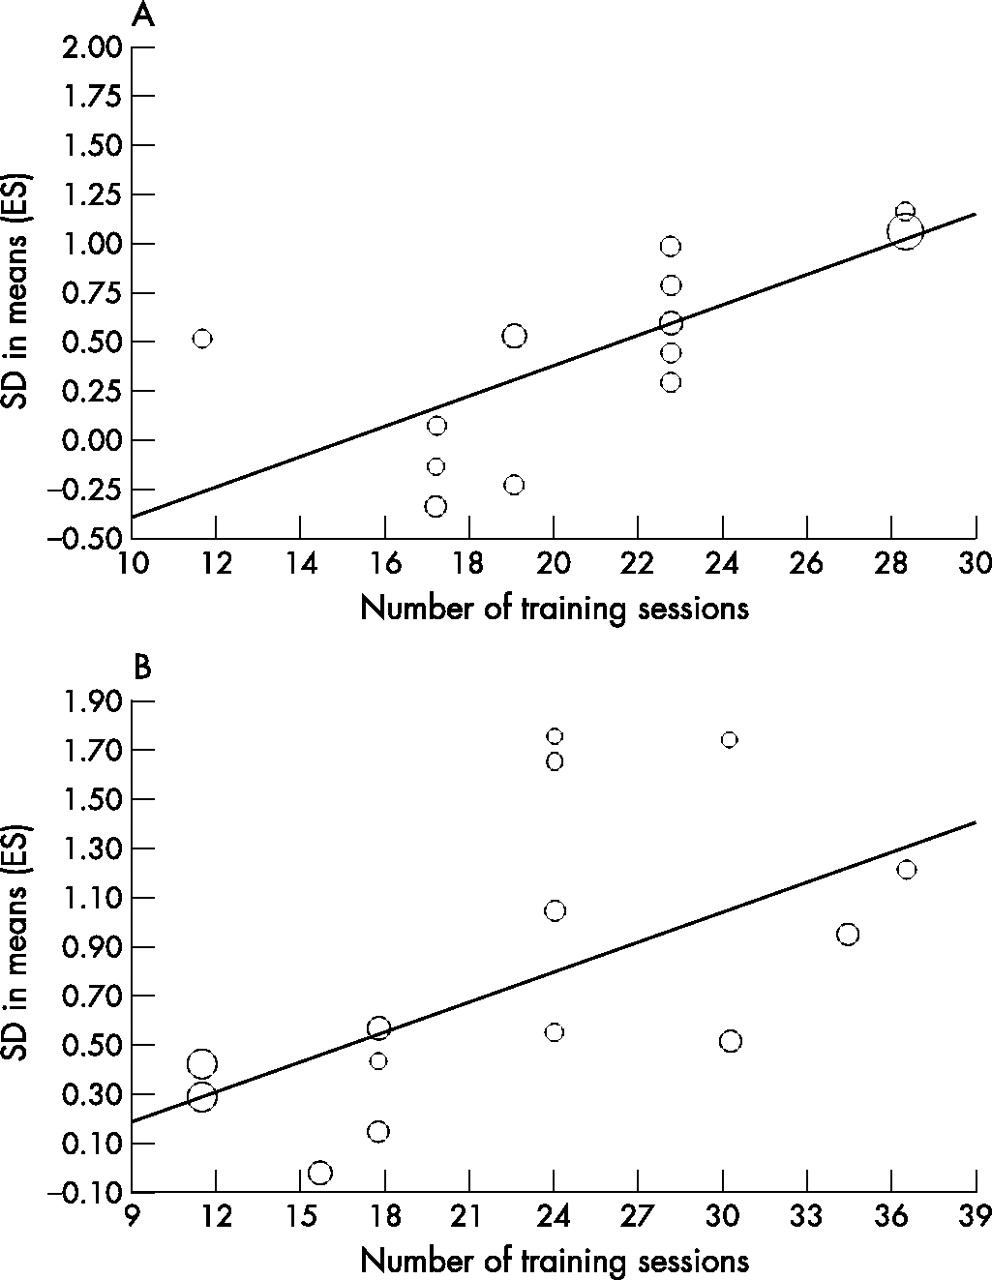
A significant positive relationship was found between the total number of training sessions and the ES in SJ (p = 0.002; fig 1A) and CMJA (p = 0.004; fig 1B). In all the remaining metaregressions, no significant relationships were observed (all p>0.05).
Relationship between the effect size (ES) and the total number of training sessions in (A) the squat jump and (B) countermovement jump with the arm swingimg. The size of each circle is inversely proportional to the variance of the estimated ES. Std diff in means, standardised mean difference for ES.
DISCUSSION
This study uses a meta-analytical approach and provides a precise estimate of the effect of PT on vertical jump height based on a significant sample size, which, otherwise, may be difficult to achieve in individual studies. The overall results of this study suggest that the PT significantly improves vertical jump height and that the mean effect ranges from 4.7% (ES = 0.44; ie, small effect) to 8.7% (ES = 0.88; ie, large effect) depending on the type of vertical jump measured. There was very low to moderate heterogeneity of effects within each meta-analysis, suggesting that all trials examined the same effect. Moreover, sensitivity analyses using (1) a fixed-effects model, and (2) excluding each study from the model once, did not substantially change the mean effects or their CIs, providing evidence that the results of the meta-analyses were robust. Note, however, that we observed a publication bias in two primary outcomes (ie, CMJ and CMJA). As we meta-analysed only PT studies published in peer-reviewed journals, there is a likelihood that some smaller studies without significant effects remain unpublished. Therefore, some caution is warranted regarding the precise estimates of the effects of PT on jump height in these two vertical jumps.
Besides being statistically significant, the estimated improvements in vertical jump height as a result of PT could also be considered as practically relevant—for example, an improvement in vertical jump height of ∼5–10% (ie, ∼2–6 cm, depending on the type of vertical jump) could be of high importance for trained athletes in sports relying on jumping performance, like basketball, volleyball and high jump. In addition, several studies on PT have demonstrated that a significant increase in vertical jump height of ∼10% was accompanied with similar increase in sport-specific jumping,3,51 cycling,25 sprinting17,25,26,51 and distance-running performance.24 Despite some exceptions,7,14 these data suggest that there may be a positive transfer of the effects of PT on vertical jump ability to other athletic performance. From the perspective of the above-discussed results, PT could well be recommended for healthy individuals aiming to improve not only their vertical jumping ability, but also other athletic performance.
The specific effects of PT on jump height in different types of vertical jumps could be of particular importance. It has been suggested that PT is more effective in improving vertical jump performance in the SSC jumps as it enhances the ability of subjects to use the elastic and neural benefits of the SSC.7 The results of this study only partly support these suggestions. Specifically, our data indicate that PT produces somewhat greater (although not significantly) positive effects in the slow SSC jumps (particularly the CMJ) than in the concentric-only jumps (ie, SJ), or even fast SSC jumps (ie, DJ). Keeping the specificity of contraction-type training in mind (ie, SSC muscle function), greater positive effects of PT on the CMJ than on the SJ can be expected. However, to explain the observed difference in the effects of PT between the CMJ and the DJ, we should also take into account biomechanical differences between slow and fast SSC jumping exercises.3 In particular, several authors3,75,76 have showed that there exists a substantial difference in the mechanical output and jumping performance between slow SSC (large-amplitude movement) vertical jumps like CMJ and countermovement drop jump, and fast SSC (small-amplitude movement) vertical jumps like a bounce drop jump. Hence they concluded that jumping technique (ie, movement amplitude and ground-contact time) represents one of the most important factors to be considered when designing PT programmes. Unfortunately, in many of the studies included in this review, the researchers did not consider the above-mentioned factors when describing their PT programmes. This particularly applies for studies that applied DJ as the training stimulus. Consequently, it remains unclear whether jumping technique is responsible for somewhat greater gains in jump height observed in the CMJ compared with the DJ. Taken together, our results indicate that slow SSC jumps are likely to benefit more from PT than either concentric (SJ) or fast SSC jumps (DJ). However, additional well-designed studies are needed before we can draw any firm conclusions on this issue.
What is already known on this topic
-
Plyometric training (PT) has been extensively used for augmenting jumping performance in healthy individuals
-
Most of the previous research studies have shown that PT is able to improve the vertical jump height in healthy individuals, but the specific effects of PT on jump height in different types of vertical jumps remain unknown.
What this study adds
-
This is the first meta-analytical review of the sudies on plyometric training (PT) that provides precise estimates of the magnitude of effects of PT on different types of vertical jumps.
-
We demonstrate that PT provides both statistically significant and practically relevant improvement in vertical jump height with the mean effect ranging from 4.7% (squat jump (SJ) and drop jump (DJ)), over 7.5% (countermovement jump with the arm swing (CMJA)) to 8.7% (countermovement jump (CMJ)).
-
Our results also suggest that the effects of PT are likely to be higher in slow stretch-shortening cycle (SSC) vertical jumps (CMJ and CMJA) rather than in either concentric (SJ) or fast SSC jumps (DJ).
In the present study, two subgroup analyses and several metaregressions were also performed for each primary outcome. We found no significant difference in the effects of PT on jump height between athletes and non-athletes; however, this finding is probably the result of an insufficient number of studies on PT that were performed on athletes (table 1). Another set of subgroup analyses showed that three different PT programmes produced similar effects on jump height in each of the four vertical jumps. These results should be, however, viewed with caution owing to the already mentioned failure of many researchers to control jumping technique of plyometric exercises. Finally, the applied metaregressions revealed a significant positive association between the total number of training sessions and the ES values in SJ and CMJA, respectively. Note that these two primary outcomes also had a moderate heterogeneity of effects, part of which could be explained by the total number of training sessions.
The results of this investigation support previous narrative reviews3,40 that concluded that PT is effective in improving vertical jump ability. However, this study offers robust quantitative evidence to this conclusion, together with a precise estimate of the effect of PT on jump height in particular types of vertical jumps. Although the results of this review provide some valuable information, certain potential limitations of this study should be outlined. First, the PEDro Scores of the studies included in the meta-analyses suggest that most studies could be classified as low-quality studies. However, we should bear in mind that blinding of participants and therapists is impossible in exercise interventions. If these two items were deleted from the PEDro Scale, quality ratings of all included studies would have changed substantially. Nonetheless, it is recommended that the future studies on PT have to improve their quality by blinding the assessors, as well as by ensuring that treatment allocation concealment and intention to treat analyses are performed.
Another potential limitation of this study is related to the observed publication bias in the CMJ and CMJA. We therefore acknowledge the possibility that a precise effect of PT on these two vertical jumps could be somewhat smaller than that estimated in our study. Finally, a potential weakness of this investigation was the small number of ES available for some subgroup analyses (eg, athletes vs non-athletes) and metaregressions (eg, age, gender). This prevented us from generalising the effects of subjects and/or training characteristics.
In conclusion, the present study demonstrates that PT significantly improves vertical jump height in all four types of standard vertical jumps. The observed mean effect in jump height ranged between 4.7% and 8.7% and could also be considered as practically relevant. From this perspective, PT can be recommended as an effective form of physical conditioning for augmenting the vertical jump performance of healthy individuals.
Acknowledgments
I thank Professor Slobodan Jaric for his helpful comments on a draft of the manuscript. The study was supported in part by the grant from Croatian Ministry of Science, Education and Sport (034-0342607-2623) and from Croatian National Science Foundation postdoctoral fellowship to GM.
REFERENCES
Commentary
Meta-analyses such as this are useful as they combine the efforts of many researchers and projects to provide greater insight into the research problem. Given the widespread application of plyometric training, it is important to know that, on balance, the research supports the efficacy of plyometric training for the improvement of jumping performance.
Footnotes
-
Published Online First 8 March 2007
-
Competing interests: None.