Article Text

Abstract
Background Adolescence is a recognised period of physical activity decline, particularly among low-income communities. We report the 12-month (midpoint) effects of a 2-year multicomponent physical activity intervention implemented in disadvantaged secondary schools.
Methods A cluster randomised trial was undertaken in 10 secondary schools located in disadvantaged areas in New South Wales, Australia. Students in Grade 7 were recruited, with follow-up in Grade 8. The intervention was guided by socioecological theory and included seven physical activity strategies, and six implementation adoption strategies. The primary outcome was mean minutes of moderate-to-vigorous physical activity (MVPA) per day assessed using Actigraph GT3X accelerometers. Outcome data were analysed using repeated measures linear mixed models.
Results At baseline, 1150 (93%) students participated in the data collection (mean age 12 years, 48% boys) and 1050 (79%) students participated at 12-month follow-up. By the 12-month follow-up, the six implementation adoption strategies had been used to support schools to deliver four of the seven physical activity elements. There was a significant group-by-time interaction for mean minutes of MVPA per day in favour of the intervention group (adjusted difference between groups at follow-up=3.85 min, 95% CI (0.79 to 6.91), p≤0.01), including significantly more vigorous physical activity (2.45 min, p≤0.01), equating to 27 min more MVPA per week.
Summary At 12-month follow-up, the intervention had reduced the decline in physical activity among adolescents from disadvantaged schools. The intervention may assist students to meet physical activity guidelines.
- Physical activity
- Adolescent
- School
- Research
This is an Open Access article distributed in accordance with the Creative Commons Attribution Non Commercial (CC BY-NC 4.0) license, which permits others to distribute, remix, adapt, build upon this work non-commercially, and license their derivative works on different terms, provided the original work is properly cited and the use is non-commercial. See: http://creativecommons.org/licenses/by-nc/4.0/
Statistics from Altmetric.com
Background
Participation in adequate physical activity has numerous physical and psychological health benefits.1 Despite this, the proportion of adolescents who are adequately active is consistently low, with as few as 20% meeting physical activity guidelines of 60 min MVPA per day.2 International data indicate a significant inverse association between physical activity and socioeconomic status (SES), with adolescents from disadvantaged backgrounds experiencing a steeper decline in physical activity.3 ,4 As physical inactivity tends to track into adulthood, reducing this decline is a public health priority.5
Schools provide access to almost all adolescents over extended periods of time.6–8 Schools have qualified staff such as physical education (PE) teachers, resources including sporting equipment and facilities, and a mandate to implement curriculum that promotes physical activity.8 Based on a number of systematic reviews,9–12 there is evidence that school-based interventions are effective in increasing the proportion of students who are physically active, the length of time spent being active, and student fitness levels.9 ,10 ,13 ,14 However, such evidence is primarily focused on children of elementary school age (5–12 years), with very few studies focusing on adolescents.9
Systematic reviews of physical activity interventions for children and adolescents9–12 conclude that interventions were more likely to be successful if they were multicomponent, longer in duration and based on theory.9 ,10 Such reviews recommended that future trials include the use of an objective measure of physical activity, measurement of total daily physical activity, use clear intervention implementation strategies, focus on low-socioeconomic groups, focus on interventions targeting adolescents, have an intervention duration spanning greater than 12 months, and employ longer follow-up.
Of the fourteen interventions targeting school-based physical activity in adolescents, only five studies have specifically targeted disadvantaged secondary school students. Of these, three have tested single sex interventions, and the studies did not demonstrate a positive intervention effect on physical activity.16–18 The two remaining intervention trials both used an objective measure of physical activity and were able to demonstrate an intervention effect. However, both interventions were of short duration, 17 weeks19 and 6 months, respectively.20
Given the limited number of effective interventions targeting greater physical activity among adolescents from disadvantaged backgrounds, the primary aim of this study was to report on the 12-month, mid-intervention impact of a 2-year multicomponent physical activity intervention implemented in disadvantaged secondary schools, which aimed to reduce the decline in physical activity associated with adolescence. Subgroup analyses for sex, baseline weight status and baseline activity level are also reported.
Methods
Study design and setting
The Physical Activity 4 Everyone (PA4E1) study was a multicomponent school-based cluster randomised trial with study assessments conducted at baseline, 12 months (mid-intervention) and 24 months. The trial was conducted in three local government areas (Hunter, Central Coast and Mid-North Coast) in the state of New South Wales (NSW), Australia. The regions have lower average indices of socioeconomic status than the state.21 The trial was registered with the Australian New Zealand Clinical Trials Registry (ACTRN1261200038287) and approved by the Hunter New England Area Human Research Ethics Committee (11/03/16/4.0), and University of Newcastle Human Research Ethics Committee (H-2011-0210). A trial protocol has been published elsewhere.21 The study adheres to the Consolidated Standards of Reporting Trials (CONSORT) guidelines (http://www.consort-statement.org).
Participants and recruitment
Secondary schools
The Socioeconomic Indexes for Areas (SEIFA) of relative socioeconomic disadvantage were used to identify eligible secondary schools.21 The SEIFA (scale: 1=lowest to 10=highest) summarises the characteristics of people and households within an area and is based on postcode. Secondary schools were considered eligible if they met the following criteria: Government and Catholic schools; schools with a SEIFA score of 5 or less (bottom 50% of NSW)22; between 120 and 200 year 7 students (to meet sample size requirements); and were not participating in other physical activity intervention studies. Recruitment of schools occurred from October to December 2011. An invitation to participate was sent to the first 10 randomly selected schools. Thirteen schools were approached to obtain a sample of 10 schools.
Students
All students in Grade 7 (first year of secondary school) at participating schools were invited to take part via an information package sent to their parents. Parental consent was obtained via returned consent form. If a consent form was not obtained, parents were contacted via telephone and asked to provide consent.
Teachers
All PE teachers at intervention schools were invited to complete a pen and paper survey. Consent was obtained via return survey.
Randomisation and allocation
Randomisation and allocation of schools to the intervention or control group occurred after baseline data collection. Using block randomisation (1:1 ratio), schools were allocated based on a random number function in Microsoft Excel. Schools were randomly allocated to receive either a multicomponent intervention that was implemented during school terms and started after baseline data collection in June 2012, or to a control group.
Intervention and comparison
The 24-month PA4E1 intervention was designed as a multicomponent school-based programme guided by social cognitive23 and social-ecological theories.24 The strategies implemented in the intervention addressed the domains of the WHO's Health Promoting Schools framework targeting the curriculum, school environment and community.15 ,25–28
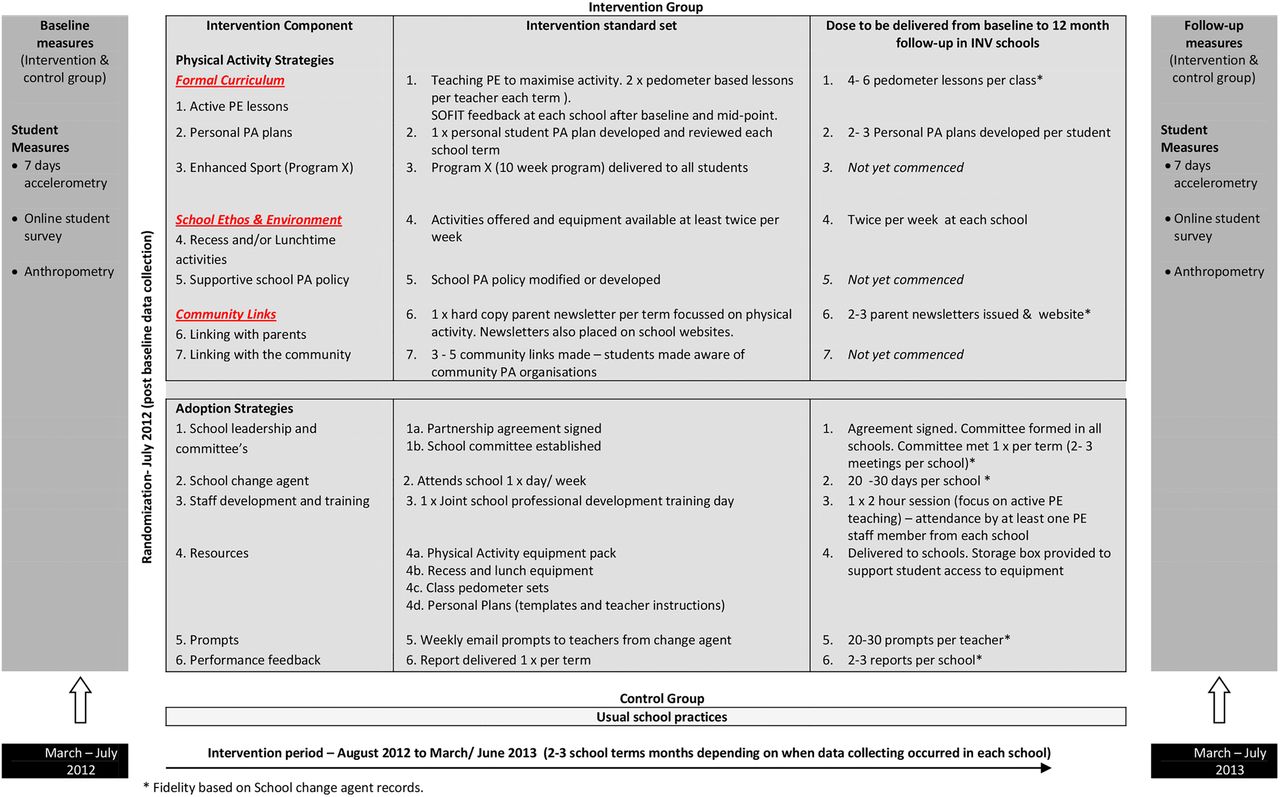
The intervention comprised seven physical activity strategies to be implemented in a staged fashion over the intervention period (see figure 1 for strategies and the standards set to be achieved for each). The strategies were: ‘Formal Curriculum’—(1) teaching strategies to maximise activity in PE lessons, including pedometer-based lessons,29 (2) development of individual student physical activity plans, (3) enhanced school sport for all students (to be delivered in Grade (8);20 ,30 ‘School Ethos and Environment’—(4) school physical activity policies, (5) offering physical activity in school breaks (lunch and recess); ‘Partnerships and Services’—(6) linking schools to community physical activity providers, (7) parent engagement. By 12-month follow-up, implementation duration within intervention schools ranged from two to three school terms (each term was 10 weeks in duration). Implementation of four of the seven physical activity strategies started (strategies 1, 2, 5, 7 above).

Intervention delivery baseline to 12-month follow-up.
Figure 1 summarises the physical activity strategies delivered, the adoption strategies used to facilitate their delivery and the desired standard and dose delivered within the first 12 months of the intervention period. In the first 12-month period, two curriculum-based strategies started, including teaching strategies to maximise activity in PE and the development of individualised student physical activity plans. To facilitate adoption, PE teachers were provided training on strategies to maximise physical activity in PE, prompted by the change agent to teach pedometer-based lessons and support students to complete personalised physical activity plans, were given resources (such as templates and instructions for use) to support students in developing personal activity plans, and given feedback on activity levels in PE based on SOFIT observations. One strategy targeting the school ethos and environment started within the first 12-month period. Offering physical activity in school breaks (lunch and/or recess) started in each school twice per week. Schools were provided equipment, including a variety of balls, hoops and ropes in a secure locked box to facilitate the start of these activities. The final strategy to start within the first 12-month period focused on parent engagement, whereby hard copy newsletters and websites were used to provide parents with updates in the programme being implemented at school plus articles about ways to support students to be active outside of the school. To facilitate the adoption of these physical activity strategies, schools established committees to oversee the changes and were provided with feedback reports outlining the schools progress towards programme adoption at the end of each term. Meetings were held with school executives, PE teachers and the school change agent to communicate the content of each feedback report.
Comparison
Schools allocated to the control group participated in the measurement components of the study only. They were asked to continue with their usual physical activity practices, including time table-based Health and Physical Education lessons, school sport, breaks for recess and lunch and any scheduled professional development for teachers.
Data collection procedures
Data collection was undertaken by trained research assistants, blinded to group allocation. Baseline data were collected from March to June 2012, and 12-month follow-up data (mid-intervention) data collected from the same cohort of students 12 months later in March–June 2013. The average duration between baseline and follow-up measurements for all schools was 12 months.
Measures
Outcome measures: physical activity levels
Physical activity was measured using accelerometers (Actigraph GT3X+ and GT3X models).31–33 Mean minutes of MVPA per day was the primary outcome. Additional outcome measures included: (1) percentage of time spent in MVPA per day (calculated to adjust for individual wear time), (2) mean minutes per day and percentage wear time for moderate physical activity, (3) mean minutes per day and percentage of wear time in vigorous physical activity, (4) accelerometer counts per minute (CPM). Counts were collected in 15 s epochs and CPM calculated by dividing the total counts per day by the minutes of wear time. The proportion of students meeting physical activity guidelines of 60 min of MVPA/day has also been reported.
Accelerometers and instructions for use were distributed to students within class time when students also completed an online survey and had anthropometric measures taken. Students were requested to wear the accelerometer over the right hip during waking hours for seven consecutive days. Student and parent mobile numbers were collected via the consent form, and these were used to text daily reminders to wear the accelerometer. Student data were included in the analysis if the accelerometer was worn for ≥600 min on ≥3 days.34 Non-wear time was defined as 30 min of consecutive zeros.35 The Everson cut-points were used to categorise different intensities of physical activity.36
Anthropometric data
Student anthropometric data, including height, weight (used to calculate body mass index (BMI)) and waist circumference was collected in duplicate using the International Society for the Advancement of Kinanthropometry (ISAK) procedures.37 Weight was measured in light clothing without shoes using a portable digital scale (Model no. UC-321PC, A&D Company Ltd., Tokyo, Japan) to the nearest 0.1 kg. Height was recorded to the nearest 0.1 cm using a portable stadiometer (Model no. PE087, Mentone Educational Centre, Australia). Weight status (BMI) was determined using International Obesity Taskforce definitions.38 Waist measurement was taken at the narrowest point between the inferior rib border and the iliac crest, using a flexible but inelastic tape measure. Waist circumference was recorded to the nearest 0.1 cm.
Student characteristics
Students completed an online survey that assessed student sociodemographic characteristics, including age, sex, Aboriginal or Torres Strait Islander status, and postcode of residence. The online survey also included other measures that were not included in the current paper (eg, physical activity mediators).
Process measures
A process evaluation was conducted to determine if the intervention was delivered (fidelity) and received (reach) as intended. At the 12-month follow-up, PE teachers completed a pen and paper survey that assessed intervention fidelity by asking about delivery of three physical activity strategies; implementing pedometer-based PE lessons and termly student physical activity plans with their classes, and whether the school offered recess and/or lunch activities. The school change agent also retained records of intervention implementation at each school. These records were used to determine if programme strategies were implemented to the desired standard outlined in figure 1. This included records of lessons in which pedometers had been used, personal PA plans developed by students, recess and/or lunch physical activities run at each school, and information in newsletters. Students in the intervention group completed online survey items at 12- month follow-up that aimed to assess the reach of three intervention strategies: pedometer-based PE lessons, termly physical activity plans, and availability of recess and/ or lunch activities. The school change agent also kept records of the adoption strategies implemented by schools, including committee meetings held, teacher training attendance, equipment/resources received by schools and prompts sent to teachers.
Sample size calculations
Based on an estimate of 120 students per school and 50% of year 7 students consenting, it was estimated each school should yield at least 60 students, providing at least 300 students per group.39 ,40 Based on 65% of the cohort providing usable data at 24-month follow-up, it was estimated that there would be at least 195 students per group at follow-up.41 Previous studies were used to estimate the SD of mean daily minutes MVPA per group (17.1)42 and the intraclass correlation coefficient (ICC; 0.01).43 After adjustment for the design effect of 1.38, the effective sample size was estimated to be at least 141 students per group. With this sample size, 80% power and an α level of 0.05, the study was able to detect a difference in the mean daily MVPA between intervention and control students of ±5.73 min at follow-up.
Statistical analysis
All analyses were conducted using SAS V.9.2 (SAS Institute Inc, Cary, North Carolina, USA). Summary statistics were created for the variables of interest (student sex, age, aboriginality, height, weight, BMI, activity level, SES) and accelerometer wear time. T tests were used to determine if students who provided data at 12-month follow-up differed to those that only provided baseline data on the following characteristics—sex, baseline age, weight status and physical activity level. Significance levels were set at p≤0.05.
Physical activity change
Analyses followed intention-to-treat principles. Analysis of the primary outcome (minutes of MVPA/day), and of the additional physical activity outcome variables (% of wear time spent in MVPA/ day; mean minutes and % wear time in moderate physical activity and vigorous physical activity and accelerometer CPM) were facilitated through a linear mixed model (LMM). These statistical models are preferable as they are robust to the biases of missing data.44 A three-level hierarchical model was used to capture the correlations in the data with random intercepts for repeated measures (level-1) on individuals (level-2) and clustering within schools (level-3). LMM analysis was used to determine whether the change in physical activity between intervention and control groups differed significantly after 12 months, assessed through an interaction term between group (intervention vs control) and time (baseline vs follow-up). The data were analysed assuming data were ‘missing at random’. Descriptive statistics were used to describe the proportion of students in each group meeting the physical activity guidelines of 60 min MVPA per day.
Subgroups analyses
Sex, baseline weight status and baseline activity level were the variables chosen a priori as these are common moderators of energy balance interventions.45 Students’ baseline BMI were categorised into two groups: ‘underweight/healthy weight’ and ‘overweight/obese’ based on the Cole cut-points.38 Baseline student activity level was categorised as those who obtained 60 min or more of MVPA per day (meeting the guidelines), and those with less than 60 min of MVPA each day (not meeting the physical activity guidelines). We included moderator interaction terms in the above LMM separately for all potential moderators and presented the results by mediator subgroup if the test for three-way interaction term (group×time×moderator) was significant at the liberal 20% threshold.46
Process measures
χ2 Square analyses were used to assess whether student responses to process variables differed by student subgroups of sex, baseline physical activity level and baseline weight status (p=0.05).
Results
Sample
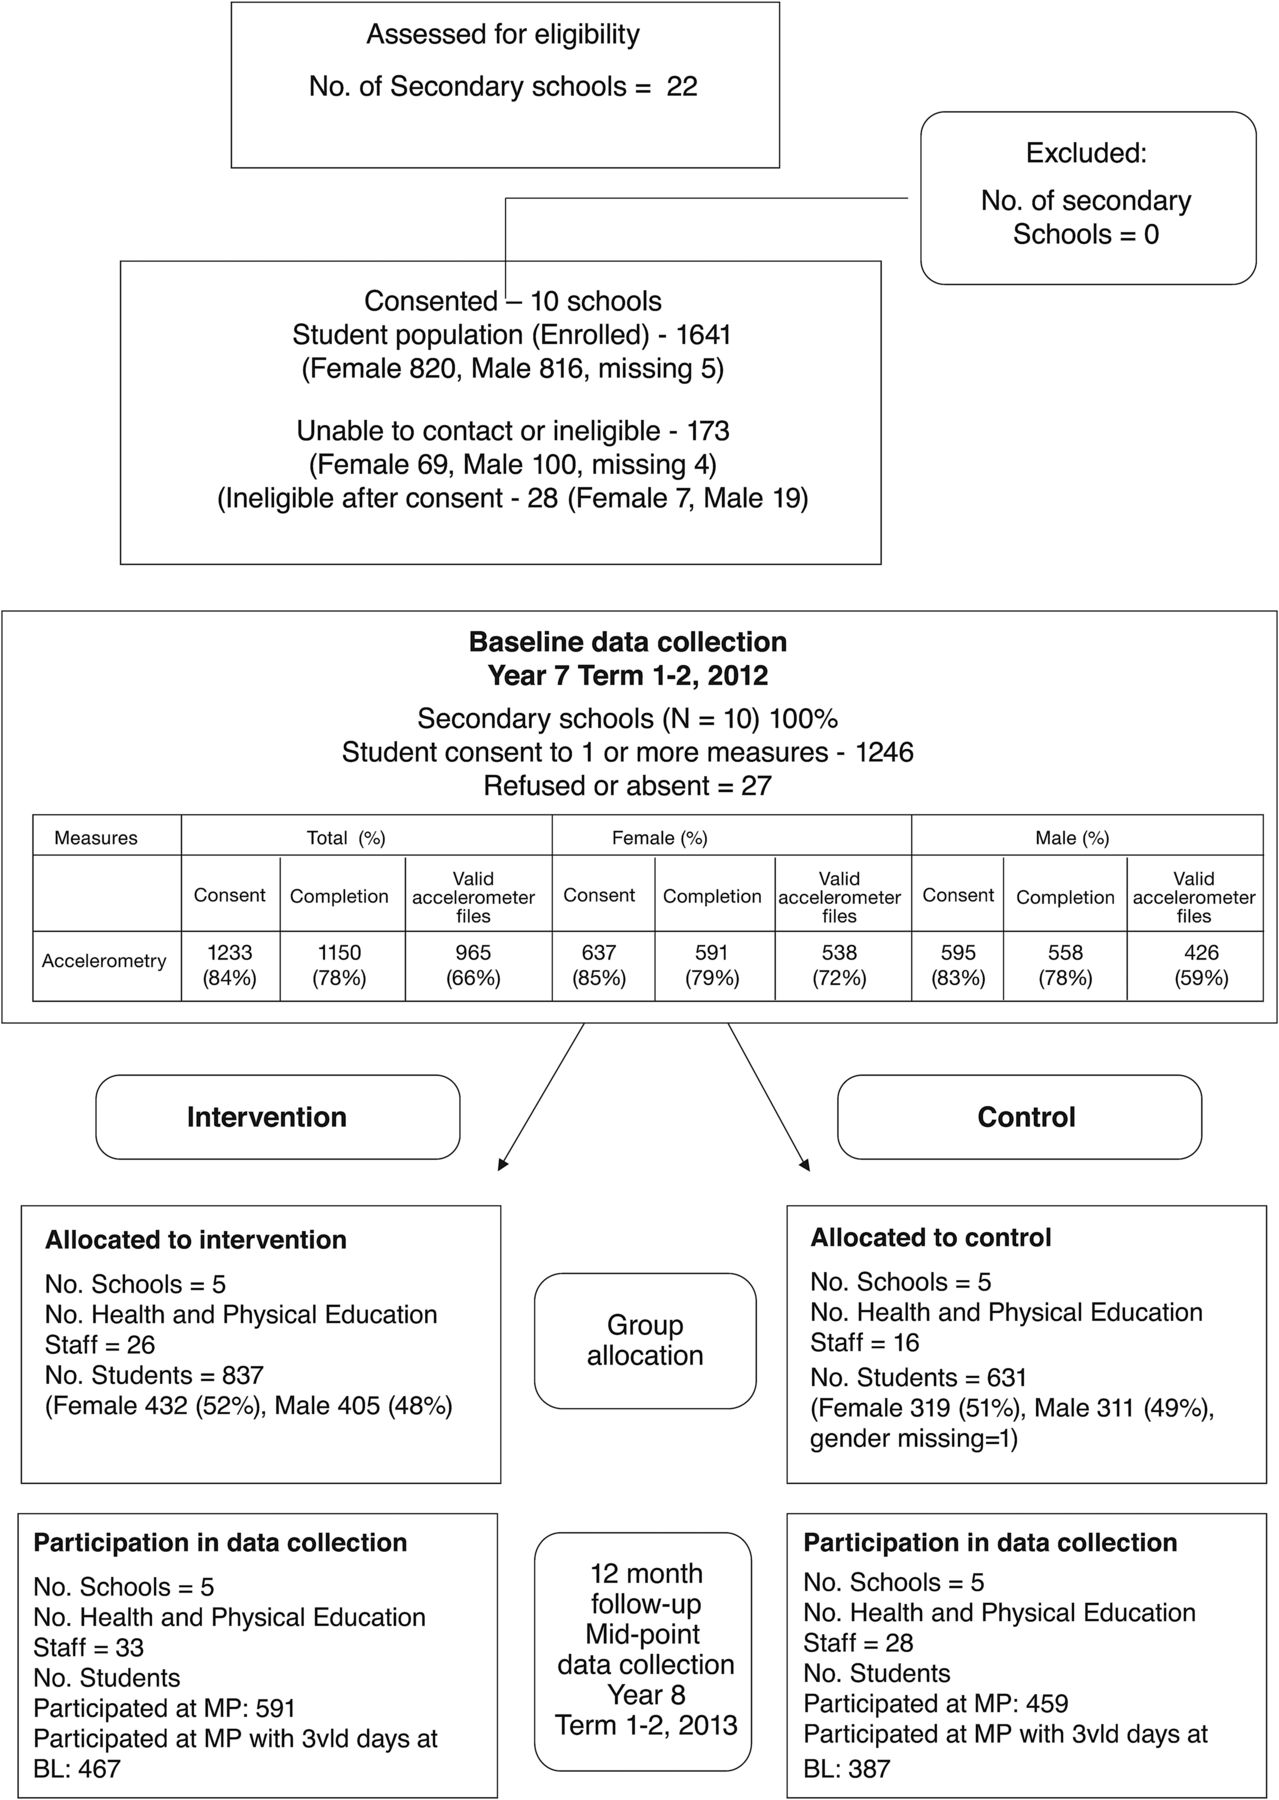
Ten schools were recruited to the study, which included four Government and one Catholic secondary school in the intervention group and control group. Thirty-three PE teachers (100%) in intervention schools completed the pen and paper survey. Parental consent was received from 1233 of the 1468 (84%) year 7 students. Figure 2 outlines the flow of participants from recruitment to 12-month follow-up. Baseline characteristics of the 1150 students who wore an accelerometer (93% of those with parental consent) are outlined in table 1.
PA4E1 sample characteristics at baseline
CONSORT flow chart describing progress of participants through the study.
At baseline, 78% of those students who wore an accelerometer provided at least three days of valid accelerometer data (965/1150). At 12-month follow-up, 1050 students wore an accelerometer and 61% of these students provided at least 3 days of valid accelerometer data (643/1050). We found baseline weight and age were predictive of drop out at 12 months, with higher BMI and younger students more likely to drop out (p=≤0.001 and p=≤0.001, respectively). A sensitivity analysis was conducted on the main outcome, adjusting for baseline weight and age, with minimal difference in the result detected; therefore, unadjusted results are presented.
Individual level physical activity changes
Physical activity outcomes from baseline to 12-month follow-up are presented in table 2. At 12-month follow-up, students in the intervention group participated in statistically significant more minutes per day of MVPA than students in the control group (adjusted difference=3.85 min (0.79 to 6.91), p=0.01).
Changes in physical activity from baseline to 12-month follow-up (minutes MVPA, % wear time in MVPA, % meeting PA Guidelines)
The intervention group spent significantly more time in vigorous activity each day (adjusted difference=2.45 min (0.90 to 4.00), p=≤0.01), but not moderate physical activity. The percent time spent in MVPA (0.5% (0.11 to 0.90)) and vigorous activity (0.3%) (0.12 to 0.52)) also differed significantly between groups at 12 month follow-up (p=0.01 and p=≤0.01, respectively) in favour of the intervention group. Mean accelerometer CPM was significantly different between groups at 12-month follow-up in favour of the intervention group (31.02 CPM, (9.05 to 53.00), p=0.01). The proportion of students meeting the physical activity guidelines were 33% at baseline and 34% at 12-month follow-up in the intervention group, and 34% at baseline and 28% at 12-month follow-up in the control group.
Changes in physical activity from baseline to follow-up across subgroups (sex, baseline weight status and baseline activity level)
The subgroup interaction term indicated time by intervention effects that differed by subgroup for each variable: sex (p≤0.01), baseline weight status (p=≤0.01) and baseline physical activity status (p=≤0.01); therefore subgroup analyses were progressed for each. The 12-month physical activity analyses by subgroup are reported in table 3. A greater effect was observed in male students in the intervention group compared with the control group on mean minutes of MVPA per day (6.47 min (1.24 to 12.95), p=0.02) and percentage of wear time spent in MVPA (0.9%, p=0.02). No significant differences between groups for females were observed at 12-month follow-up. There were no detected differences between intervention and control based on weight status or activity level detected.
Changes in physical activity from baseline to follow-up (12 months) by subgroup (gender, weight status at baseline and activity level at baseline) (Mean minutes of MVPA per day, % wear time in MVPA, % meeting physical activity guidelines)
Process measures
Table 4 outlines process evaluation data collected from teachers and students at 12-month follow-up. At 12-month follow-up, 95.5% of teachers reported using pedometers to increase activity levels in PE, 70.3% reported incorporating student personal physical activity plans each term and providing feedback to students on these plans, and 75% reported the school offered organised physical activity at recess and/or lunchtimes, at least twice per week. The school change agent records showed that all schools had started use of the pedometers in PE classes, with four of the five schools (80%) using them with the desired frequency (figure 1). Similarly, while all schools had administered student physical activity plans at least once, three (60%) had administered these as per the desired termly standard (2 or 3 per student). All schools had implemented recess and/or lunch activities at least once per week, and four (80%) had these implemented at least twice per week. All schools had provided parents with additional information regarding physical activity via newsletters and the school website with the requested termly frequency.
Intervention fidelity and reach at 12-months follow-up
At 12-month follow-up, 92.7% of students reported being offered pedometer-based PE lessons at least twice per term, 51.6% reported completing a personal physical activity plan at least once, and 55.8% reported that the school offered organised physical activity at recess and/or lunch. When the results were compared for male and female students, and for students grouped according to baseline weight and physical activity status, the only statistically significant difference was that male students were more likely than female students to report the school offered recess and/or lunch physical activities (61.5% vs 50.9% (p=0.03); table 4).
The adoption strategies outlined in figure 1 were being used consistently in all intervention schools. All schools had formed committees to oversee the implementation of physical activity strategies and had at least 2–3 meetings; the school change agent attended each school for 1 day per week and all schools had at least one staff member attend the professional development (range 1–4 staff). The school change agent sent weekly prompts to PE teachers encouraging pedometer-based PE lessons and completion of student physical activity plans. A range of equipment to facilitate recess and/or lunch activities and a storage box were delivered to each school, and feedback reports outlining progress against each strategy were delivered and discussed with school executives and the head PE teacher at the end of each school term.
Discussion
We report the 12-month mid-intervention findings from a multicomponent physical activity intervention implemented in disadvantaged secondary schools. At 12-month follow-up, students attending intervention schools participated in nearly 4 min more MVPA per day than control group students. To some readers, this may not sound like a clinically meaningful difference. However, it represents 27 min more of MVPA over the course of a week.
Small, but clinically significant effect at 1 year
Research in children and adolescents has identified a dose–response relationship between the total volume of MVPA and a reduction in cardiometabolic risk; therefore, any increase in MVPA has public health benefit.47 Students in the intervention group participated in significantly more vigorous activity and spent a greater proportion of time in MVPA and vigorous activity each day. We suggest that this magnitude of change in physical activity, particularly the increase in vigorous activity, is clinically meaningful, and may facilitate the prevention of chronic disease such as type 2 diabetes and obesity.48–50
The results displayed at 12 months extend the results described in a meta-analysis of physical activity interventions in children and adolescents;51 however, most interventions focus on children and few on adolescents. As a result, the effect size seems larger than other school-based interventions targeting adolescents. Of the interventions targeting adolescents that have been effective,19 ,20 ,52–54 two studies published mid-intervention findings, both of which showed no significant intervention effect.53 ,52 Other school-based interventions targeting adolescents demonstrated positive postintervention findings in favour of the intervention group, with effect sizes ranging from 1.9 min of MVPA per day after 2 years of intervention in the TAAG study,53 3.5 min MVPA per day for males only in the 2-year study by Haerens et al,52 and 50 accelerometer CPM after the 20-month Health in Adolescence study (HEIA).54
More recently, three interventions16–18 have specifically targeted adolescents from lower socioeconomic backgrounds; however, none have shown a significant intervention effect on MVPA. Given the challenges in conducting intervention research targeting disadvantaged adolescents and schools, a positive mid-intervention effect demonstrates potential to intervene with this target group.
Innovations in this study
The PA4E1 intervention differed from previous trials as it focused on students attending schools located in disadvantaged areas, targeted the whole school community while incorporating strategies to engage low-active students. In addition, the PA4E1 intervention was longer in duration, and included a school change agent position within a set of clear adoption strategies. Including explicit implementation strategies, as recommended in systematic reviews,10 ,15 may explain our positive findings.
In particular, the change agent, someone located within the school 1 day per week to support schools in implementing the physical activity strategies (not to deliver them) is novel. Schools often report time and demanding workloads as barriers to implementing intervention strategies.55–57 The addition of a change agent aims to overcome these barriers, and maximise intervention reach and fidelity. The addition of a further three physical activity strategies to the PA4E1 intervention in the second phase of intervention, may enhance the likelihood of sustained success. Systematic reviews have concluded that study duration, study size and positive mid-intervention results are associated with a significant intervention effect at follow-up.51
Limitations
As subgroup analyses were exploratory due to limited power, results should be seen as suggestive and interpreted with caution. At 12-month follow-up, the results were only statistically significant for boys—the intervention appeared to be effective for male students, but there was no significant effect among females. These results are in contrast to a systematic review by Yildirim45 finding girls responded better to interventions than boys. If our midpoint assessment holds true, it would have heath implications as female students who participate in less MVPA per day are less likely to achieve the daily physical activity guidelines and reduce their activity throughout adolescence at a faster rate.58
Although programme records showed that recess and lunch activities were offered in all intervention schools, girls were less likely to report that their school offered organised recess and lunchtime physical activities compared to boys; a substantial proportion of both sexes were not aware of the activities. As physical activity during recess and lunch has been reported to contribute as much as 40% towards daily physical activity recommendations,59 the introduction of recess and lunchtime activities that are more evident to students, especially those that appeal to girls, seems an important consideration for future research. However, our mid-intervention results may also indicate girls take longer to respond to interventions than boys.
Strengths
The strengths of this study include the group randomised controlled design, use of an objective measure of physical activity, the focus on disadvantaged populations and the multicomponent socioecological design. However, there are limitations. Obtaining valid accelerometer data in this age group was challenging,60 as has been discussed elsewhere.61
Although a high proportion of students who participated in baseline also participated at midpoint (84%), only 61% of the baseline sample provided at least three days of valid data at 12 months. This decrease, however, seems consistent with other studies for this target group.16 ,54 Lubans et al62 found that although 79% to 85% of the baseline sample was retained after 12 months, only 53.5% of the sample of disadvantaged girls provided three or more days of valid accelerometer data. Similarly, only 64% of students in the HEIA study in Norway provided useable accelerometer data at the 20-month postintervention.54 Although accelerometers are considered the optimal method for measuring physical activity, compliance to protocols among the students, particularly disadvantaged students, has been documented as a challenge.13 ,63 The study did not assess maturation status, which is known to impact on physical activity levels of adolescents.64
In summary, the mid-intervention effects of PA4E1 demonstrates the potential to implement a multicomponent school-based intervention in disadvantaged secondary schools. We will report 24-month follow-up as that is the primary outcome of the study.
What are the new finding?
School-based physical activity interventions targeting adolescents from disadvantaged schools are feasible and can produce meaningful physical activity effects.
Interventions with positive mid-intervention effects are more likely to have significant effects at follow-up and therefore, the Physical Activity 4 Everyone intervention shows promising signs for impacting on physical activity levels of disadvantaged adolescents.
At mid-intervention, the intervention appears to be impacting more on male students.
How might it impact on clinical practice in the near future?
Multicomponent school-based interventions that include strategies across the domains of the socioecological framework, such as increasing physical activity level in physical education, recess and/or lunch activities and linking with parents can improve physical activity levels of disadvantaged adolescents.
Intervention adoption strategies appear important particularly in this setting/population.
References
Footnotes
Contributors JW, PJM, DRL, LC, LW and KG obtained funding for the research. All authors contributed to developing the intervention and data collection protocols and materials, and reviewing, editing, and approving the final version of the paper. All authors accept full responsibility for, and have read and approved the final manuscript.
Funding This study is funded through the NSW Ministry of Health, Heath Promotion Demonstration grant scheme. In kind support for the study is also provided by the Hunter New England Local Health District. The project also received infrastructure support from the Hunter Medical Research Institute (HMRI). The study has been approved by the Hunter New England Human Research Ethics Committee (Ref No. 11/03/16/4.05), University of Newcastle (Ref No. H-2011-0210), NSW Department of Education and Communities (SERAP 2011111), Maitland Newcastle Catholic School Diocese and Broken Bay Catholic School Diocese. Anthony Okely is supported by a National Heart Foundation Career Development Fellowship.
Competing interests None declared.
Ethics approval Hunter New England Area Human Research Ethics Committee; University of Newcastle Human Research Ethics Committee.
Provenance and peer review Not commissioned; externally peer reviewed.
Linked Articles
- Warm up