Article Text

Abstract
Aim To quantify the year-to-year variability of altitude-induced changes in haemoglobin mass (Hbmass) in elite team-sport athletes.
Methods 12 Australian-Footballers completed a 19-day (ALT1) and 18-day (ALT2) moderate altitude (∼2100 m), training camp separated by 12 months. An additional 20 participants completed only one of the two training camps (ALT1 additional n=9, ALT2 additional n=11). Total Hbmass was assessed using carbon monoxide rebreathing before (PRE), after (POST1) and 4 weeks after each camp. The typical error of Hbmass for the pooled data of all 32 participants was 2.6%. A contemporary statistics analysis was used with the smallest worthwhile change set to 2% for Hbmass.
Results POST1 Hbmass was very likely increased in ALT1 (3.6±1.6%, n=19; mean±∼90 CL) as well as ALT2 (4.4±1.3%, n=23) with an individual responsiveness of 1.3% and 2.2%, respectively. There was a small correlation between ALT1 and ALT2 (R=0.21, p=0.59) for a change in Hbmass, but a moderately inverse relationship between the change in Hbmass and initial relative Hbmass (g/kg (R=−0.51, p=0.04)).
Conclusions Two preseason moderate altitude camps 1 year apart yielded a similar (4%) mean increase in Hbmass of elite footballers, with an individual responsiveness of approximately half the group mean effect, indicating that most players gained benefit. Nevertheless, the same individuals generally did not change their Hbmass consistently from year to year. Thus, a ‘responder’ or ‘non-responder’ to altitude for Hbmass does not appear to be a fixed trait.
- Physiology
- Exercise
- Altitude
- Elite performance
This is an Open Access article distributed in accordance with the Creative Commons Attribution Non Commercial (CC BY-NC 3.0) license, which permits others to distribute, remix, adapt, build upon this work non-commercially, and license their derivative works on different terms, provided the original work is properly cited and the use is non-commercial. See: http://creativecommons.org/licenses/by-nc/3.0/
Statistics from Altmetric.com
Introduction
High variability in physiological and performance responses exists between individuals following live high, train high (LHTH) and live high, train low (LHTL) altitude training. It has been proposed that some individuals respond better than others, possibly due to inherent genetic traits, and that ‘responders’ and ‘non-responders’ might explain the high-variability in adaptations to altitude training.1–5 Indeed, Chapman et al4 retrospectively classified a group of distance runners as ‘responders’ or ‘non-responders’, based on their change in 5000 m time trial performance, following 28 days of LHTL. These authors4 reported that athletes who improved their time trial also exhibited the greatest erythropoietin (EPO) response and subsequent changes in red cell volume and VO2max.
If the classification of ‘responder’ and ‘non-responder’ is a fixed trait, possibly related to underlying genetics, individual athletes should respond similarly whenever undergoing altitude exposure of similar duration and altitude. Only two studies until now3 ,5 have investigated the repeatability of responses to altitude. Robertson et al3 followed eight highly-trained runners during two blocks of hypoxic exposure (3 weeks LHTL), separated by a 5-week washout period, and reported reproducible group mean increases for VO2max (∼2.1%) and haemoglobin mass (Hbmass (∼2.7%)), but not for mean changes in time trial performance (+0.5% and −0.7% following exposures 1 and 2, respectively). Moreover, there was a moderate but unclear negative correlation for change in Hbmass from one exposure to the next,3 demonstrating high variability in individual responsiveness between exposures. Similarly, Wachsmuth et al5 reported a weak correlation (r=0.379, p=0.160) between Hbmass responses following two altitude training camps conducted approximately 3 months apart with elite swimmers, despite very reproducible increases in serum EPO (R=0.95, p<0.001).
Team-sport athletes often complete preseason altitude training camps in an attempt to optimise running performance and we recently reported improved running performance (∼1.5% above matched sea level control) accompanied by a 3.6% increase in Hbmass following 19 days of LHTH in elite team-sport athletes.6 Similar to previous investigations,1 ,2 we reported high variability in erythropoietic responses, which may be partially explained by levels of initial Hbmass7; however, much of this variability remains unexplained. The possible identification of ‘responders’ and ‘non-responders’ after a single altitude training camp, or after an acute hypoxic exposure, may allow prescription of altitude training to be targeted towards those athletes who ‘respond’ well, and/or alternative methods/altitudes adopted in an attempt to enhance the response of potential ‘non-responders’.
Therefore, the primary aim of this study was to examine the variability of physiological responses between two similar LHTH preseason training camps in professional Australian-Football players. A secondary aim was to identify potential factors that may influence responsiveness to altitude exposure, such as preintervention Hbmass, energy balance and health status. It was hypothesised that there would be a moderately strong correlation between the magnitude of physiological changes from exposure 1 to exposure 2.
Methods
Subjects
Twelve Australian-Football players completed a 19-day (ALT1) and 18-day (ALT2) moderate altitude (∼2100 m) training camp, separated by 12 months. Results from ALT1 have been previously reported.6 An additional 20 participants completed only one of the two training camps (ALT1—additional n=9, ALT2—additional n=11). All training and testing took place during the Australian Football League preseason from November to January, following a 6-week, off-season break. All participants provided written informed consent. All participants were supplemented with oral ferrous sulfate (325 mg/day) throughout the intervention period, and athletes identified as having low serum ferritin preintervention (serum ferritin ≤30 µg/L; n=3) were given a single, 2 mL ferrum H injection (Aspen Pharmacare, St Leonards, Australia; equivalent to 100 mg of iron) prior to the altitude camp.
Training
During ALT1, participants completed an 8-week training block, including 19 days living and training at moderate altitude in Flagstaff, Arizona, USA (elevation ∼2100 m). One year later, participants completed a similar 8-week training block, including 18 days living and training at moderate altitude in Park City, Utah, USA (elevation ∼2000 m). Both training blocks included endurance training, resistance exercise and football specific training (see table 1). All training was prescribed by team coaches and monitored through session rating of perceived exertion (RPE).8 This method calculates a total load (arbitrary units (AU)) by multiplying the session-RPE (Borg's Category Ratio 10-Scale) by the session duration, which is a valid method to quantify training loads in high-intensity, intermittent team sports.9
Typical training week during intervention period
Haematological measures
All participants' Hbmass was measured using the optimised carbon monoxide (CO) rebreathing technique10 5 days (D−5) before altitude exposure (PRE see figure 1). Hbmass was measured again one (D1), 13 (D13) and 17 days (D17/POST1) after ascent during ALT2 only, and 5 days postdescent (POST1) in ALT1 only. Hbmass was measured again 28 days postdescent in both groups (POST2). Change in Hbmass (ΔHbmass) was calculated from PRE in ALT1, and from the mean of D−5 and D1 in ALT2. Briefly, participants rebreathed a bolus of 99% CO equivalent to 1.0 mL/kg of body mass through a glass spirometer (BloodTec, Bayreuth, Germany) for 2 min. Per cent carboxyhaemoglobin (%HbCO) in fingertip capillary blood was measured using the same OSM3 hemoximeter (Radiometer, Copenhagen, Denmark) before and 7 min after administration of the CO dose. CO doses administered at altitude were adjusted for changes in the partial pressure (doses at ∼2000 m equivalent to 1.3 mL/kg). Six repeat measures of %HbCO were made for improved precision in Hbmass estimation.11 All Hbmass measurements were performed by the same technician. Venous blood samples were collected at PRE, 3 days (D3) and 16 days (D16) after ascent and 13 days postdescent (POSTD13) in ALT2 only. Samples were centrifuged, serum decanted and frozen at −80°C, and transported to Canberra, Australia for analysis of serum EPO (for ALT2 only), in one batch, using an automated solid-phase, sequential chemiluminescent Immulite assay (Diagnostics Product Corporation, Los Angeles, USA). PRE and POSTD13 samples were analysed for reticulocyte count using a Sysmex XE-5000 Automated Haematology Analyser (Roche Diagnostics, Castle Hill, Australia) at St Vincent’s Hospital Pathology (Fitzroy, Australia), while D3 and D16 samples were analysed using a Sysmex XT-4000i Automated Haematology Analyser (Sysmex, Lincolnshire, USA) at Park City Medical Centre (Park City, USA). Serum ferritin was assessed at PRE using an AU5800 immuno-turbidimetric assay (Beckman Coulter, Lane Cove, Australia) to identify iron-deficient participants.

Timeline of haemoglobin mass (Hbmass) collection over ALT1 and ALT2.
Body mass and illness
Body mass was monitored daily on waking (07:00–08:00) in a well hydrated state (confirmed through urine specific gravity measures (URC-NE, Atago, Tokyo, Japan)) throughout the intervention period using electronic scales (Tanita, Kewdale, Australia). Changes in body mass were calculated from the first to the last day at altitude during both camps. Athletes were classified as ‘ill’ if any training session was missed throughout the intervention period due to physical illness, excluding musculoskeletal injuries.
Statistical analysis
A magnitude-based statistical approach12 was used to detect small effects of practical importance. Data were log-transformed to account for non-uniformity error. Differences within and between groups were assessed with dependent and independent t tests for unequal variance.12 The magnitude of changes were assessed in relation to the smallest worthwhile change (SWC), set to 2% for Hbmass and a small effect size (d=0.2×the between-participant SD for PRE) for other variables. Observed effects were reported as the mean change or difference ±90% confidence limits. Effects were termed positive, trivial or negative depending on the magnitude of the change relative to the SWC and assigned a qualitative descriptor according to the likelihood of the change exceeding the SWC: 50–74% ‘possible’, 75–94% ‘likely’, 95–99% ‘very likely’, >99% ‘almost certainly’.13 Effects where the 90% CI overlapped simultaneously the substantially positive and negative thresholds were deemed ‘unclear’. The magnitude of individual responses were calculated from the square root of the difference in the variance of the change scores.14 A Pearson's correlation coefficient was used to examine the relationship between percentage change in Hbmass (%ΔHbmass) from ALT1 to ALT2 and the relationship between initial Hbmass and change in Hbmass. Because one participant's results appeared to heavily influence the relationship from year to year, a Pearson's correlation was also performed after removing these data. Participants who reported illness (ALT1 n=2, ALT2 n=3, total n=5) were removed from correlation analyses, as proinflammatory cytokines suppress EPO production.15 Participants were also retrospectively divided into groups classified as BodyMassstable (gained mass or lost <2.0 kg), or BodyMassloss (lost >2.0 kg).
Results
Training load, duration and RPE
Weekly training load, duration and RPE for all participants are presented in table 2A. The overall training load was very likely 5.5±4.8% (mean±90% CI) higher and mean RPE almost certainly 7.2±2.6% higher in ALT1 compared to ALT2. Training duration was very likely 12.6±3.6% higher in ALT2 compared to ALT1.
Training load, training duration and rate of perceived exertion (mean±SD) during ALT1 and ALT2
The weekly training load, duration and RPE for healthy repeat participants (n=9) are presented in table 3. There was an unclear 0.5±3.5% difference in the overall training load between ALT1 and ALT2. The overall mean RPE was very likely 5.1±2.8% lower and training duration was almost certainly 13.5±2.4% higher in ALT2 compared to ALT1.
Training load, training duration and rate of perceived exertion (mean±SD) for the nine participants completing both ALT1 and ALT2
Haemoglobin mass
Hbmass (all participants): The typical error of Hbmass for the pooled data of all 32 participants, for measures made approximately 5 days apart, was 2.6% (90% CI of 2.1% to 3.3%). Mean (±SD) Hbmass in ALT1 (n=21) and ALT2 (n=23) groups preintervention was 992±129 and 1008±159 g, respectively. %ΔHbmass from baseline is displayed in figure 2. Mean %ΔHbmass (±90% CL) was very likely increased at POST1 in ALT1 (3.6±1.6%, with individual responsiveness of 1.3%) and almost certainly increased at D13 (3.9±1.0%) and D17 (4.0±1.3%, with individual responsiveness of 2.2%) in ALT2. Differences in %ΔHbmass between ALT1 and ALT2 from PRE to postintervention (POST1 and D17 during ALT1 and ALT2, respectively) were unclear (−1.3±7.0%). Hbmass returned to baseline at 4 weeks postaltitude in ALT1 and ALT2. There was a negative correlation (R=−0.51, p=0.04; see figure 3) between initial Hbmass relative to body mass (RelHbmass) and %ΔHbmass at POST1 in healthy BodyMassstable participants (n=30).

Percentage changes in haemoglobin mass (Hbmass) (mean±90% CI) after altitude ALT1 and ALT2.

Change in haemoglobin mass (Hbmass) versus initial RelHbmass in healthy and BodyMassstable participants pooled for ALT1 and ALT2 altitude camps.
Hbmass (participants completing ALT1 and ALT2): There was a trivial difference in Hbmass at PRE for ALT1 (1023±143 g) versus ALT2 (1017±135 g) in participants completing both training camps (n=12). In these participants, Hbmass very likely increased at POST1 in ALT1 (3.7±2.5%) and at D17 in ALT2 (4.2±2.4%). A weak correlation between individual %ΔHbmass was observed between ALT1 and ALT2 (n=12; R=0.12, p=0.71), which was marginally stronger when participants who reported illness in ALT2 were not included ((n=9; R=0.21, p=0.59) see figure 4). After removing one participant who was influencing the results heavily, the correlation between Hbmass from year to year reduced to R=0.02 (n=8, p=0.96, figure 4).

Change in haemoglobin mass (Hbmass) during ALT1 versus change in Hbmass during ALT2. Three participants were removed from this analysis due to illness throughout the study period (n=9). Grey filled circle represents an outlier; regression line and associated equations when the outlier is removed are shown in grey.
Hbmass (ill vs healthy participants): figure 5A shows %ΔHbmass for participants separated into healthy (n=39) and ill (n=5) groups. Ill participants had a trivial 0.2±2.4% change in Hbmass at POST1, which was almost certainly 3.9±1.1% lower than changes in healthy participants. There was a trivial 1.1±1.6% difference in Hbmass between ill and healthy participants at POST2.
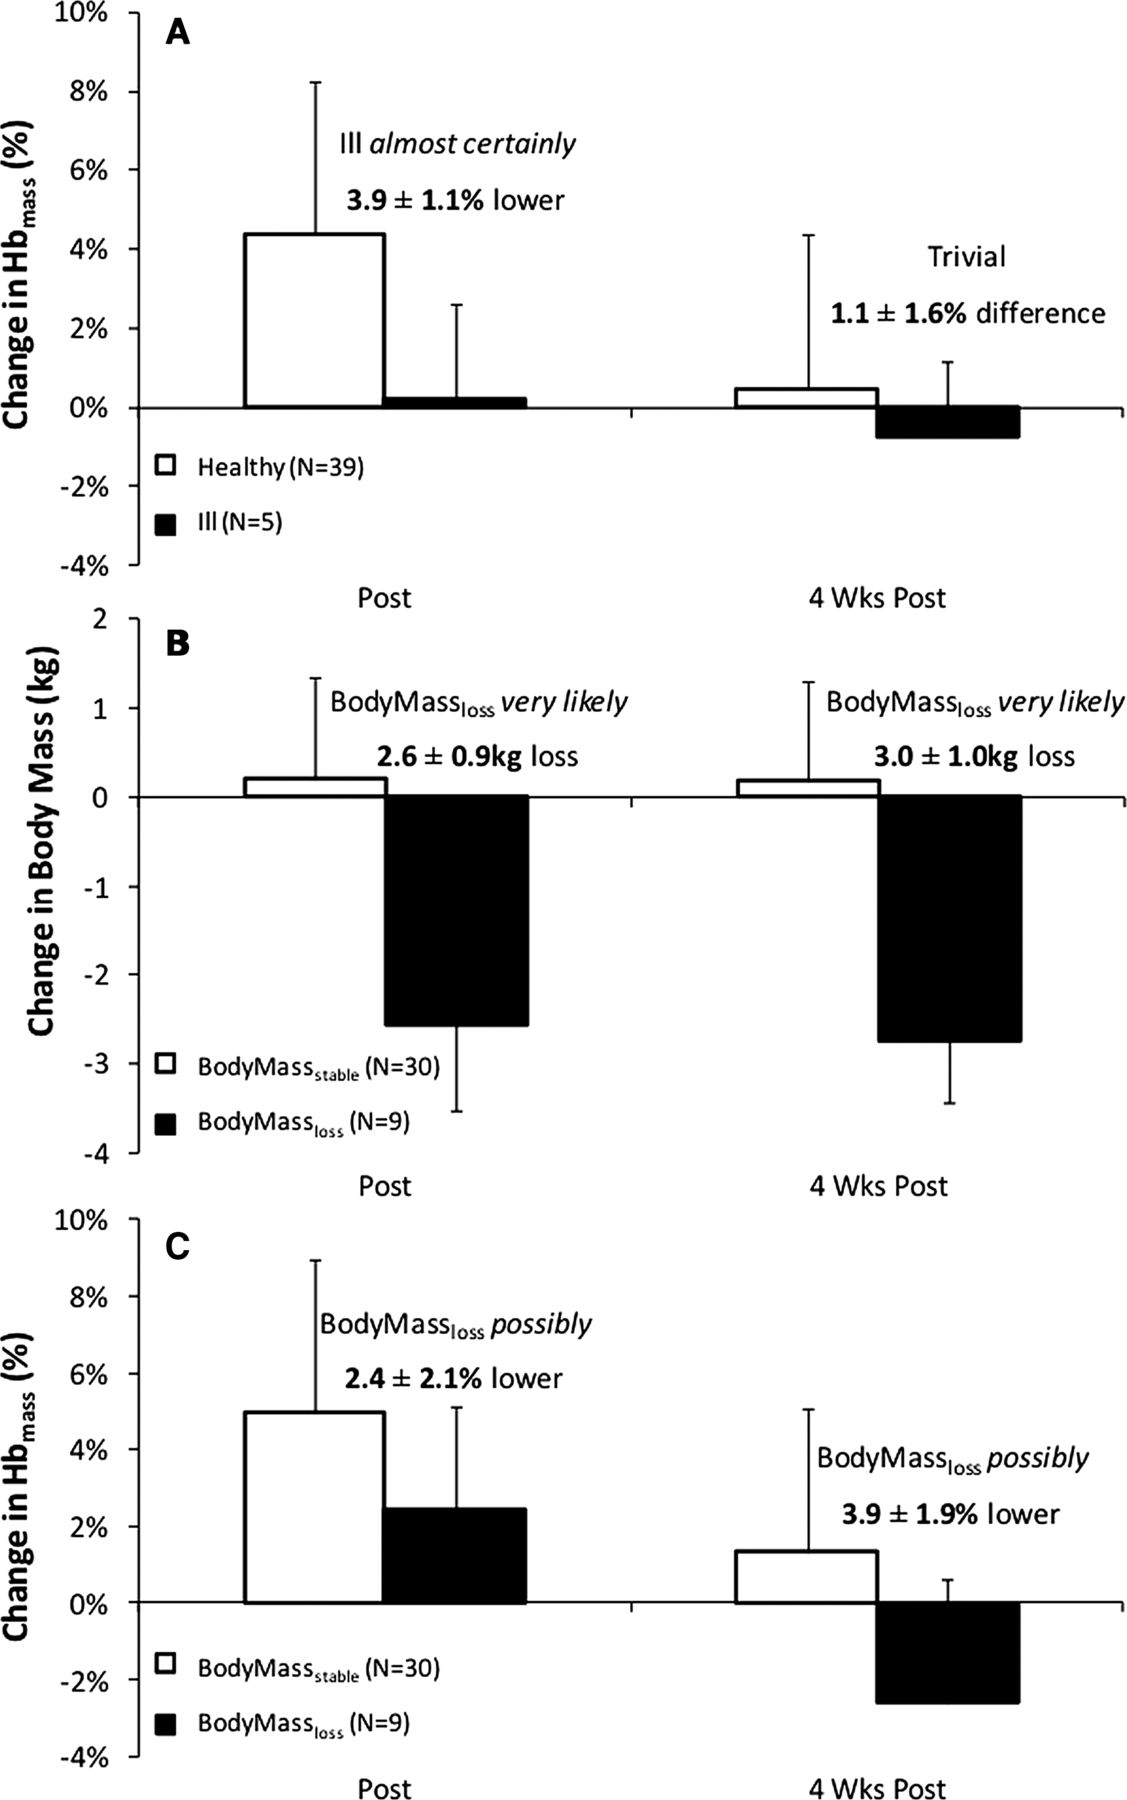
Change in haemoglobin mass (Hbmass) in ill and healthy participants (A), as well as change in mass (B) and change in Hbmass (C) in BodyMassstable and BodyMassloss groups.
Hbmass (BodyMassstable vs BodyMassloss participants): Changes in body mass and Hbmass and body mass for the BodyMassstable (n=30) and BodyMassloss (n=9) groups are presented in figure 5B, C, respectively. BodyMassloss participants very likely lost 2.6±0.9 kg from PRE to POST1, while BodyMassstable participants had a trivial 0.2±1.3 kg change in body mass. BodyMassloss participants possibly increased in Hbmass by 2.6±1.8% at POST1, which was possibly 2.4±2.1% lower than the changes in the BodyMassstable group. At POST2, BodyMassloss participants had a possible 2.3±2.7% decrease in Hbmass from PRE, which was very likely 3.9±1.9% lower than the BodyMassstable group.
Reticulocytes and EPO—for ALT2 only
Figure 6 shows reticulocyte percentage and EPO concentrations for ALT2. Compared with PRE, reticulocytes almost certainly increased by 39±12% at D3 and very likely increased 16±10% at D16. Reticulocytes almost certainly reduced from PRE by 27±10% at POSTD13. EPO almost certainly increased by 36±10% and 22±10% from PRE at D3 and D16, respectively, and almost certainly reduced from PRE by 16±16% at POSTD13.

Reticulocyte (A) and erythropoietin (EPO) (B) response during ALT2. Black circles and error bars show group change as mean±SD and grey circles show individual responses. Dark grey broken lines depict responses of three participants who reported illness before (b+c) and during (a) altitude exposure. NB. EPO data at PRE missing for participant (b) due to being absent from testing as a result of illness.
Discussion
The main finding of the current investigation is that, while two preseason moderate altitude camps yield a similar group mean increase (∼4%) in Hbmass of elite footballers, there is wide variability in this erythropoietic response and individual athletes do not exhibit consistency in changes in Hbmass from year to year. Thus, a ‘responder’ or ‘non-responder’ to altitude does not appear to be a fixed trait with respect to changes in Hbmass. Some of the variability in erythropoietic response may be explained by the incidence of illness, reductions in body mass and precamp Hbmass, but large variability is still evident in healthy athletes who maintain body mass. Another important finding is that almost all of the erythropoietic response of an 18-day altitude camp (ALT2) occurred within the first 13 days of exposure.
Repeatability of changes in Hbmass
We previously reported that elite team-sport athletes achieved a mean increase of ∼3.6% in Hbmass over a 19-day altitude camp.6 During a subsequent 18-day exposure (ALT2), our participants achieved a similar mean increase in Hbmass of 4%. However, in agreement with other work,1 ,4 ,16 there was considerable individual variability in the erythropoietic response. Chapman et al4 introduced the concept of ‘responders’ and ‘non-responders’ to altitude when they found that participants who achieved the greatest improvements in 5000 m running performance following LHTL also demonstrated the greatest erythropoietic response. This led to suggestions that the magnitude of an individual's response to altitude may be influenced by genetically determined traits.4 ,17 This theory proposes that individuals should respond similarly on subsequent hypoxic exposures, given the same hypoxic dose (ie, exposure time and degree of hypoxia). However, we observed a small correlation between changes in Hbmass following ALT1 and ALT2 (R=0.21) in participants who completed both training camps (n=9), which was reduced to R=0.02 when the sole outlier was removed. This supports previous investigations3 ,5 that have reported weak (R∼0.10–0.38) relationships between changes in Hbmass following repeated altitude exposures ∼1–3 months apart, suggesting that responsiveness to a given hypoxic stimulus is not a fixed trait. The ∼2% typical error of the optimised CO rebreathing technique10 ,18 along with natural biological variations19 ,20 may, in part, contribute to the variability from exposure to exposure.
Timeline of erythropoietic response
It is well accepted that a sufficient hypoxic dose (h/day; number of days; degree of hypoxia) is required to induce detectable erythropoietic benefit.21 ,22 Wilber et al21 suggested that altitude training at 2000–2500 m for at least 22 h/day and a minimum of 4 weeks is required to optimise physiological benefits. However, these recommendations are based on data from studies that examined erythrocyte volumes pre and postaltitude exposure, with little data addressing the time course of responses. Recently, detectable increases in Hbmass have been reported with exposures as short as 1123 and 13 days5. Similarly, we observed an ∼4% increase in Hbmass after 13 days at altitude, with no additional increases by day 17. This suggests that erythropoietic benefits are possible with shorter duration altitude training camps than commonly recommended, given sufficient altitude/hypoxia.21 A 2-week time course may have significant implications for team-sport organisations, which often schedule altitude camps during limited preseason periods and may face financial restrictions during longer duration camps due to travel/accommodation costs for athletes and support staff.
Effect of initial RelHbmass
We found a similar relationship between initial RelHbmass and %ΔHbmass as in our original investigation.6 These data support the work of Robach and Lundby,7 which suggests that athletes starting with low RelHbmass have the ability to increase Hbmass to a greater extent following hypoxic interventions. Others have proposed that athletes with initially high RelHbmass (∼14.7 g/kg) may have already ‘maximised’ this component of their physiological capacity through training at sea level,24 with limited opportunity to further increase Hbmass through altitude interventions. However, subsequent research from the same group showed that increases in Hbmass can be achieved in cyclists possessing elevated initial RelHbmass (∼14.2 g/kg).23 It is also possible that altitude training interventions may increase Hbmass to a given individual's physiological limit, and responsiveness may therefore vary depending on an individual's baseline Hbmass.5 Collectively, these data5–7 suggest that team-sport athletes with a higher initial RelHbmass may have an attenuated ability to increase Hbmass with altitude training interventions.
Effect of illness on erythropoiesis
It has been suggested that athletes suffering from infection/illness/injury that results in increased inflammation may have limited erythropoietic responses to altitude exposures.5 ,6 Indeed, Wachsmuth et al5 reported attenuated changes in Hbmass in sick/injured athletes following LHTH interventions at 2320 m. Similarly, we observed an attenuated erythropoietic response in participants experiencing illness during ALT1 (n=2) and ALT2 (n=3) (see figure 5A). Proinflammatory cytokines, such as interleukin 1(IL-1), are known to suppress the release of EPO,15 and EPO data for ill participants during ALT2 are highlighted in figure 6B. Participants (b) and (c) (in figure 6B) suffered illness immediately preceding the camp, which was accompanied by low EPO levels before and throughout the camp duration. Participant (a) fell ill on arriving at a high altitude and displayed suppressed EPO responses thereafter. Making statistical inferences are difficult, given that instances of illness/injury are low in our investigation (n=5) and in Wachsmuth et al5 (n=7). However, these data support the hypothesis that illness/injury may limit the erythropoietic benefits associated with prolonged hypoxic exposures.
Effect of body mass reductions on erythropoiesis
Participants experiencing reductions in body mass (>2 kg) achieved approximately half of the erythropoietic benefit as those maintaining body mass (∼2.5% vs ∼5% increase in Hbmass, respectively). Furthermore, at 4 weeks postaltitude, BodyMassloss participants displayed Hbmass ∼2.3% below prealtitude levels. Our results are in contrast with those of Gough et al,25 who modelled that body mass changes over approximately 6 months did not significantly alter Hbmass; for instance, that a 10% loss of body mass would only decrease Hbmass by 1.4%. In contrast, the 2.6 kg reduction in body mass within the Australian-Footballer subgroup over 18–19 days suggests a mismatch between energy consumption and energy expenditure and thus an overall catabolic state, which may not support an anabolic process like erythropoiesis. Evidence in maintenance haemodialysis patients with haemodialysis suggests that poor appetite and low protein intake are associated with increased serum concentrations of inflammatory markers (including C reactive protein, IL-6 and tumour necrosis factor-α) and increased synthetic EPO dose requirements.26 While mechanisms for a poor erythropoietic response in BodyMassloss participants are not clear, the combination of altitude exposure and weight loss appears to be counterproductive for Hbmass maintenance.
Limitations
This research was conducted with a relatively small sample of elite Australian-Football players. Even when using a magnitude-based statistical approach,12 the small sample size limitations are most apparent in our attempts to quantify the effects of initial Hbmass, as well as loss of body mass and of illness on the response to altitude. A further limitation is the use of two different Sysmex haematology analysers for the reticulocyte measures, since even Sysmex analysers that are calibrated within the manufacturer's tolerances can have biases of the order of 0.3–0.5% reticulocytes.27 The applied nature of this research also led to a number of limitations, which should be considered when interpreting our results. ALT1 and ALT2 were conducted in different locations over different durations (19 and 18 days, respectively). However, the altitude at these locations is very similar (∼2100 m) and the overall hypoxic dose between camps differed by only 18 h. The temporal measurements of Hbmass differed between ALT1 and ALT2; POST1 was taken 5 days postaltitude (ALT1) compared with the penultimate day at altitude (ALT2). Therefore, the potential confounding effects of neocytolysis upon return to sea level23 ,28 during ALT1 may account for some of the variability between the two exposures.
Conclusion
This investigation was conducted in an ecologically valid environment, with professional team-sport athletes engaging in preseason altitude training in an attempt to improve subsequent performance at sea level. As responsiveness to a given altitude exposure does not appear to be a fixed trait, it is not currently possible for individual athletes to be identified as ‘responders’ or ‘non-responders’ following a single altitude exposure. To optimise the erythropoietic benefit from an LHTH intervention, athletes should be well prepared, in good health and maintain body mass throughout its duration. Healthy team-sport athletes should expect a 3–4% increase in Hbmass following an 18–19 day altitude training camp, with this erythropoietic response possibly achievable in as short as 13 days.
What are the new findings
-
Team sport athletes produce repeatable group mean increases in Hbmass (∼4%) over 18–19 day moderate altitude camps, and these benefits may be achieved in as short as 13 days.
-
Individual athletes do not exhibit consistency in altitude-induced changes in Hbmass from year to year, and thus a ‘responder’ or ‘non-responder’ to altitude does not appear to be a fixed trait.
-
To achieve full erythropoietic benefit from altitude exposure, athletes should maintain body mass and remain free from illness immediately before and throughout the exposure.
How might it impact on clinical practice in the near future?
-
Athletes may gain physiological benefits from participating in shorter duration (∼13 days) altitude training camps than previously recommended.
-
Strategies to maintain body mass and optimal health immediately before and throughout altitude training camps should be adopted.
Acknowledgments
The authors would like to acknowledge the generous participation of all athletes in this research study. The authors acknowledge the contribution of Collingwood Football Club and their staff involved in making this project run smoothly. Special thanks are extended to Dr Doug Whyte and Professor Geraldine Naughton for their assistance with this project.
References
Footnotes
-
Contributors BM and DB were involved in the concept and design of the study, conducted the data collection and analysis and prepared the manuscript. CG and JK were involved in the concept and design of the study, data analysis and interpretation and preparation of the manuscript. KW assisted with data collection and analysis and manuscript preparation.
-
Competing interests None.
-
Ethics approval Australian Catholic University Human Research Ethics Committee.
-
Provenance and peer review Not commissioned; externally peer reviewed.