Article Text

Abstract
OBJECTIVES To (a) develop an atlas of line drawings for the assessment and grading of narrowing and osteophyte (that is, changes of osteoarthritis) on knee radiographs, and (b) compare the performance of this atlas with that of the standard Osteoarthritis Research Society (OARS) photographic atlas of radiographs.
METHODS Normal joint space widths (grade 0) for the medial and lateral tibiofemoral and medial and lateral patellofemoral compartments were obtained from a previous community study. Grades 1–3 narrowing in each compartment was calculated separately for men and women, grade 3 being bone on bone, grades 1 and 2 being two thirds and one third the value of grade 0. Maximum osteophyte size (grade 3) for each of eight sites was determined from 715 bilateral kneex ray films obtained in a knee osteoarthritis (OA) hospital clinic; grades 1–2 were calculated as two thirds and one third reductions in the area of grade 3. Drawings for narrowing and osteophyte were presented separately. 50 sets of bilateral knee x ray radiographs (standing, extended anteroposterior; flexed skyline) showing a spectrum of OA grades were scored by three observers, twice using the OARS atlas and twice using the drawn atlas.
RESULTS Intraobserver and interobserver reproducibility was similar and generally good with both atlases, though varied according to site. All three observers preferred the line drawing atlas for ease and convenience of use. Higher scores for patellofemoral narrowing and lower scores for osteophyte, especially medial femoral osteophyte, were seen using the line drawing atlas, showing that the two atlases are not equivalent instruments.
CONCLUSION A logically derived line drawing atlas for grading of narrowing and osteophyte at the knee has been produced. The atlas showed comparable reproducibility with the OARS atlas, but was discordant in several aspects of grading. Such a system has several theoretical and practical advantages and should be considered for use in knee OA studies.
- osteoarthritis
- knee
- radiographic atlas
- OARS atlas
- drawn atlas
Statistics from Altmetric.com
Knee osteoarthritis (OA) is a major cause of pain and disability in the elderly.1 ,2 There is, however, no accepted unifying definition for clinical and epidemiological studies.3 Although relatively insensitive, the plain radiograph is the most widely used method for assessing structural change and for defining disease. Various measures may be undertaken on a radiograph, such as direct measurement of interosseous distance (for joint space narrowing), but for studies that require classification or grading of severity of knee OA a simple system of visual comparison with a standard is often employed.
The first standardised method to determine radiographic knee OA was developed by Kellgren and Lawrence.4 This system was based on a global assessment combining several features. Particular emphasis was given to the presence of osteophyte, as opposed to joint space narrowing,4 which was inconsistent with the radiographic description of OA employed by Kellgren and Lawrence themselves.5 As a result, considerable variability between observers was widely recognised in the application of the Kellgren and Lawrence system.6 By contrast, Altmanet al developed a scoring system based on individual radiographic features in the tibiofemoral compartments.7 Such ordinal, individual feature scales proved more sensitive in identifying progression of tibiofemoral OA than the Kellgren and Lawrence system.5
The patellofemoral compartment is commonly affected by OA8and therefore merits radiographic assessment along with the tibiofemoral compartments. Spector et aldeveloped a scoring system for individual features that included the patellofemoral compartments assessed on a lateral flexion view.9 Subsequently, however, the skyline (“sunrise”) view was shown to be the preferred method for reproducibly assessing this compartment10 and for closer association between radiographic change and knee symptoms.11 A second expanded atlas12 therefore included the skyline as well as lateral views of the knee.
The most recent radiographic atlas has been published by Altmanet al as the Osteoarthritis Research Society (OARS) atlas.13 This permits scoring of individual features and includes the skyline view of the patellofemoral compartment. It is considered by many as the current standard radiographic atlas for OA and has been found to have good intraobserver and reasonable interobserver reproducibility in clinical studies.14-16 Direct comparison of the OARS atlas13 with previous photographic atlases for knee OA7 ,9 ,12 has not been reported.
There are, however, several theoretical and practical problems with photographic atlases. For example, specifically considering the OARS atlas:
The ordinal grades for joint space narrowing and osteophyte size do not increase in strictly geometric (that is, interval) fashion
Uncommon shapes of osteophyte are presented on several knee radiographs
There are no radiographs for the medial and lateral aspects of the femoral trochlea in the skyline view16
There are variations in magnification and intensity, which cause difficulties in comparisons between some of the photographs
Concurrence of several features (narrowing, osteophyte, sclerosis, etc) within the same x ray photograph may distract the observer and lead to bias when matching the study film and atlas image for more than just the individual item of interest
Because the atlas photographs are spread over many pages it is cumbersome to use
Because of the cost of photographic reproduction the atlas is not readily available to all investigators.
We considered that if such a visual method of comparison with a standard is to be used in a study then these theoretical and practical problems need to be addressed. The aims of the present study were to (a) develop an atlas for knee OA based on line drawings, to overcome some of the above difficulties, and (b) to compare the performance and ease of use of the line drawing atlas against that of the standard OARS atlas.
Methods
DEVELOPMENT OF THE LINE DRAWING ATLAS
We elected to include only joint space narrowing and osteophyte in the line drawings because these are accepted as the two cardinal features of radiographic, structural OA; both show reasonable observer reproducibility (cf sclerosis, cysts) using standard radiographic atlases14 ,15; and both of these features can be readily reproduced by line drawings. As with previous standard atlases9 ,12 ,13 we elected to score each feature from 0 to 3, to allow direct comparison with the OARS atlas.
Normal bone contours and joint space widths
Normal bone contours and joint space widths were derived for each compartment from a community based study previously undertaken in our unit.14 This study provided anteroposterior and skyline knee radiographs of healthy UK (white) adults with no knee pain. Anteroposterior radiographs were taken in a standardised manner (weight bearing, full extension, 55 kV, 8 mA/s, FSD 100 cm) and skyline radiographs were taken according to the method of Laurin (mid-flexion, 60 kV, 10 mA/s, FSD 100 cm).17 Normal joint space widths (that is, grade 0 joint space narrowing) for each knee compartment were derived from radiographs of subjects with no knee pain who, in addition, had no osteophyte evident on their radiographs.14 In these “normal” knee radiographs joint space width did not differ according to age, but mean widths were higher in men than in women.14 For joint space narrowing we therefore produced separate sets of line drawings for men and for women.
Selection from several hundred normal study films of two representative sets of radiographs, one male and one female, showing normal bone contours for each radiographic view and having normal joint space widths (as reported in the study14), was made by consensus agreement between three authors (YN, PL, MD). Hand tracings of these radiographs were then undertaken as clearly as possible along bony margins and bright radiodense bands. Tracings were slightly adjusted, if necessary, to show precisely the mean joint space widths in each compartment as reported in the study.14 These sets were designated grade 0 for joint space narrowing. Copies of these tracings were subsequently adjusted to show grades 1, 2, and 3 joint space narrowing in each compartment, calculated as 33%, 66%, or 99% reductions of the interbone distance evident on the grade 0 joint space narrowing set. In other words, grade 1 was to be two thirds, and grade 2 was to be one third the normal (grade 0) joint width, respectively; grade 3 was to be bone on bone in that compartment. Apart from this geometric reduction in joint space we took into account two further considerations to make the drawings as biological and as representative of real radiographs as possible. Firstly, the joint space in a contralateral compartment was not reduced; secondly, the tibia was shifted more medially, and the patella more laterally, with progressive joint space narrowing.
Osteophytes
The maximum size of grade 3 osteophytes was selected from a hospital based sample of patients with knee OA. The sample database included 715 sets of bilateral knee radiographs taken over a seven year period from 216 patients referred to a rheumatology clinic because of symptomatic knee OA. Radiographs were taken in the same way as described above for the community study from which joint space narrowing was derived. All these films were studied and scored in detail for many features, including osteophyte size, shape, and direction at each site within the three major compartments of each knee. The data from this cross sectional and prospective survey will form a separate report (Nagosa Y et al, unpublished data). Selection of radiographs showing the biggest as well as the most typical shape and direction at each site was made by consensus agreement by three authors (YN, PL, MD). The shape and direction of osteophyte showed some variation at each site, particularly at the lateral tibial plateau and medial femoral trochlea. Therefore at these two sites we selected two osteophyte sets for inclusion in the atlas: firstly, the most common shape and direction of osteophyte (standard set), and, secondly, the next most common shape and direction of osteophyte (secondary optional set).
Hand tracings were made of the selected largest (grade 3) osteophytes at each site. Grade 1 and grade 2 osteophytes were then drawn to be one third and two thirds respectively the length and width of the grade 3 osteophyte. Thus the area size of grade 1 and grade 2 osteophytes approximated more to one ninth and four ninths respectively of grade 3 osteophyte. The shape of grade 1 or grade 2 osteophytes was drawn slightly differently from grade 3 osteophyte in that the most proximal part of the osteophyte in longitudinal section and the closest part to the joint surface in the transverse axis of grade 3 osteophyte were included in grade 1 and grade 2 osteophytes. This appearance was consistent with our observations on osteophyte size, shape, and direction (Nagosa Y et al, unpublished data). The same grade of osteophyte at all sites was appended to the bony contour of a normal female knee radiograph with normal joint space widths. During this process close attention was paid to the correct position and direction of osteophyte and to ensure a smooth contour of osteophyte origin. Furthermore, adjustment of magnification was undertaken so that the tibial widths on normal and osteophyte films were the same.
RADIOGRAPHIC ASSESSMENTS USING THE OARS AND LINE DRAWING ATLASES
Three observers took part in this aspect of the study. One was an orthopaedic surgeon with one year's experience of using the OARS atlas for scoring several hundred knee radiographs. The other two were trainee rheumatologists, neither of whom had extensive prior experience of scoring knee films. Before the formal radiographic assessments, all three observers underwent preliminary combined training in use of the OARS13 and line drawing atlases. The same amount of training time was given to each scoring system and the same knee radiographs were graded in each training session. Disagreement between observers was discussed as part of the training.
Each observer then scored 50 sets of bilateral knee films (that is, 100 knees) four times—the first and third reading using the OARS atlas, the second and fourth using the line drawing atlas. Joint space narrowing in each of the four knee compartments (medial and lateral tibiofemoral, medial and lateral patellofemoral) and osteophytes at eight sites (medial and lateral femoral condyle, medial and lateral tibial plateau, medial and lateral patella, medial and lateral trochlea) were each scored 0–3 on each occasion. All films were read over a one week period. Films were blinded except for sex, and were randomly ordered at each reading. These standing anteroposterior and skyline films (taken as described above) were obtained from a community based study of knee pain18 and were chosen to represent a full spectrum, ranging from normal to severe for joint space narrowing in each compartment, and to include examples of each osteophyte grade at all sites.
Intraobserver reproducibility was calculated for each system by comparing gradings recorded at the first and second readings. Interobserver agreement for both first and second readings was compared for the two systems. Grades at each site were also compared for both systems to examine whether the two atlases assessed similar severity of radiographic features.
STATISTICAL ANALYSIS
Measurement of agreement was quantified using the unweighted κ (kappa) statistic.19 Average κ values among the three observers were calculated as appropriate.20 Interpretation of the κ statistic was according to published recommendations.21 Comparison of grades between the two systems was by the Wilcoxon signed rank test.
Results
DEVELOPMENT OF THE LINE DRAWING ATLAS
For the convenience of this paper the atlas illustrations (figs 1-12) are reproduced in reduced size, but all are available in the correct size on theAnnals web site (www.annrheumdis.com). The drawings were arranged in the order of joint space narrowing for women, osteophyte for both sexes, then joint space narrowing for men. Illustrations for joint space narrowing for women include the medial tibiofemoral (fig 1), lateral tibiofemoral (fig 2), lateral patellofemoral (fig 3), and medial tibiofemoral (fig 4) compartments. Illustrations of osteophyte include all tibiofemoral sites (fig 5), the optional shape for osteophyte on the lateral tibial plateau (fig 6), all patellofemoral sites (fig 7), and the optional shape for osteophyte on the medial femoral trochlea (fig 8). Illustrations for joint space narrowing for men follow the same order as for women—that is, the medial tibiofemoral (fig 9), lateral tibiofemoral (fig 10), lateral patellofemoral (fig 11), and medial patellofemoral (fig 12) compartments.

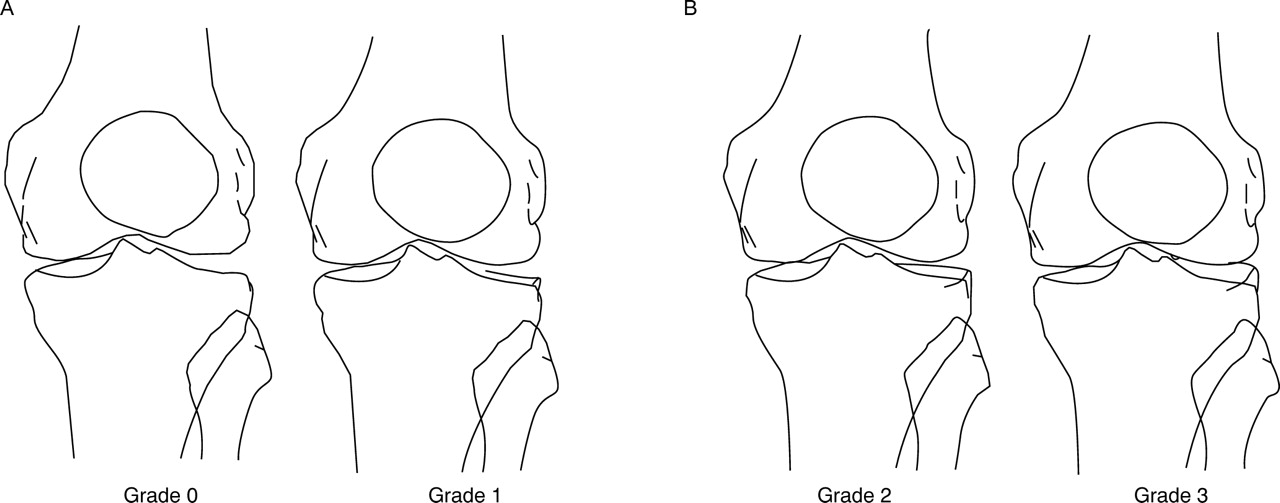
Medial tibiofemoral joint space narrowing for women. (A) Grades 0 and 1; (B) grades 2 and 3.

Lateral tibiofemoral joint space narrowing for women. (A) Grades 0 and 1; (B) grades 2 and 3.

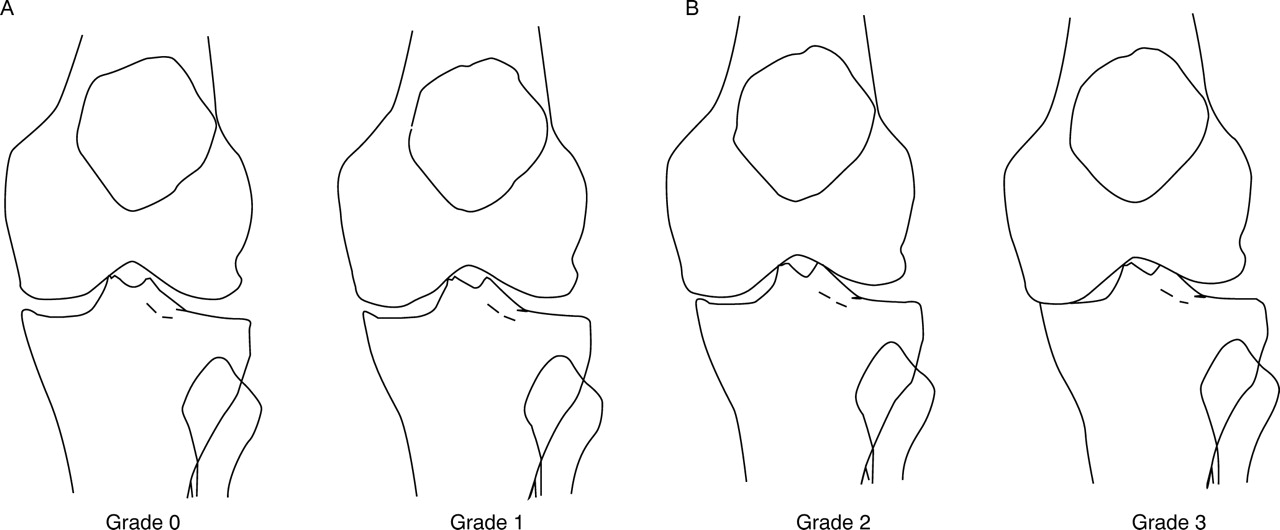
Lateral patellofemoral joint space narrowing for women. (A) Grades 0 and 1; (B) grades 2 and 3.

Medial patellofemoral joint space narrowing for women. (A) Grades 0 and 1; (B) grades 2 and 3.

Osteophytes in all tibiofemoral sites. (A) grades 0 and 1; (B) grades 2 and 3.
Lateral tibial osteophyte (optional shape). These figures are applicable when the shape of lateral tibial osteophyte is considerably different from that of fig 5. (A) Grades 0 and 1; (B) grades 2 and 3.

Osteophyte in all patellofemoral sites. (A) Grades 0 and 1; (B) grades 2 and 3.

Medial femoral trochlear osteophyte (optional shape). These figures are applicable when the shape of the medial femoral trochlea osteophyte is considerably different from that of fig 7. (A) Grades 0 and 1; (B) grades 2 and 3.

Medial tibiofemoral joint space narrowing for men. (A) Grades 0 and 1; (B) grades 2 and 3.

Lateral tibiofemoral joint space narrowing for men. (A) Grades 0 and 1; (B) grades 2 and 3.

Lateral patellofemoral joint space narrowing for men. (A) Grades 0 and 1; (B) grades 2 and 3.

Medial patellofemoral joint space narrowing for men. (A) Grades 0 and 1; (B) grades 2 and 3.
REPRODUCIBILITY FOR THE OARS AND LINE DRAWING ATLASES
Table 1 shows the within observer reproducibility for joint space narrowing and osteophyte at each site. Reproducibility for both features was generally good using either atlas, though joint space narrowing showed better reproducibility than osteophyte. Medial patella osteophyte showed the lowest κ scores in both systems. κ Values, especially for narrowing, were generally higher using the line drawing atlas.
Intraobserver reproducibility for individual radiographic features among the three observers for the Osteoarthritis Research Society (OARS) and line drawing atlases. The mean of the three intraobserver κ coefficients is shown, with the range for the individual observer κ coefficients in parentheses
Reproducibility between observers was lower than the within observer agreement (table 2). The same trends were seen as for within observer reproducibility, with better values for narrowing than for osteophyte, and the lowest values occurring for medial patellar osteophyte. Overall there was no clear difference between the two systems. Reproducibility did not improve with the second readings (individual observer scores not shown).
Interobserver reproducibility for individual radiographic features among the three observers at the first and second reading for the Osteoarthritis Research Society (OARS) and line drawing atlases. Interobserver κ coefficients were calculated for a triad among the three observers and for three pairs between two observers. The range of the κ coefficients for three pairs between two observers is shown in parentheses
DISCORDANCE BETWEEN THE OARS AND THE LINE DRAWING ATLASES
Comparison of the two atlas systems was made for grades obtained for each feature. Several significant differences were observed for data obtained at the first reading (tables 3-7). Grades for joint space narrowing of the lateral tibiofemoral compartment (table 3) were significantly lower (p<0.001), whereas those for the lateral and medial patellofemoral compartments (tables 4 and 5) were significantly higher (p<0.001), in the line drawing atlas than in the OARS atlas. No differences were seen for grading of medial tibiofemoral joint space narrowing. Grades for lateral tibial osteophyte (table 6) were higher (p=0.029), whereas grades for medial femoral osteophyte (table 7) were lower (p<0.001), in the line drawing atlas than in the OARS atlas. No differences were seen for other osteophyte grades. The same differences and similarities were seen for grades obtained at the second reading (data not shown).
Discordance between grades for lateral tibiofemoral joint space narrowing (JSN) using the Osteoarthritis Research Society (OARS) and line drawing atlases. All scores graded by the three observers at the first reading are shown
Discordance between grades for lateral patellofemoral joint space narrowing (JSN) using the Osteoarthritis Research Society (OARS) and line drawing atlases. All scores graded by the three observers at the first reading are shown
Discordance between grades for medial patellofemoral joint space narrowing (JSN) using the Osteoarthritis Research Society (OARS) and line drawing atlases. All scores graded by the three observers at the first reading are shown
Discordance between grades for lateral tibial osteophyte using the Osteoarthrits Research Society (OARS) and line drawing atlases. All scores graded by the three observers at the first reading are shown
Discordance between grades for medial femoral osteophyte using the Osteoarthritis Research Society (OARS) and line drawing atlases. All scores graded by the three observers at the first reading are shown
All three observers subjectively found the line drawing atlas easy and relatively quick to use (their assessments were not timed). All three preferred it to the OARS atlas.
Discussion
Radiographic assessment is the principal method for the evaluation of structural change in OA.22 There are several systems for grading the individual radiographic features of knee OA.23 The “OARS” atlas developed by Altmanet al is generally considered the current standard photographic atlas,13 and includes the skyline view for assessment of the patellofemoral compartment. Unlike compilers of previous atlases, we have developed a series of line drawings for grading of joint space narrowing and osteophyte in the three compartments of the knee. We have shown this grading system to be comparable with the OARS atlas for intraobserver and interobserver reproducibility. Unlike the OARS atlas it gives different options for joint space narrowing for men and women. Our three observers found the atlas easy and relatively quick to use and preferred it to the OARS atlas. Certain differences were consistently noted in the grades given by the two atlases for the same x ray film. In the absence of any gold standard, we suggest that the logical derivation of the line drawing atlas gives this grading system greater face validity.
Individual features, such as cyst, sclerosis, or bony contour, not only have less reproducibility for grading systems than narrowing and osteophyte7 ,10 ,23-25 but also do not readily lend themselves to illustration. We therefore included only narrowing and osteophyte in the line drawing atlas. These two are regarded as the principal features of OA and are particularly important in assessment of progression.24 ,26-28 We chose to illustrate the standing, fully extended anteroposterior, and skyline views as these were the standardised positions that had been used in our recent studies10 ,14 ,18 and because the skyline view has better reproducibility than the lateral flexion view10 and shows closer association between structural change and symptoms.11 We considered that should this initial experiment prove successful the line drawing method could be applied to other radiographic views of the knee and to other joints that are target sites for OA.
When developing the atlas we elected to provide “options” for two situations. Firstly, because normal joint space widths at the knee differ between men and women14 we devised separate illustrations for joint space narrowing for men and women. Secondly, when examining films for osteophyte we noted marked variability in osteophyte shape in the lateral tibial and medial trochlear sites. We therefore provided additional illustrations to take this into account. Such options are unique to this atlas. However, both are logical to include, and help in the practical grading of knee films.
As expected from previous studies,10 ,24 ,25 ,29intraobserver reproducibility was better than interobserver reproducibility for both atlases. κ Values for individual features were similar for the two atlases, though more commonly favouring the line drawing atlas. As previously reported10 ,29-31grading of joint space narrowing was more reproducible than osteophyte. With both atlases reproducibility appeared to vary according to joint site. Interestingly, unlike one previous report,25 we did not see any clear influence of reader experience. Also, we did not detect a learning effect between the first and second readings. This suggests that our training—namely, practice scoring of five sets of bilateral knee films followed by a two hour detailed group discussion, was efficient in bringing observers to a reasonable and consistent standard.
The discordance between the two atlases is clearly important and shows that they are not equivalent instruments. In particular, higher scores for patellofemoral narrowing and lower scores for osteophyte, particularly medial femoral osteophyte, were found with the line drawing atlas, compared with the OARS atlas. This presumably relates to the wider normal joint space (grade 0) presented in the line drawing atlas and the fact that osteophyte grades in this atlas were calculated as fractions of the largest osteophytes found in a hospital based sample. We believe that the lateral tibial and medial patellar osteophytes represented in the OARS atlas are the typical but uncommon shape for osteophyte at these sites (Nagosa Y et al, unpublished data), and that grades of joint space narrowing in the lateral tibiofemoral and lateral patellofemoral compartments are far from linear. We feel that the line drawing atlas has more representative images of common osteophyte shape and direction at all sites (Nagosa Y et al, unpublished data), and because the grades of osteophyte and joint space narrowing are arithmetically calculated they are logically justified. Future studies are required to determine whether employment of such an interval rather than ordinal scale produces differences in population study findings or assessment of knee OA progression.
There are several potential caveats to this study. The three observers were aware of the aims of the study and may have shown bias towards the new atlas. Their similar scores for reproducibility, however, argue against this. The illustrations were drawn by an orthopaedic surgeon (YN) rather than a professional medical artist and possibly, therefore, could have been better. We assessed only one set of films from each subject and cannot comment on how the atlas performs in the assessment of OA progression. However, since most investigators assess progression by blinded grading of masked, unpaired films (that is, two separate assessments), or by alternative methods, such as direct measurement of minimum joint space width or computerised calculation, the omission of serial films does not detract from the justification of this logically derived system.
We feel that a logically derived line drawing system has important theoretical and practical strengths compared with photographic atlases and have shown that such an atlas devised for the knee has good reproducibility compared with the standard OARS atlas. Key advantages of the line drawing atlas are mathematical calculation of grades from normal joint space width and maximum size of osteophyte, giving excellent face validity; separate illustrations for grading of joint space narrowing for men and women; separate presentation of individual features, without distraction from other accompanying OA changes; reduced number of illustrations and pages, making it user friendly; and ease and low cost of reproduction. Further developments of this system that might be envisaged include an increase in the number of grades, for example four or five (we chose the traditional 0–3 to permit comparison with the OARS atlas); inclusion of a minus 1 grade for joint space width, to record joint spaces that are thicker than the mean for each sex; development of similar atlases for other joints affected by OA; and production on transparencies that may be directly overlaid onto the x ray film. We would strongly support the development of a logically derived, unifying atlas for OA target sites that used the advantages afforded by line drawings.
Acknowledgments
The authors thank Dr Sheila O'Reilly for her help in the selection of radiographs for scoring, and Miss Joy Stevenson for statistical advice.