Article Text

Abstract
Objective To use the meta-analytical procedures to determine the magnitude of the effect of exercise-induced dehydration (EID) upon time-trial (TT) exercise performance.
Methods Studies were located via database searches and cross-referencing. TT performance outcomes were converted to mean percentage changes in power output. Random-effects model meta-regressions, analogue to the ANOVA and weighted mean effect summaries were used to delineate the effect of the EID-associated body weight (BW) loss on TT performance.
Results Five research articles, all using cycling TTs, were included, producing 13 effect estimates and representing 39 subjects. The mean ambient temperature, relative humidity, exercise intensity and duration of the exercise trials were 26.0±6.7°C, 61±9%, 68±14% of VO2max and 86±34 min, respectively. The effect of EID (mean BW loss of 2.20±1.0%) during self-paced exercise conditions was to produce a non-significant increase in endurance performance of 0.06±2.72% (p=0.94), compared with the maintenance of euhydration (mean BW loss of 0.44±0.48%). Meta-regression analyses revealed a statistically significant relationship between the percentage changes in power output and exercise intensity and duration, but not with the EID-associated percentage changes in BW loss. Drinking according to the dictate of thirst was associated with an increase in TT performance compared with a rate of drinking below (+5.2±4.6%, p=0.01) or above (+2.4±5.0%, p=0.40) thirst. The probability that drinking to thirst confers a real and meaningful advantage on TT performances conducted under field conditions compared with a rate of drinking below and above thirst sensation is of the order of 98% and 62%, respectively.
Conclusions (1) Compared with euhydration, EID (up to 4% BW loss) does not alter cycling performances during out-of-door exercise conditions; (2) exercise intensity and duration have a much greater impact on cycling TT performances than EID and; (3) relying on thirst sensation to gauge the need for fluid replacement maximises cycling TT performances.
Statistics from Altmetric.com
Introduction
The idea that exercise-induced dehydration (EID) impairs endurance performance (EP) is, in general, well entrenched among exercise scientists, coaches, athletes, nutritionists and health practitioners. The fact that EID alters several key physiological functions during exercise adds much credibility and support to this concept.1 In the latest Position Stand of the American College of Sports Medicine on Exercise and Fluid Replacement, it is indicated that EP starts declining at, and therefore athletes should consume enough fluid during exercise to prevent, a body weight (BW) loss ≥2%.2
Fluid intake guidelines are designed and formulated for, and used and followed by, field athletes performing exercise under real-world out-of-door conditions with the ultimate goal to cover a set distance as quickly as possible or as much distance as possible in a set amount of time.
Yet, when the literature pertaining to the effect of EID on EP is closely examined and inspected, it can be realised that, out of the 13 studies which used time-trial (TT) type exercise protocols simulating real-world conditions, none observed a statistically significant ‘deleterious’ effect of EID upon EP.3,–,7 Interestingly, during a 1 h cycling TT, Robinson et al3 even demonstrated that an EID level of 2.3% BW significantly improved EP, compared with euhydration.
The idea that an EID level ≥2% BW must be prevented to maximise EP derives for the large part from findings of studies that used fixed-power output or incremental tests to exhaustion to evaluate the impact of EID upon EP.8,–,15 These tests with no known end points are unrepresentative of out-of-door exercise conditions faced by field athletes and therefore possess a very low ecological validity, which therefore question their value and relevance in the design of fluid intake guidelines aimed at maximising endurance athlete performances. Below et al16 did show that an EID-associated BW loss of 2% reduced performance during an approximately 10 min long cycling TT, but it is worth noting that this TT was preceded by 50 min of fixed work rate, thereby substantially reducing the external validity of their results.
In a recent editorial paper,17 Mündel postulated, based on the apparent dichotomy of results between studies using TT exercises and exercise to exhaustion tests, that there was a need to re-examine the literature on hydration and exercise performance. Therefore, the goal of this study was specifically to examine and determine the magnitude of the impact of EID upon TT, self-paced exercise performances using the meta-analytical approach. Results of the present meta-analysis should represent and provide to field athletes and coaches the best available evidence yet of the effect of EID during real-world exercise conditions.
Methods
Search strategy
To locate the articles of interest, a thorough search of the scientific literature using PubMed (which includes the new and old MEDLINE) and SPORTDiscus databases was performed. The MeSH headings that were used, either alone or in combination, were ‘hydration,’ ‘dehydration,’ ‘hypohydration,’ ‘fluid balance,’ ‘exercise,’ ‘exercise-capacity,’ ‘performance,’ ‘endurance performance,’ ‘endurance capacity’ or ‘time-trial performance.’ The search of literature was limited to English-language citations. An extensive manual search of the reference sections of all articles that were found during the electronic search in addition to those of two published narrative review articles1 18 on the topic was also made. Case studies, published abstracts, conference proceedings, dissertations or manuscripts published in non-peer-reviewed journals were not admissible for revision. Abstracts of all potential articles were thoroughly read, and a further evaluation of the method sections was performed when reported in the abstract that an intervention looking at the effect of EID, dehydration or hypohydration on exercise capacity, performance or EP was performed. Otherwise, articles were discarded. The last literature day search was performed on 10 July 2010.
Inclusion and exclusion criteria
Statistical and meta-analytical computations were made from results of studies that met all of the following criteria: (1) laboratory-controlled study; (2) hypohydration was induced during, not before, exercise; (3) fluid replacement was given orally; (4) data needed to calculate the percentage changes in power output, effect estimates, variances and percentage BW losses were reported; (5) BW loss level in the more-dehydrated experimental group was ≥1% and ≥0.45% than the control group (euhydration group) hydration level; (6) owing to the inherent difficulty in maintaining perfect euhydration during exercise, up to a BW loss or gain of 1% was deemed acceptable for the less-dehydrated control group; (7) if sports drinks were used as a means to hydrate subjects during the control condition, subjects in the experimental condition had to receive the same amount of carbohydrate; (8) EP was assessed in compensable exercise-heat stress, that is in an environment allowing effective thermoregulation; and (9) TT type exercise protocols simulating real-world exercise conditions with known end points to test EP were used. Any exercise protocols using incremental or fixed-power output intensity throughout or only during a part of exercise were excluded from the analysis.
Data extraction
Coding sheets with operational definitions were developed and used for this investigation. When necessary, corresponding authors were asked whether they would be willing to provide the raw experimental data of TT performance-related outcomes or any key parameters (p values, CIs, SDs or SEs of the EP changes) needed to calculate studies' variances and concomitant weighting factors. The coded variables included (1) studies' characteristics; (2) subjects' physical and fitness characteristics; (3) exercise protocol characteristics; (4) environmental condition characteristics; (5) pre- and postexercise BWs; and (6) percentage changes in power output between hydration conditions.
Measurement of exercise duration
In the current analysis, exercise duration time is reported in minutes and represents the total exercise time subjects completed over the entire TT exercise protocols. For the study by Dugas et al,7 the total duration of exercise was considered to represent the average of the control and experimental group TT times.
Measurement of exercise intensity
The intensities at which the exercise sessions were completed are reported as, and represent, the mean percentage of the athletes' maximal oxygen consumption (VO2max) used to perform the TT exercise protocols. Backx et al5 as well as Kay and Marino6 reported baseline subjects' mean VO2max and the mean power outputs at which the TT were completed without, however, indicating at which percentage of VO2max the exercise protocols were conducted. For those studies, the relationship between mean exercise power output and VO2 relative to VO2max was used to determine exercise intensity.19 In Dugas et al's7 study, which did not report subjects' baseline mean VO2max or the mean intensities at which the exercise sessions were completed, but which did report subjects' baseline mean peak power output and the mean power outputs maintained during the exercise protocols, mean exercise intensities were established with the relationship between VO2 and power output19 with the mean VO2max estimated using the validated equation of Hawley et al.20 For the study by Bachle et al,4 the mean exercise intensity was established by using estimated maximal heart rate,21 the mean heart rate at which the exercise protocols were conducted, and by converting the percentage maximal heart rate at which the exercises were conducted to a mean percentage VO2max using the formula of Londeree et al.22
Measurement of dehydration level
For the purposes of the present analysis, the percentage BW loss observed at the end of exercises was considered to represent, and is taken as, the level of EID. Although it is acknowledged that the assessment of EID using changes in BW lacks precision and has been the object of some criticism lately,23 for the field athletes and coaches as well, resorting to this parameter is the only realistic and reliable method that can be used to estimate EID level. For five studies,7 percentage BW losses were taken as the values directly provided and found in the research paper. For six studies,5 6 percentage BW losses were measured as follows: values of BW losses provided in the research papers/mean baseline BW (kg) measured during the pre-experimental procedures (due to absence of pre-exercise BWs)×100−1. Percent BW losses were measured as follows for two studies:3 4 (pre-exercises BW (kg)–postexercises BW (kg))/pre-exercises BW (kg)×100−1.
Measurement of EP
All studies measured mean maintained power outputs during exercise, and hence the percentage changes in EP were measured using the following formula: (experimental (more dehydrated) group mean maintained power output during exercise–control (less dehydrated) group mean maintained power output during exercise)/control group mean maintained power output during exercise×100−1. All researchers were personally contacted to provide raw experimental data. Among the five research articles included in the analysis, raw TT performance data for nine studies were obtained.5 7 According to Hopkins,24 a 1% change in power output equals a change of 0.4% in road cycling TT time.
Effect of thirst sensation on TT performance
Despite the limited experimental evidence existing to support his idea, Noakes18 recently argued that it is likely the development of thirst that impairs exercise performance, not the effect of EID per se. It is also still unknown what kind of effect drinking above thirst could have on the performance of athletes exercising under real-world exercise conditions. Consequently, this meta-analysis also examined and tested the effect of drinking under or above thirst sensation on TT performances. Results from two research articles5 7 and eight individual studies allow for such comparisons.
Statistical analyses
Statistical analyses were performed with SPSS version 12.0.0 (Chicago, Illinois), SPSS macros developed by Lipsey and Wilson25 and with Comprehensive Meta-Analysis version 2.2.048 (Englewood, New Jersey). Unless otherwise noted, all data are reported as mean±SD, and statistical significance was set at p≤0.05. All included studies used a pre–post research protocol where subjects acted as their own control. In order to calculate the mean weighted effect summary, each study was assigned a weight consisting of the reciprocal of the total variance for the net percentage change in power output.26 Variances were directly calculated from the reported ΔSEs or SDs of the net percentage changes in power output. Missing variances for net percentage changes in power output were calculated from individual and exact p values or, when not exactly reported, from p values equal to X, where X is any p value ≤0.05.27 For example, if a study reported a p value of ≤ 0.05, the α value for that study was considered representing and taken as p=0.05. When only p>0.05 was reported, individual variances for net percentage changes in power output were estimated with the following formula:28

where SD is the standard deviation, R is the correlation coefficient, A is the SD of control group, B is the SD of the experimental group, and N is the study's number of subjects. R was imputed27 and taken as 0.61, which represents the average correlation coefficient computed from the raw experimental results of nine individual studies provided by two researchers.5 7 95% CIs were used to establish statistical significance. If the 95% CI included 0, it was therefore concluded that there was no statistically significant effect.
Weighted mean effect summary
The weighted mean effect summaries were computed using random-effects models. For research articles that included more than one effect estimate, each outcome was treated independently. However, for the overall effect of EID on TT performance only, a separate statistical analysis was performed with only one effect estimate and weighting factor per research article to determine whether it would change the overall outcome of the effect of EID on EP. This statistical procedure could not be performed for the overall effect of thirst sensation on EP owing to an insufficient number of research articles. The qualitative interpretation of the practical significance of the effect of EID on the percentage change in power output under real-world conditions was computed using the spreadsheet developed by Hopkins.29 The smallest worthwhile percentage change in power output was determined for long-distance cyclists and set at 1.6%, based on an average typical variation in competition time of 1.3%.30 The smallest worthwhile percentage change in power output was obtained by multiplying the variation in competition time by 0.5,31 and then by transforming the threshold competition time to a threshold for cycling power output.24 The smallest worthwhile percentage change in power output was calculated for cyclists only, as all of the included studies solely used cycling TT exercise protocols.
Meta-regression and subgroup analyses
In order to determine the influence of continuous or categorical variables on the percentage change in EP, method of moment random-effects meta-regression analyses or analysis–of–variance-like (analog to the ANOVA) procedures were performed using a priori identified variables.
Evaluation of heterogeneity
Between-study heterogeneity was assessed using the Cochran Q test, with p≤0.01 indicating significance,26 and formally quantified by the I2 statistic, with values less than 25% indicating low, 25–50% indicating moderate and greater than 50% indicating high heterogeneity.32
Publication bias
Potential publication bias was examined with a funnel plot visual inspection and statistically tested using the Begg test and the Egger test.26
Results
Search results
After thoroughly evaluating and reading the titles and abstracts of potential eligible research articles, the databases as well as manual searches identified a total of 20 manuscripts3,–,16 33,–,38 that could potentially be included in, and suitable for, the present meta-analysis. Of these 20 research investigations, in the end a total of five met all of the inclusion criteria.3,–,7 The research article by Marino et al38 was excluded from the analysis, as the TT results are an exact duplicate of those found in Kay and Marino.6 Among the included research manuscripts, two individual studies were performed in the research paper of Kay and Marino,6 four in Backx et al's5 paper, five in Dugas et al's7 paper and one in each of the investigations of Bachle et al4 and Robinson et al.3 Thus, the research yielded a total of 13 completed individual studies. Hence, for the final analysis, 13 effect estimates were computed from a total of five research manuscripts. A concise description of the characteristics of protocols used by each of the included studies is presented in table 1.
Summary of protocols' characteristics that evaluated the effectiveness of exercise-induced dehydration on TT performances
Characteristics of the included research investigations
The 13 studies were published from four different peer-reviewed journals. Three of these journals are indexed in PubMed. The publication dates ranged from 1995 to 2009, with one research investigation published in the 1990s,3 and all the remainder between the years 2001 and 2009.4,–,7 One research investigation was performed in the UK,5 one in Australia,6 two in South Africa3 7 and one in the USA.4 All studies were conducted from academic institutes.
Description of subjects
A total of 39 subjects were represented in the five research manuscripts included in the current analysis. The mean sample size of studies was 7.2±1.2 subjects (range 6–10 subjects). Men and women represented 82% and 18% of all subjects, respectively. The mean age, weight, height and relative VO2max (N=12 studies) of subjects were 25±3 years, 73±4 kg, 178±4 cm and 68±10 ml/kg/min, respectively. None of the studies provided information about subjects' ethnicity.
Exercise modes
All studies used cycling TTs.
TT protocol characteristics
Dugas et al7 used an 80 km TT, whereas the remaining studies3,–,6 used a TT protocol where subjects had to cover the greatest possible distance in 60 min.
Environmental conditions and exercise intensity
The mean ambient temperature, relative humidity, exercise intensity and duration of the exercise trials were 26.0±6.7°C (range 19.8–33.2°C), 61±9% (range 50–72%), 68±14% of VO2max (range 52–85% of VO2max) and 86±34 min (range 60–128 min), respectively.
Dehydration level
The mean experimental group's BW loss at the end of exercise was 2.18±1.0% (range 1.00–4.30%), whereas that of the control group was 0.44±0.48% (range –0.92–0.82%), for a mean difference in hydration level between research conditions of 1.74±1.01% (95% CI 1.12% to 2.35%). Seven studies were completed with a BW loss <2%, whereas six were terminated with a BW loss of ≥2%.
EP and EID
Weighted mean effect with CIs and practical importance of the effect estimate
Figure 1 presents the percentage changes in power output of all studies included in the present meta-analysis along with the 95% CIs and the practical importance of the weighted mean effect summary. Using a random-effects model, results from across all studies indicated that EID increases power output by a mean of 0.06±2.72% (95% CI –1.42% to 1.54%, N=13), compared with an exercise situation where euhydration is attempted to be maintained. Considering that the smallest deleterious change in power output that matters to the EP of competitive long-distance cyclists would be one of 1.6%, the result from the current forest plot indicates that 95% of the time the positive effect of an end-of-exercise dehydration level of 2.2% BW (mean percentage BW loss of all 13 studies included in the forest plot) should produce a trivial change on the performance of long-distance cyclists in field conditions. When using one mean effect estimate per research article, the increase in EP with EID reached 1.42±2.45% (95% CI –0.73% to 3.57%, N=5), which was not significantly different from when all 13 effect estimates were combined and used to produce a weighted summary effect (p=0.36).

Forest plot of the percentage changes in power output with exercise-induced dehydration observed in each study along with the qualitative interpretation of the importance of the overall effect on time-trial performance. An open lozenge (◊) represents the mean weighted effect estimate. The black line represents the minimal decline in power output required to affect long-distance cycling performance negatively in a practical and meaningful way. A random-effect model was used. Results are means±95% CIs. Letters in parentheses match those found in Table 1.
EP and thirst sensation
Drinking according to the command of thirst was associated with an increase in power output compared with a rate of drinking below (+5.2±4.6%, p=0.01, range of power output gain: 0.03–12.79%, N=5) and above (+2.4±5.0%, p=0.40; range of power output gain: 0.94–4.58%, N=3) thirst sensation. The magnitude of the changes in EP between the rate of drinking below and above thirst sensation was not statistically significant (p = 0.43). The end-of-exercise BW loss was 1.65±0.63%, 2.81±1.32% and 1.03±0.76% for ad libitum drinking, drinking below thirst sensation and drinking above thirst sensation, respectively. The probability that drinking to the dictate of thirst confers a real and meaningful practical advantage on TT performances under field conditions compared with drinking below and above thirst sensation is of the order of 98% and 62%, respectively.
Meta-regression analyses
Association between power output and EID
Figure 2 presents the relationship between the percentage changes in power output and the percentage changes in BW loss from euhydration to EID observed at the end of exercise across all included studies. The result of the weighted random effect meta-regression was non-significant (r=0.27, p=0.36, N=13). The regression equation remained non-significant when the percentage changes in power output were correlated with the end-of-exercise percentage BW losses (r=0.22, p=0.45, N=13).

Correlation between percentage changes in body-weight loss and percentage changes in power output.
Association between power output and exercise protocol characteristics and environmental conditions
Exercise intensity (r=0.64, p=0.01, N=13) (figure 3) and duration (r=0.51, p=0.05, N=13) (figure 4) correlated with the EID-associated percentage changes in power output, whereas relative humidity did not (r=0.16, p=0.60, N=13) (figure 5). Likely because of a lack of statistical power, there was only a tendency for ambient temperature to be associated with the EID-associated percentage changes in power output (r=0.48, p=0.07, N=13) (figure 6). The relationship between the percentage changes in power output and exercise duration (p=0.01) and intensity (p=0.004) still persisted after adjusting for the effect of EID and that between the percentage changes in power output and ambient temperature became significant (p=0.02).

Correlation between exercise intensity and percentage changes in power output.

Correlation between exercise duration and percentage changes in power output.

Correlation between relative humidity and percentage changes in power output.
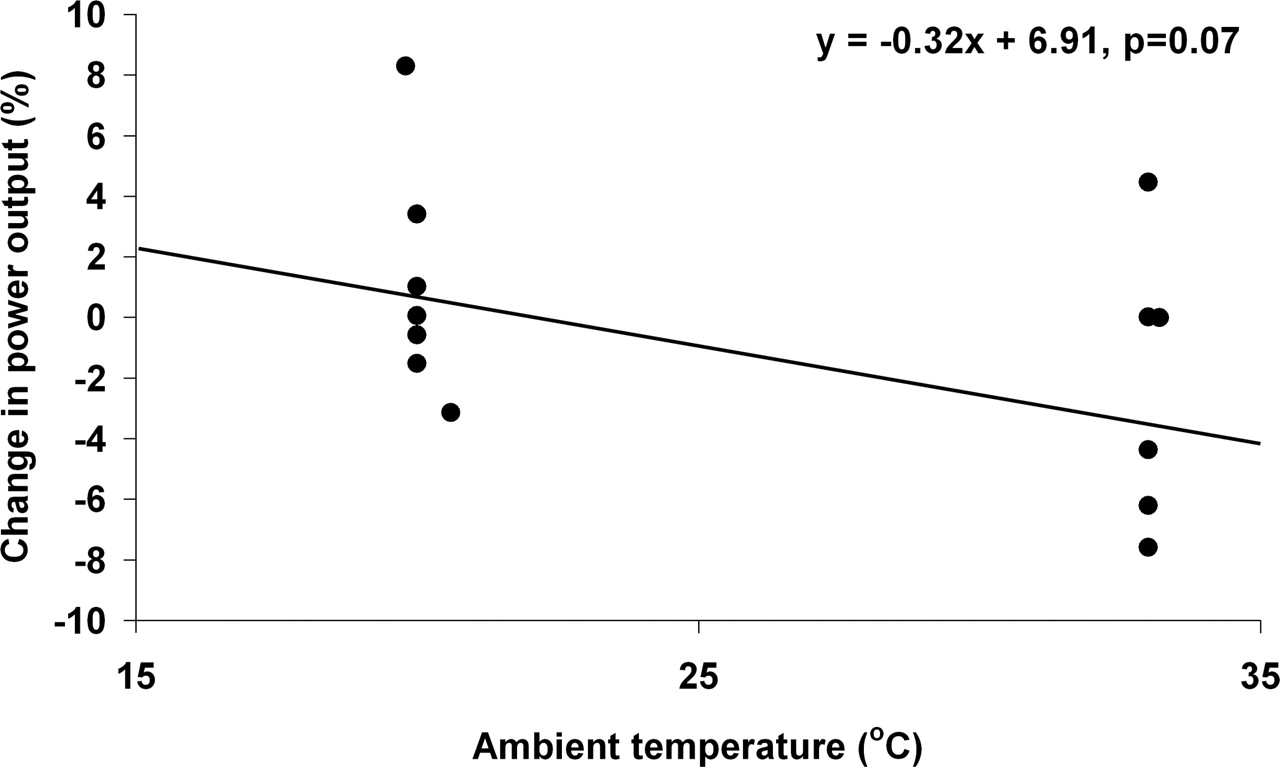
Correlation between ambient temperature and percentage changes in power output.
Subgroup analyses
Impact of studies with end- of- exercise BW losses ≤ 2% or > 2% on EP
Results of the random-effects analog to the ANOVA indicated that there is no-significant difference in the percentage change in power output between studies with an end-of-exercise total BW loss < 2% or ≥ 2% (p=0.70). In the former group of studies, power output fell with EID by 0.14±2.43% (95% CI –1.93% to 1.65%, mean ΔEID between hydration conditions of 1.11±0.57%), whereas in the latter group it increased by 0.51±3.65% (95% CI –2.41% to 3.44%, mean ΔEID between hydration conditions of 2.46±0.97%).
Impact of exercise protocol characteristics and environmental conditions on EP
In studies where the ambient temperature was <30°C,3,–,6 the change in EP with EID was not significantly different from that where the ambient temperature was ≥30°C6–7 (0.49±1.75%, 95% CI –0.80% to 1.80% (mean ΔEID between hydration conditions of 1.11±0.56%) vs –3.65±5.33%, 95% CI –7.93% to 0.62% (mean ΔEID between hydration conditions of 2.50±1.00%), p=0.07). In studies with a duration of 60 min,3,–,6 the change in EP with EID was significantly different from that where the exercise duration exceeded 60 min7 (0.48±1.75%, 95% CI –0.75% to 1.72% (mean ΔEID between hydration conditions of 1.25±0.65%) vs –4.20±5.20%, 95% CI –8.76% to 0.37% (mean ΔEID between hydration conditions of 2.52±1.06%), p=0.05). In studies[4–7] where a mean exercise intensity <80% was maintained during exercise, the change in power output with EID was significantly different than that where an exercise intensity ≥80 [3 5-6] was maintained (-4.11 ± 5.43%, 95% CI: -8.47 to 0.24% (mean Δ EID between hydration conditions of 2.40 ± 1.00%) vs. 0.50 ± 1.64%, 95% CI: -0.71 to 1.71%, (mean Δ EID between hydration conditions of 1.17 ± 0.65%), P = 0.045).
Sensitivity analysis
A sensitivity analysis demonstrated that the overall weighted mean effect summary and its statistical significance were consistent across studies and did not depend on any single effect estimate.
Heterogeneity
No significant heterogeneity was observed across studies (Q=14.94, p=0.25), with an I2 value of 20%, suggesting that the magnitude of heterogeneity was low.
Publication bias
Visual inspection of the funnel plot suggests no publication bias (figure 7). In support of this observation, formal statistical tests for publication bias that include the rank-correlation test of Begg and Mazumbar (τ=0.064, p=0.38) and the test of Egger (intercept: –0.38 (95% CI –1.57 to 0.80, p=0.24)) were not significant.

Funnel plot of the relationship between percentage changes in power output and precision of the effect estimates (1/SE). The black line represents the mean weighted summary effect.
Discussion
This is the first ever meta-analysis to be conducted evaluating the effect of EID-associated BW loss upon TT exercise performances. Although the exercise protocols used by all research articles included in the current meta-analysis were performed under controlled laboratory settings, it remains that their findings are those that best reflect and come closest to the performances that can be achieved by athletes during real-world, out-of-door exercise conditions. The external and ecological validity of self-paced exercise protocols with known termination points is high, and consequently, their findings can be confidently transferred and applied to field athletes. The results of the present meta-analysis are in sharp contradiction with the message that has been conveyed by the scientific literature for quite a long time1 2 and indicate that, under real-world exercise conditions, EID does not alter EP in a statistical as well as a practical manner in trained cyclists, compared with the maintenance of euhydration.
The result of the weighted mean effect summary indicates that, compared with euhydration, the effect of EID under TT exercise conditions is to improve, albeit in a non-statistical fashion, rather than decrease EP. More exactly, using a random-effects model, a mean BW loss of 2.2% was found to increase power output by a mean of 0.06%, compared with an exercise situation where attempts were made to maintain euhydration. Importantly, however, it should be noted that 95% of the time, the magnitude of the ‘positive’ effect of EID upon time TT performance should, under real-world conditions, produce only a trivial change on the performance of long-distance cyclists. In other words, under real-world exercise conditions, these results indicate that EID should produce no practical gain or loss in EP. The present results therefore refute the idea that athletes' EP will start declining from an EID-associated BW loss of ≥2% under self-paced, out-of-door exercise conditions.
What is already known on the topic
Current fluid-replacement intake guidelines are based on results deriving from studies using both realistic (self-paced exercise) and unrealistic (fixed-power output or incremental tests to exhaustion) exercise conditions and indicate that an EID-associated BW loss of ≥2% impairs EP.
What this study adds
▶ Based on the results of studies that used self-paced exercise protocols to test the effect of EID upon EP, findings from the present meta-analysis demonstrate that EID (up to 4% BW loss) does not alter EP under real-world exercise conditions, compared with the maintenance of euhydration.
▶ Relying on thirst sensation to gauge the need for fluid replacement will maximise EP.
▶ Future studies looking at the relationship between EID and EP must use TT type exercises and a control group drinking according to the dictate of thirst.
▶ Fluid-intake guidelines will have to be modified to account for the present findings.
This meta-analysis is the first to test the theory and show that following thirst sensation as a means to gauge one's need for fluid replacement during real-world, out-of-door exercise conditions maximises TT exercise performance. More exactly, from a statistical point of view, it was shown that drinking to the dictate of thirst significantly improves TT performance compared with a rate of drinking below thirst sensation and, from a practical point of view, that drinking sufficiently to satisfy thirst will provide a real and meaningful performance advantage 98% and 62% of the time compared with a rate of drinking below and above thirst sensation, respectively. Some may argue that it is the greater loss of BW, and not necessarily the greater thirst sensation, associated with drinking below thirst sensation that could explain why TT performance was lower with a rate of drinking below thirst sensation than when the rate of drinking followed thirst sensation. However, because this meta-analysis showed that an EID level of 2.2% BW was not associated with a decrease in TT performance compared with euhydration, it is reasonable to believe that the effect of EID per se was not responsible for the performance advantage conferred by ad libitum drinking over drinking below thirst sensation. Altogether, the findings of this meta-analysis support the theory first developed by Noakes18 suggesting that it is not the effect of EID per se that is responsible for the decrement in EP, but rather the fact of not drinking to the satisfaction of thirst, and contradict and abolish the old and much-believed dogma stating that during prolonged exercise it is of capital importance to drink ahead of thirst, otherwise it is already too late, and EP has already started to decrease.
In the present meta-analysis, the EID-associated percentage changes in power output were significantly associated with exercise intensity and duration, and tended to be related to ambient temperature. However, they were not related to the percentage changes in BW loss. Moreover, it was shown that exercise intensity and duration as well as ambient temperature all have an effect on EP that is over and above that of EID. These results therefore indicate that under self-paced exercise simulating real-world out-of-door conditions, environmental- and exercise-related characteristics have significantly more influence on EP than EID.
Conclusions
The actual fluid-replacement intake guidelines made for and followed by endurance athletes are based on results that derive from studies using both realistic (self-paced exercise) and unrealistic (fixed-power output or incremental tests to exhaustion) exercise protocols. Based on results from studies that use self-paced exercise protocols to test the effect of EID upon EP, findings from the present meta-analysis demonstrate that EID (of up to 4% BW loss) does not alter EP under real-world exercise conditions, compared with euhydration. Moreover, this meta-analysis showed for the first time that drinking according to the dictate of thirst will maximise EP. Very importantly, in all future studies looking at the relationship between EID and EP, the control group should drink according to the command of thirst. In fact, not including such a group could result in a study providing invalid results, as the drinking patterns usually used in hydration studies, that is, full fluid replacement versus no fluid replacement, are potentially those providing the worst outcomes on EP. Until studies looking at the effect of EID under field conditions are conducted, the results of the current meta-analysis therefore represent the best available evidence yet of the effect of EID during out-of-door exercise conditions.
References
Footnotes
-
Competing interests The author reports no conflict of interest with any organisations.
-
Provenance and peer review Not commissioned; externally peer reviewed.