Article Text

Abstract
Background and objectives: Urinary steroid profiling is used in doping controls to detect testosterone abuse. A testosterone over epitestosterone (T/E) ratio exceeding 4.0 is considered as suspicious of testosterone administration, irrespectively of individual heterogeneous factors such as the athlete’s ethnicity. A deletion polymorphism in the UGT2B17 gene was demonstrated to account for a significant part of the interindividual variability in the T/E between Caucasians and Asians. Here, the variability of urinary steroid profiles was examined in a widely heterogeneous cohort of professional soccer players.
Method: The steroid profile of 57 Africans, 32 Asians, 50 Caucasians and 32 Hispanics was determined by gas chromatography–mass spectrometry.
Results: Significant differences have been observed between all ethnic groups. After estimation of the prevalence of the UGT2B17 deletion/deletion genotype (African: 22%; Asian: 81%; Caucasian: 10%; Hispanic: 7%), ethnic-specific thresholds were developed for a specificity of 99% for the T/E (African: 5.6; Asian: 3.8; Caucasian: 5.7; Hispanic: 5.8). Finally, another polymorphism could be hypothesised in Asians based on specific concentration ratio of 5α-/5β-androstane-3α,17β-diol in urine.
Conclusion: These results demonstrate that a unique and non-specific threshold to evidence testosterone misuse is not fit for purpose. An athlete’s endocrinological passport consisting of a longitudinal follow-up together with the ethnicity and/or the genotype would strongly enhance the detection of testosterone abuse. Finally, additional genotyping studies should be undertaken to determine whether the remaining unexplained disparities have an environmental or a genetic origin.
Statistics from Altmetric.com
Testosterone is a steroid hormone naturally produced in the human body and further conjugated with glucuronide and sulphate prior to excretion in urine (phase II metabolism). According to the statistics published by the World Anti-Doping Agency (WADA), testosterone and testosterone prohormones are among the most commonly abused doping agents in sports.1 A comprehensive study showed that testosterone can act as a performance-enhancing substance, particularly when supraphysiological doses are administered.2 Recently, it has been reported that coadministration of growth hormone with testosterone resulted in beneficial changes larger than with either compound alone.3
The ratio of testosterone to epitestosterone glucuronide concentration (T/E) in urine was the first test used to evidence administration of testosterone and related prohormones.4 In 1982, the International Olympic Committee accepted a T/E ratio greater than six as proof of testosterone doping, based on the log-normal distribution of the ratio established from the first population studies. According to the WADA guidelines, the threshold value was changed to 4.0 in order to reduce the proportion of false negatives.5 However, a T/E higher than 4.0 no longer constitutes proof of testosterone misuse, but requires a subsequent confirmation analysis by gas chromatography/combustion/isotope ratio mass spectrometry (GC/C/IRMS). GC/C/IRMS allows measurement of slight differences in 13C/12C ratio of testosterone metabolites. A discrimination is feasible since exogenous testosterone or its precursors contain less 13C than their endogenous homologues.6 7
Steroid profiling includes concentration levels of endogenous steroids in urine as well as their respective ratios.8 9 This approach is widely employed in endocrinology to detect enzyme deficiencies or adrenal problems.10 In antidoping laboratories, the urinary steroid profile usually encompasses the concentration levels of testosterone (T); its inactive epimer, epitestosterone (E); four testosterone metabolites, androsterone (A), etiocholanolone (Etio), 5α-androstane-3α,17β-diol (α-diol) and 5β-androstane-3α,17β-diol (β-diol); and a testosterone precursor, dehydroepiandrosterone (DHEA). The following cut-off concentration levels of endogenous steroids equivalent to the glucuronide: T>200 ng/ml, E>200 ng/ml, A>10 000 ng/ml, Etio>10 000 ng/ml and DHEA>100 ng/ml are considered as putative markers of androgen administration.5 In contrast to absolute steroid concentrations, ratios such as T/E, A/Etio, A/T, α-diol/Ε and α-diol/β-diol are robust to circadian rhythm or changes in physiological conditions such as exercise workload for athletes.11 On the other hand, these parameters may be significantly altered according to the administered steroid and its application mode.
The sensitivity of unique, non-specific thresholds for the detection of testosterone misuse is known to be low.12 13 Since the T/E ratio has a much higher interindividual than intraindividual variability,14 it is not surprising that subject-based thresholds obtained from a longitudinal follow-up of the steroid profiles lead to a dramatically higher sensitivity.13 In addition, studies with Caucasian and Asian populations pointed out significant differences in the excretion of testosterone glucuronides.15 16 17 It was demonstrated that the bimodal distribution of urinary testosterone concentrations is associated with a deletion mutation in the UDP-glucuronide transferase 2B17 (UGT2B17) gene.18 In a subsequent work, subjects deficient in this gene never presented a T/E value higher than 4.0 following a single intramuscular injection of 500 mg testosterone enanthate.19
Although the prevalence of low T/E ratio has been found to be greater for Asians than for Caucasians, the comparison of steroid profiles in a widely heterogeneous cohort of athletes has not been described so far. In this study, the magnitude of urinary steroid levels and their respective ratios are examined for four different ethnic groups: Africans (AF), Asians (AS), Caucasians (CA) and Hispanics (HI). The determination of thresholds specific to the ethnicity and/or the genotype responsible for the testosterone glucuronidation is expected to enhance the detection of testosterone misuse.
Methods
Studied population and sample collection
One hundred and seventy-one male subjects aged from 18 to 36 (mean 24.5 (SD 3.8) years) were recruited among professional soccer teams in six different countries. These athletes were from Argentina (n = 31, mean age 22.9 (3.8)), Italy (n = 19, mean age 28.2 (3.9)), Japan (n = 32, mean age 24.3 (3.2)), South Africa (n = 30, mean age 25.9 (3.8)), Switzerland (n = 31, mean age 24.0 (4.2)) and Uganda (n = 28, mean age 22.8 (2.8)). The athletes were divided into the following groups: AF (n = 57), AS (n = 32), CA (n = 50) and HI (n = 32). The study design has been evaluated and accepted by the ethical committee of the University of Lausanne (Switzerland).
The specimens were not collected during regular antidoping tests. Instead, urine samples were collected in BEREG-KITs (Berlinger AG, Ganterschwil, Switzerland) by a medical officer of each soccer team. All subjects were informed about the aim of the project and the period of sampling. Furthermore, they signed a consent form which stipulated that they did not take any medicine that could influence the steroid profile at least 4 weeks prior to urine collection. After collection, the anonymised samples were sent to the laboratory at the temperature of 4°C. After reception (maximum 5 days after collection), the samples were distributed in 20 ml vials and frozen at −20°C until analysis.
Sample preparation
Urinary steroid profiles were determined by GC-MS according to a routine screening procedure developed for antidoping testing.20 Briefly, 500 ng of methyltestosterone were added as internal standard (IS) into an aliquot of 2.5 ml urine. The urine was extracted onto a C18 solid phase extraction support (500 mg, 6 ml) from Bakerbond (J.T. Baker, Deventer, Holland) conditioned with 5 ml of methanol and 5 ml of water. After a washing step with 5 ml of water, conjugated steroids were eluted with 3 ml of methanol. Thereafter, the eluted fraction was evaporated to dryness prior to a hydrolysis step with 50 μl of β-glucuronidase in 1 ml phosphate buffer (0.2 mol/l, pH 7.0) for 1 h at 50°C. The pH of the hydrolysate was set to pH 8.5–9.0 with solid carbonate buffer, and further extracted by a liquid–liquid extraction with 5 ml n-pentane. Finally, the organic layer was evaporated to dryness and the residue was derivatised with 50 μl MSTFA/NH4I/ethanethiol for 20 minutes at 60°C prior to the analysis by GC-MS.
Instrumentation
Steroid profiles were determined using a Hewlett-Packard 6890 (HP Analytical division, Waldbronn, Germany) gas chromatograph equipped with a HP-1 column (100% dimethylpolysiloxane, 17 m×0.2 mm ID, 0.11 μm film thickness) from Agilent (Palo Alto, CA, USA) directly coupled to a Hewlett-Packard 5973 mass selective detector. The GC system was operated in constant flow mode at a flow rate of 0.8 ml/min of helium. Samples (2 μl) were injected in the split mode (1:10). The injector, transfer line, quadrupole and ion source temperature were set at 280, 280, 150 and 230°C, respectively. The oven temperature was modified as follows: 181°C (0 min) to 230°C (at 3°C/min), then to 310°C (at 40°C/min) and held for 2 minutes. The MS instrument was operated in the electron impact ionisation mode at 70 eV. Single ion monitoring mode with a dwell time of 50 ms was used for quantification. The ions used for quantification were at m/z 432 for T, E and DHEA, m/z 434 for A and Etio, m/z 241 for α-diol and β-diol, m/z 446 for methyltestosterone (IS). The concentration of urinary steroids varies greatly between individuals and also depends upon the specific gravity of the urine sample.21 Accordingly, all concentration values were corrected for a target specific gravity value of 1.020 with the following formula: Corrected concentration (ng/ml) = (Specific gravity target −1)/(Specific gravity sample −1) × Measured concentration (ng/ml).
Data analysis
All statistical analyses were performed by using S-PLUS 7.0 for Windows. A fixed effect ANOVA was performed to test the factors country and ethnicity. The non-parametric Kolmogorov–Smirnov test was used for group comparison. Significant differences among ethnic groups were considered with p<0.05. When the data differed significantly from a normal distribution, they are presented as the median with the 25th and 75th percentiles between brackets. The prevalence of the UGT2B17 deletion polymorphism for each ethnic group was estimated with a non-linear least-squares fit on all T/E data of this group as the sum of two log-normal distributions with parameters taken from a large-scale study.22 In detail, the two log-normal distributions of the T/E were parameterised by geometric means and geometric standard deviations equal to 0.141 and 1.43 (del/del), and 1.40 and 1.81 (ins/del and ins/ins).
Results and discussion
The analyses of all 172 samples revealed that no steroid profile presented an absolute steroid concentration higher than its respective threshold defined by WADA, while three samples with a T/E>4 (1.7%) were measured. Nevertheless, systematic GC/C/IRMS investigations on all 171 specimens by mean of a referenced protocol23 did not return any result consistent with the administration of an exogenous steroid (data not shown). The T concentrations of all 171 specimens are distributed into two distinct log-normal populations (fig 1), in concordance with similar histograms observed in referenced populations.24 25 The urinary steroid concentrations and ratio levels classified following the ethnic groups of the soccer players are illustrated in fig 2. The median values of T/E ratio (with 25th and 75th percentile) were 0.8 (0.4 to 1.4), 0.2 (0.1 to 0.3), 1.1 (0.6 to 2.0) and 1.2 (0.8 to 2.1) for AF, AS, CA and HI, respectively. The ratio was significantly lower for AS than in the other ethnic groups (p<0.001) and higher in HI than in AF (p = 0.04). Among all ethnic groups, the major influence on T/E ratio originated from the variations in testosterone concentration, for which the median was 40.5 (9.5 to 72.2) ng/ml, while that of epitestosterone was 42.9 (26.9 to 68.8) ng/ml. Testosterone levels in urine were determined at 45.5 (19.7 to 92.9) ng/ml, 5.0 (3.9 to 5.8) ng/ml, 40.5 (27.7 to 61.2) ng/ml and 74.6 (41.7 to 105.4) ng/ml for AF, AS, CA and HI, respectively. All groups were significantly different from each other (p<0.03). Several comparative studies of urinary testosterone levels among ethnic groups have been reported in the literature.16 18 25 26 In agreement with our investigation, a larger number of CA athletes excrete more testosterone in urine than AS athletes. In contrast, the CA population displays a significantly lower epitestosterone level than AF (p<0.001) while AS release lower amounts of epitestosterone in urine than AF and HI (p<0.02). As a second tendency, AF and HI groups show significantly higher DHEA glucuronide concentrations than AS and CA populations (p<0.001). To rationalise these findings, an additional polymorphism may be hypothesised. For instance, it is already known that a polymorphism of cytochrome P-450c17α (CYP17) partially contributes to the variations observed in phase I metabolism.27
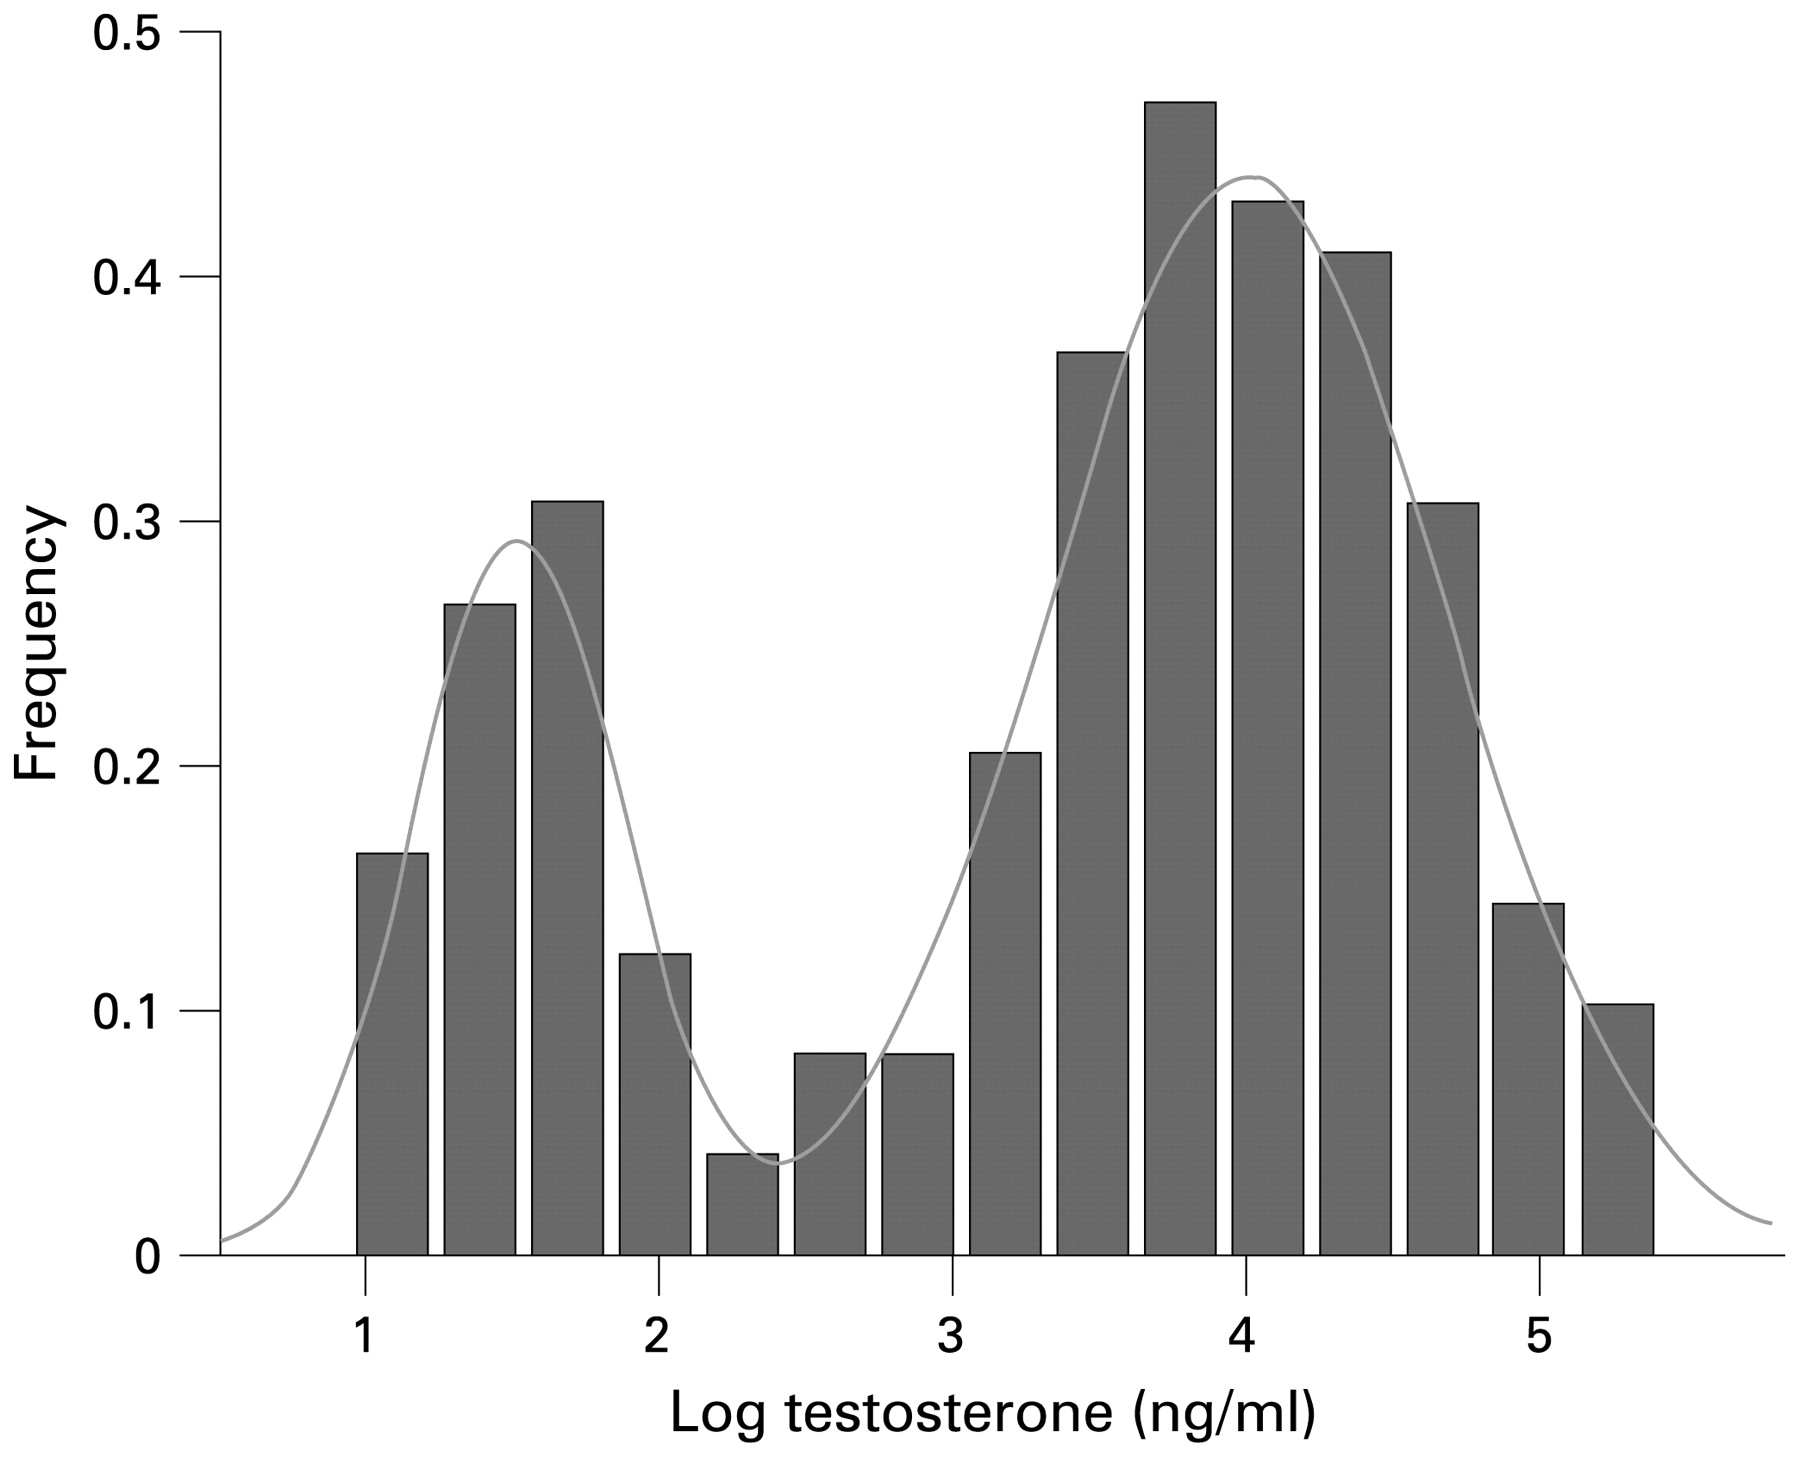
Frequency distribution of logarithm testosterone glucuronide (log ng/ml) in all ethnic groups (n = 171).

Urinary levels of glucuroconjugated steroids (log ng/ml) for testosterone, epitestosterone, androsterone, etiocholanolone and DHEA and ratios (expressed as log) of T/E, A/Etio and α-diol/β-diol in African (1), Asian (2), Caucasian (3) and Hispanic (4) populations.
Environmental, dietary or genetic effects could act independently or in concert to rationalise the data obtained herein. Comparative studies of Caucasian and Chinese subjects living either in the USA or in China provided strong evidence that environmental/dietary, but not genetic, factors influence androgen production.17 Alternatively, recent studies revealed a strong association between the steroid metabolism and genetic polymorphisms of individuals,18 with the glucuronidation of testosterone mainly catalysed by the transferase UGT2B17. Actually, it may not be derived from our experimental design whether the differences in the production of androgen glucuronides might be due to environmental/dietary or genetic factors. To evaluate the possibility that environmental/dietary factors might contribute significantly, different ethnic groups composed of a homogenous number of subjects among any of the selected countries should be tested.
The prevalence of the UGT2B17 deletion polymorphism estimated for the four ethnic groups is reported in table 1 and related to the prevalence estimates found in the literature.18 28 29 30 31 The significant variations for the same ethnic group depend certainly on the ethnic group definition. Our subjective ethnic classification seems too rudimentary, due to a significant difference in the level of testosterone between athletes from Uganda and South Africa (p<0.001) (data not shown). A study including more subjects should be performed to strictly set apart close ethnic groups. Xu et al have described a more detailed distribution of the UGT2B17 deletion polymorphism in the world population.32 Interestingly, in our study, the UGT2B17 deletion prevalence in HI from Argentina (7%) is in full agreement with that found for CA (10%). This observation contrasts with prevalence values of 50% and 73% reported for HI men from Brazil and Colombia, respectively.33
Prevalence of UGT2B17 polymorphism derived from testosterone concentration
We added the prevalence estimates of the UGT2B17 deletion as prior information in a Bayesian model to give an order of magnitude of the part of the variance in the T/E ratio explained by the differences in ethnicity.22 We found ethnic-specific cutoffs of 5.6 for AF, 3.8 for AS, 5.7 for CA and 5.8 for HI, for a specificity of 99%. In comparison, genotype-specific cutoffs are equal to 0.5 for del/del subjects and 5.9 for ins/del and ins/ins subjects, the latter initial value of 5.9 decreasing to a value as low as 2.2 with an initial, individual baseline T/E ratio of 1.0. These results suggest that the knowledge of a unique baseline T/E ratio allows a significantly greater individualisation of the T/E reference range than the knowledge of the ethnicity of the athlete.
Glucuronide derivatives of androsterone and 5α-androstanediol are frequently used as indirect markers of 5α-reductase activity,33 whereas etiocholanolone and 5β-androstanediol glucuronides are indirectly related to 5β-reductase activity. In this study, urinary concentrations of androsterone and etiocholanolone were significantly lower in AS and CA groups than in subjects from AF and HI groups (p<0.02). These results tend to confirm the lower excretion of 5α-reduced steroids in Asians.34 35 To rationalise the data, a gene polymorphism responsible for the 5α-reductase activity was described.36 Note that 5α-reductase activity is compared with that of 5β-reductase through the concentration ratios of 5α-/5β-reduced steroids.17 In our study, the A/Etio ratio values were 1.3 (1.1 to 1.6), 1.5 (1.3 to 2.1), 1.5 (1.2 to 1.8) and 1.7 (1.4 to 2.0) for AF, AS, CA and HI, respectively. The value was significantly lower for AF than for AS and HI men (p<0.02). Interestingly, HI A/Etio ratio was not significantly different from that of AS (p = 0.97) and CA (p = 0.52). The levels determined in urine for 5α- and 5β-androstanediol evidence the same differences between ethnic groups as for 17-keto metabolites (data not shown). Low 5α-androstanediol levels might arise in men who have a lower conversion of dihydrotestosterone to 5α-androstanediol or, conversely, a higher reconversion of 5α-androstanediol to dihydrotestosterone.37 On the other hand, it may be due to a greater efficiency of testosterone conversion to oestradiol due to higher aromatase activity (CYP19 polymorphism).33 Median values of the 5α-diol/5β-diol ratio were 0.3 (0.2 to 0.6), 0.9 (0.8 to 1.1), 0.4 (0.2 to 0.7) and 0.4 (0.3 to 0.6) for AF, AS, CA and HI, respectively. This ratio was higher for AS than for AF, CA and HI (p<0.001), thereby showing that 5α-reductase may be more active in AS. Although a relation with the UGT2B17 deletion polymorphism was expected to explain this difference, no correlation could be found between testosterone and the other steroids of interest. Additional studies are required to give prominence to a new polymorphism.
Conclusion
The mode of testosterone excretion has important implications in the interpretation of a steroid profile. This study demonstrated that there are significant differences in the steroid profile in a heterogeneous cohort of professional soccer players. Therefore, unique and non-specific thresholds on absolute concentrations of steroids and their respective ratios are not fit for purpose to evidence testosterone misuse in international sports. An individualisation of the reference ranges based on a longitudinal analysis of individual steroid profiles in an athlete’s endocrinological passport should be implemented.13 An endocrinological passport may detect modifications induced by the abuse of testosterone and its precursors, but also alterations in the steroid profile caused by indirect androgen doping products such as oestrogen receptor antagonists and aromatase inhibitors. Since isotopic analysis using GC/C/IRMS was demonstrated to be a useful tool to increase the detection efficiency of testosterone misuse by a low excretor,7 this technology has to be applied to specimens displaying significant variations of the steroid pattern with respect to individual norms.
Acknowledgments
This study was entirely supported by a grant of the Fédération Internationale de Football Association (FIFA) Medical Assessment and Research Center (Dr Katharina Grimm, FIFA/F-MARC, Zürich, Switzerland). We thank the FIFA medical team: Dr Pablo Ortega Gallo and Dr Raul Madero from Argentina; Dr Luca Gattesci and Dr Enrico Castellacci from Italy; Dr Haruhito Aoki from Japan; Dr Demitri Constaninou and Dr Sello Muotang from South Africa; Dr Roland Grossen from Switzerland and finally Dr James Sekajugo from Uganda.
REFERENCES
Footnotes
Competing interests None declared.