Article Text

Abstract
Injuries to prominent sportswomen have raised questions about whether there is an injury epidemic for female athletes. Our aim was to synthesise the data on overall injury incidence among female athletes and present the evidence for specific injuries for which female athletes appear to be at greater risk than male athletes. We also reviewed the severity of female injuries, the hypothesised risk factors and injury prevention studies. In general, women have a lower rate of injury than men. Women are at greater risk for specific injuries such as non-contact anterior cruciate ligament injuries, but these injuries are relatively rare. Further, women tend to have higher rates of surgery for the same injuries than men. Nevertheless, injury rates likely can be reduced by research efforts to identify modifiable risk factors using rigorous epidemiological methods and the investigation of effective prevention programmes.
Statistics from Altmetric.com
“No person in the United States shall, on the basis of sex, be excluded from participation in, be denied the benefits of, or be subjected to discrimination under any education program or activity receiving Federal financial assistance…” – Title IX of 20 U.S.C. 1681 et seq.
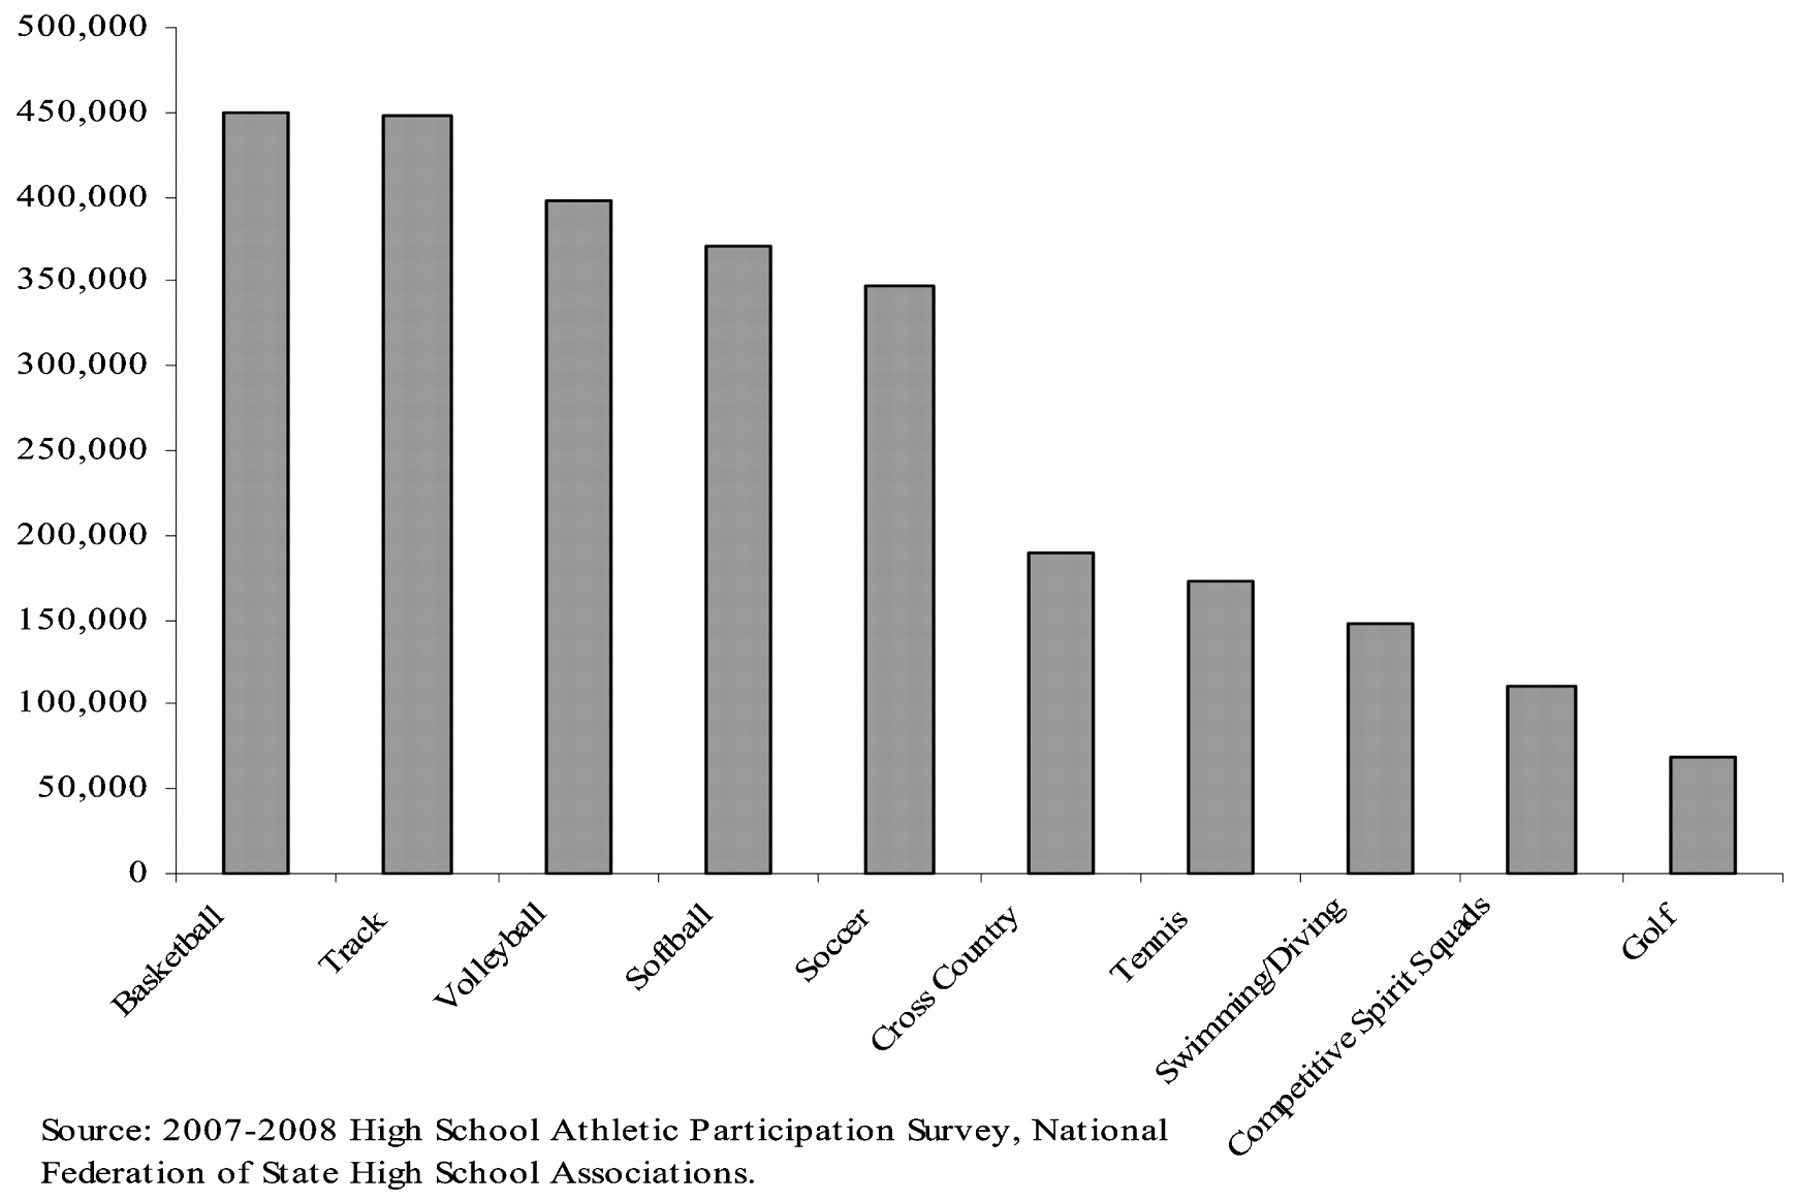
A surge in female sports participation in the United States followed the implementation of Title IX in 1972, and participation has continued to increase. More than 3 million girls participated in interscholastic high school sport during the 2007–08 school year, an increase of 940 per cent since 1971–72 (Figure 1).1 Basketball is the most popular high school girls’ sport, representing 15 per cent of all female participants (449 450 athletes) during the 2007–08 school year, followed by outdoor track and field (15 per cent; 447 520 athletes) and volleyball (13 per cent; 397 968 athletes) (Figure 2).1
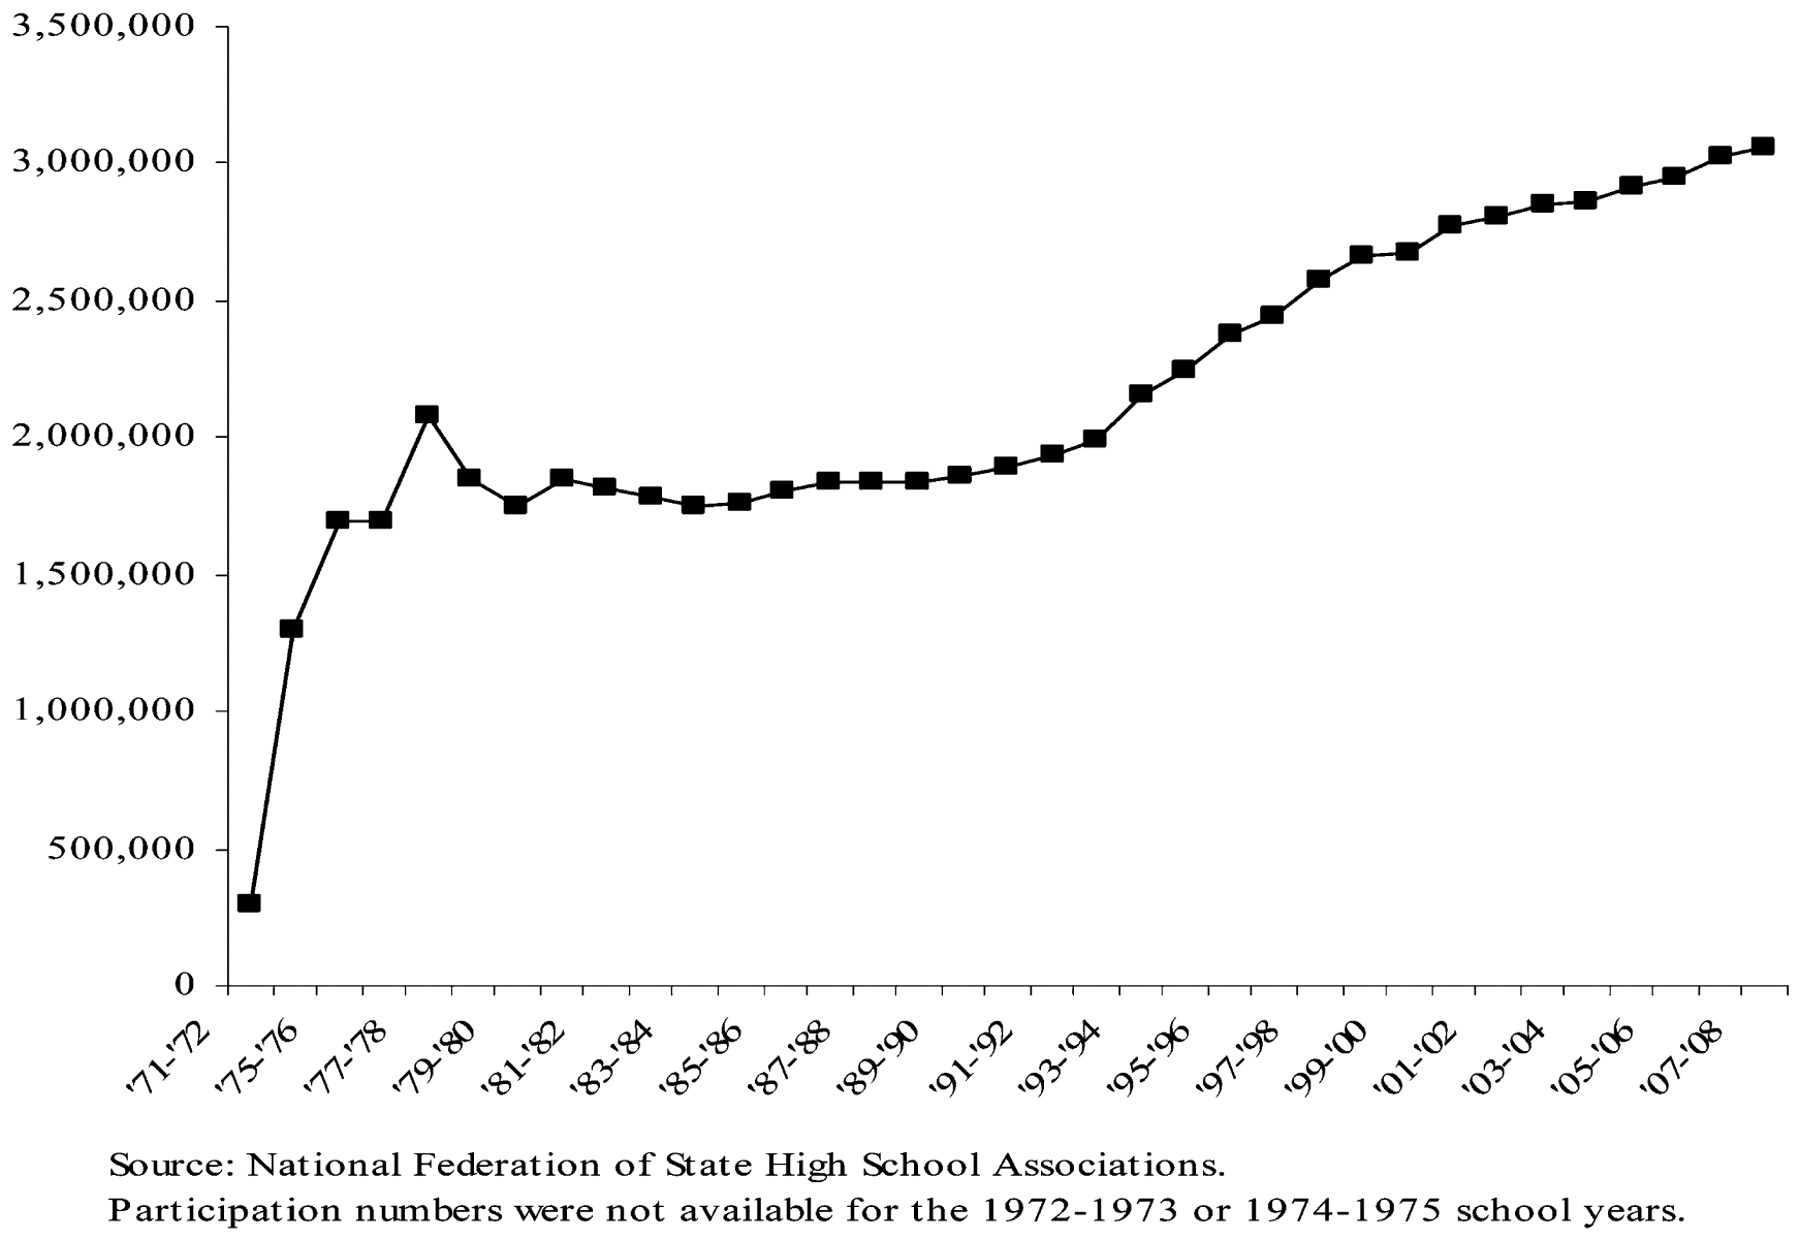
Female sports participation over time at the high school level, 1971–2008.
Most popular female sports in US high schools, 2007–2008.
Increased female sports participation has generated substantial discussion and investigation into the risk of injury, and research studies have increasingly examined sex differences or focused exclusively on female athletes.
Purpose of this review
Due to distinct injury patterns that have been observed, some have argued that there is an “injury epidemic” among female athletes.2 The purpose of this review is to (i) synthesise the literature regarding the incidence and severity of injury for female athletes, and (ii) summarise the evidence for aetiology and risk factors for key injuries.
Overall injury incidence
An analysis of the Child Health Supplement to the 1988 National Health Interview Survey estimated the self-reported injury incidence among girls at 4.4 injuries per 100, almost half of the incidence among boys.3 In 1997–99, an estimated 2.2 million of 7.0 million sport-related injuries treated at US emergency departments (ED) were to women, an incidence of 16.0 injuries per 1000 population (95% confidence interval (CI) 14.6 to 17.4).4 Girls and women aged 5–14 and 15–24 years had the highest injury incidence (44.7/1000 population and 30.9/1000 population, respectively). For all age groups, girls and women had less than half the injury incidence of men and boys (rate ratio (RR) = 0.44). Similarly, the 1997 and 1998 National Hospital Ambulatory Medical Care Survey of US EDs reported that the sports-related injury rate for girls and women was 19.2 visits per 1000 population, a rate 0.40 times the injury rate for men and boys.5
The most comprehensive information about female sports injury comes from multi-year prospective studies that have included both boys’ and girls’ sports. Comparing incidence across studies is easier when common definitions are used and incorporate time-at-risk, which is essential to compare sports with varying season lengths. For this paper, incidence is presented by type of denominator, including number of athletes, athlete-exposures (A-E; commonly defined as one athlete participating in a game or practice), and athlete-hours.
Clinical incidence studies, where the numerator is the number of injuries and the denominator is the number of players at risk, have reported that 14–33 per cent of injuries are to female athletes. In a community study of more than 20 000 school-aged children, 33 per cent of the sustained injuries were to girls.6 DeHaven and Lintner reported that approximately 20 per cent of the 3431 sports injuries treated at a medical clinic were to women and girls.7 Finally, in a study of a single high school season, the incidence for girls was 14.3 per cent compared with 27.2 per cent for boys.8
A clearer picture of the injury risk to female athletes occurs when the time-at-risk is considered as part of the incidence calculation. In a 2 year community-based study of organised sports in children aged 7–13 years, the overall injury rate for girls playing softball was 1.0 per 100 A-E compared with 1.7 per 100 A-E for boys playing baseball.9 For soccer, the injury rate for girls was 2.3 per 100 A-E compared with 1.7 per 100 A-E for boys.9
Powell and Barber-Foss analysed data from the National Athletic Trainers Association (NATA) for the 1995–98 school years for six gender-comparable sports: girls’ and boys’ softball/baseball, basketball and soccer.10 Among girls, the estimated overall injury rate was 24.4 injuries per 100 player-seasons. The highest injury rates were in girls’ soccer (incidence rate (IR) = 26.7 per 100 player-seasons, 95% CI 26.0 to 28.5) and girls’ basketball (IR = 28.7 per 100 player-seasons, 95% CI 28.9 to 31.7), followed by softball (IR = 16.7 per 100 player-seasons, 95% CI 15.9 to 18.7). When expressed as athlete-exposures, the injury rate ranged from 1.7 per 1000 A-E for volleyball to 5.3 per 1000 A-E for soccer (Table 1).11 Compared with boys, girls had 27 per cent and 14 per cent greater injury incidence in baseball/softball and soccer, respectively, but there was no sex difference in basketball.
Summary of injury incidence in girls’ vs. boys’ comparable sports
The North Carolina High School Athletic Injury Study (NCHSAIS) was a prospective cohort study of varsity high school athletes in 100 North Carolina high schools during the 1996–99 school years. Study sports included football, boys’ and girls’ soccer, boys’ and girls’ track, boys’ and girls’ basketball, baseball, softball, wrestling, volleyball and cheerleading. The overall injury rate for girls was 1.37 injuries per 1000 A-E (95% CI 1.13 to 1.66) compared with 2.47 injuries per 1000 A-E (95% CI 2.08 to 2.92) for boys.12 Of girls’ sports, soccer had the highest injury rate at 2.35 injuries per 1000 A-E (95% CI 1.55 to 3.55), followed by cheerleading (IR = 1.52, 95% CI 1.15 to 2.00) and basketball (IR = 1.28, 95% CI 0.88 to 1.86).12 When the girls’ and boys’ injury rates were compared for the four gender-comparable sports, boys had a slightly greater injury rate than girls (IRR = 1.33, 95% CI 0.99 to 1.79) (Table 1).
The National High School Sports-Related Injury Surveillance Study’s High School Reporting Injuries Online (High School RIO) surveillance system included 100 high schools during the 2005–06 school year to track injuries in nine sports: girls’ volleyball, soccer, basketball and softball and boys’ football, wrestling, soccer, baseball and basketball.13 The estimated overall injury rate was 2.44 injuries per 1000 A-E. Among girls’ sports, soccer had the highest injury rate with 2.36 injuries per 1000 A-E, followed by basketball (IR = 2.01 per 1000 A-E), volleyball (IR = 1.64 per 1000 A-E), and softball (IR = 1.13 per 1000 A-E) (Table 1).13
Finally, some studies have estimated incidence based on time-at-risk measured in hours or minutes. Such studies have estimated the injury incidence among girls and women from 0.66 to 1.2 injuries per 1,000 athlete- or participation-hours, with similar rates reported for men and boys.14 15
Distribution of injury
Injury incidence among female athletes varies widely among studies and the location of injuries is often sport-specific. Indeed, the rules and contact nature of specific sports leave female athletes at greater risk for certain types of injuries.
Lower extremity
In community-based, school-based and clinical studies, the lower extremity, particularly the knee and ankle, is the most frequently injured body region among female athletes.7 10 11 16 17 18 19 20 21 22 23 The NATA study reported that 63 per cent of injuries were to the lower extremity.11 Yang et al estimated the overall female lower extremity rate in the NCHSAIS to be 97.8 injuries per 100 000 A-E (95% CI 74.4 to 128.1).24 In a 2005 national sample of high school athletes, the rate of lower extremity injury among girls’ sports was estimated to be 1.14 per 1000 A-E and the knee and ankle represented 72.6 per cent of the 664 lower extremity injuries sustained by girls.18
Ankle
Depending on the sport, studies suggest that ankle injuries account for 13–50 per cent of female injuries.7 10 11 14 19 20 21 The NCHSAIS estimated the overall rate of ankle injury among female high school athletes at 42.3 per 100 000 A-E (95% CI 30.2 to 59.3), with volleyball having the highest incidence of ankle injury (68.3 per 100 000 A-E, 95% CI 25.6 to 182.0).24 An analysis of the 2005–07 High School RIO system estimated the female ankle injury rate to be 5.4 per 10 000 A-E, representing 32.5 per cent of all female injuries.25
Knee
Knee injuries are also frequently reported in sports injury studies and sex differences have been observed. In the analysis of 1995–97 NATA data, girls had a higher knee injury rate than boys in soccer, basketball and baseball/softball, and knee injuries accounted for 16 per cent of all injuries to girls.10 Compared with boys, girls had a 44 per cent higher knee injury rate in basketball (IDR = 1.44, 95% CI 1.20 to 1.71), a 46 per cent higher knee injury rate in soccer (IDR = 1.46, 95% CI 1.24 to 1.71) and a 30 per cent higher knee injury rate in softball/baseball (IDR = 1.30, 95% CI 0.98 to 1.73). In the NCHSAIS, the knee injury rate among girls was 24.9 per 100 000 A-E (95% CI 17.9 to 34.6), though the rate was not as high as for boys (IR = 39.2 per 100 000 A-E, 95% CI 30.1 to 51.0).24 In 2005–07 data from the High School RIO system, the rate of girls’ knee injuries was 3.11 per 10 000 A-E, compared with the boys’ rate of 4.29 per 10 000 A-E.26
The knee is also the most common site of severe injury among girls. More than 40 per cent (43.8 per cent) of severe injuries (>3 weeks lost participation) among female high school athletes were to the knee.27 Forty per cent of the knee injuries to girls in the High School RIO system resulted in >3 weeks lost participation, and 24.6 per cent of knee injuries required surgery.26 Girls are also 2–4 times more likely to have knee surgery than boys.10 26
Anterior cruciate ligament (ACL) injuries
ACL injuries have been extensively researched in female athletes and there is consensus that they have a higher risk than male athletes. Reviews of the ACL research, addressing both risk factors and prevention strategies, have been published previously.28 29 30 In this paediatric theme issue of BJSM, the focus is on ACL injuries in girls compared with boys.31 32 A recent meta-analysis of ACL tears concluded that female basketball and soccer athletes had approximately three times greater incidence of ACL tear than their male counterparts.33
As noted in Arendt’s review,34 increased risk for ACL injuries among females was originally observed among collegiate basketball and soccer players in the United States31 32 and among handball players in Europe.35 Moreover, a later report from the National Collegiate Athletic Association’s Injury Surveillance System (NCAA ISS) covering the 1988–2004 seasons also reported that, although football had the highest percentage of ACL injuries, women’s gymnastics had the highest rate per 1000 A-E (IR = 0.33, 95% CI 0.28 to 0.39).36 Soccer and basketball also had relatively high ACL injury rates for girls’ sports at 0.28 per 1000 A-E (95% CI 0.26 to 0.31) and 0.23 per 1000 A-E (95% CI 0.21 to 0.25), respectively.36 Finally, a study of 100 Texas high schools found that girls’ basketball had three times the rate of ACL injury compared with boys’ basketball.37
Head and neck injuries
Although not as common as lower extremity injuries, injuries to the head and neck are some of the most serious in terms of medical treatment and long-term complications. Among girls, the proportion of soccer injuries to the head and neck reportedly range from 4 to 22 per cent.38 39
Traumatic brain injury
Traumatic brain injuries such as concussion are a growing focus of research. Using data from the NCHSAIS, Schulz et al reported an overall rate of 11 concussions per 100 000 A-E for girls (95% CI 4.3 to 17.8).40 Of the 11 sports analysed, girls’ basketball had the highest concussion incidence for girls’ sports (IR = 17.5 per 100 000 A-E, 95% CI 0.8 to 34.2) and third highest overall, after football and boys’ soccer. Girls’ track and girls’ soccer, respectively, had the next highest rates of concussion incidence (IR = 14.3 per 100 000 A-E, 95% CI 0 to 43.2 and IR = 13.2 per 100 000 A-E, 95% CI 0 to 27.3).
In gender-comparable sports such as basketball, soccer, softball/baseball and track, the NCHSAIS estimated that the incidence of concussion was higher for girls than for boys for basketball and track but not for soccer or baseball/softball.40 In another multi-sport study using 1995–97 NATA high school data, Powell and Barber-Foss reported that girls’ soccer had the highest concussion incidence rate of the girls’ sports at 0.23 per 1000 A-E (95% CI 0.18 to 0.28), followed by basketball (IR = 0.16 per 1000 A-E; 95% CI 0.12 to 0.21).41 The rates of concussion for the other girls’ sports of field hockey, volleyball and softball ranged from 0.02 per 1000 A-E (for volleyball; 95% CI 0 to 0.03) to 0.10 per 1000 A-E (for softball; 95% CI 0.06 to 0.14). Notably, for both soccer and basketball, concussion incidence was greater for girls than for boys.
A 2005–06 study of both high school (using High School RIO) and collegiate athletes (using the NCAA ISS) estimated the concussion incidence among girls’ sports to be 0.18 per 1000 A-E for high school athletes and 0.38 per 1000 A-E for collegiate athletes.42 For the six gender-comparable sports included (basketball, soccer and baseball/softball), girls had a higher incidence of concussion than boys at both the high school and collegiate levels.
Some studies, however, have indicated that, at least for soccer, boys may have a higher concussion incidence rate than girls. The NCHSAIS reported that boys’ soccer had 1.8 times the concussion incidence rate compared with girls’ soccer.40 Moreover, baseball had an 18 per cent higher concussion incidence than softball.40
The research is also not clear on whether girls experience significantly worse long-term clinical outcomes from concussion injuries.43 In their study of concussed high school and college athletes, Broshek and colleagues reported that girls had significantly greater declines in postconcussive neurological assessments of reaction time than males.44 Girls also reported significantly more concentration difficulties, fatigue, lightheadedness, and “flyspecks” than boys.44 Other studies, however, have reported no or limited sex differences in concussion-related outcomes.45
Injury severity
The severity of sports injuries has been described based on three aspects: the catastrophic nature of the injury, the time lost from participation, and whether or not the injury required surgery.
Catastrophic injury
Catastrophic injuries at the high school and collegiate levels have been tracked by the National Center for Catastrophic Sport Injury Research (NCCI) since the 1982–83 school year. Catastrophic injuries are differentiated by direct and indirect causes, with direct catastrophic injuries defined as those that result directly from participation and indirect catastrophic injuries defined as those that occur secondarily to an initial non-fatal injury or that are caused by the physical exertion of sports participation. Between 1982 and 2008, the vast majority (81.1 per cent) of direct and indirect catastrophic injuries were to high school athletes (1363/1680), 12.3 per cent of which were to girls (n = 168).46 Cheerleading is associated with the most catastrophic injuries among high school girls at 48.2 per cent.46
For gender-comparable sports in particular, Table 2 shows the clinical incidence of direct catastrophic injuries among high school athletes. Direct catastrophic injuries are classified as fatal, non-fatal (severe permanent disability) and serious (severe but no permanent disability). For all sports, girls had a lower clinical incidence of fatalities and non-fatal catastrophic injuries. A similar sex difference was also observed for serious injuries, except in lacrosse, where girls had a higher incidence of serious injury (0.17 vs. 0.14 per 100 000 participants). For indirect injuries, boys again had a higher clinical incidence for fatal, non-fatal, and serious injuries, except for swimming (data not shown). Female swimmers had approximately six times the incidence of indirect fatalities compared with boys (0.24 vs. 0.04 per 100 000 participants).
Clinical incidence of direct catastrophic injuries (number of injuries/100 000 participants) among high school, by sex, NCCI 1982–2008
Time lost from participation
Time lost from sports participation is a marker of injury severity and is influenced by the nature of the injury, level of medical treatment, and influence of parents and coaches on return-to-play decisions. Few studies have specifically reported sex differences in lost participation, but those that have report that most injuries to girls are “minor” – meaning a week or less lost from participation.10 In an analysis of NATA data, the majority of injuries to girls (73.3 per cent) were minor; injuries that resulted in >21 days lost participation ranged from 7 per cent in field hockey to 12 per cent in basketball.9 10 In another study of high school athletes, the proportion of injuries to girls that resulted in ⩽5 days lost participation ranged from 26 per cent for girls’ basketball to 71 per cent for swimming.47
When defined as >21 days lost participation, the rate of severe injuries among high school girls has been estimated at 0.26 per 1000 A-E, with rates ranging from 0.12 per 1000 A-E for softball to 0.34 per 1000 A-E for girls’ basketball.27 Further, for gender-comparable sports (softball/baseball, basketball and soccer), girls had a rate of severe injury 1.28 times higher than boys (95% CI 1.08 to 1.52).27
In one study of a single high school season, days lost from participation for girls ranged from zero to 32 days per injury, depending on the sport.8 Using the High School RIO system, Fernandez and others reported that 31.6 per cent of lower extremity injuries to girls resulted in 3–6 days lost participation and 12.5 per cent were season-ending, compared with 8 per cent of season-ending injuries to boys.18 For girls’ knee injuries specifically, 40 per cent resulted in more than 3 weeks lost from participation, compared with 25 per cent of boys’ knee injuries.26 Finally, also using High School RIO , Darrow and others reported that 65 per cent of the severe injuries sustained in girls’ soccer were season-ending.27
Surgery
Surgery is performed on only a small proportion of injuries, but for some types of injuries girls are more likely to have surgery than boys. An analysis of the 2005–07 seasons from the High School RIO system found that more girls than boys had surgery to repair lower extremity injuries (6.8 per cent vs. 4.5 per cent).18 Specifically, female soccer players were three times more likely to have surgery for lower extremity injuries than male soccer players (7.3 per cent vs. 2.0 per cent). A separate High School RIO report found that twice as many girls as boys had surgery for knee injuries (24.6 per cent vs. 12.4 per cent).26 This difference is not solely explained by different locations of lower extremity injury, however, as knee injuries were the most common reason for surgery for both sexes (78.4 per cent for girls vs. 72.2 per cent for boys).18 The difference may be at least partially explained due to the nature of the knee injury (eg ligament sprain vs. ligament tear), as girls undergoing ACL surgery were almost twice as likely as boys to have suffered a complete ACL tear.18
In their NATA analysis, Powell and Barber-Foss reported that 3.5 per cent of girls’ injuries required surgery, ranging from 1.2 per cent for field hockey to 4 per cent for basketball.10 11 A similar percentage was reported for boys, with 3.2 per cent of their injuries requiring surgery, ranging from 2.0 per cent for wrestling to 3.5 per cent for baseball.10 11 More than 67 per cent of surgeries for injured female athletes were due to such ligament tears, compared with 35 per cent of surgeries among boys. In addition, female soccer players had more than three times the rate of surgery of ACL injuries compared with boys.11
It is important for future research to clarify why girls have a higher proportion of surgeries for injuries than boys and whether those reasons are solely due to the nature of the injury or whether non-clinical social factors also influence the decision to operate.
Aetiology
Given the consistent growth of female sports participation, there continues to be an urgent need to identify modifiable risk factors and better understand injury mechanisms. Thus far, there have been extensive efforts to evaluate a host of risk factors relevant to female athletes and multiple extensive reviews on this topic already exist in the literature.48 49 50 51 52 Briefly, risk factors for sport injury are traditionally described as extrinsic and intrinsic, referring to factors outside the body or factors inside the body.
Extrinsic risk factors
For both sexes, sport is the most obvious extrinsic risk factor for injury. It is clear that injury patterns can be sport-specific, based on the varying rules and regulations of sports. Unfortunately, no sport is risk-free and researchers are increasingly identifying distinct patterns of injury within an increasingly broad range of sports.
In addition, other extrinsic factors that have been evaluated include competition division,12 53 weather conditions,54 equipment and athletic shoes,55 field or floor conditions,56 57 58 and coaching factors.12 53
Coaching factors are of particular interest given the increased need for more coaches to meet the growing participation of women and girls in competitive sports. Schulz et al’s analysis of the NCHSAIS data found that coaches with a high level of experience, qualifications and training (EQT) had a protective effect on injury incidence among cheerleaders.53 In contrast, Knowles et al’s analysis of NCHSAIS data, which excluded cheerleading, did not find any relationship (protective or harmful) with injury incidence, though there was evidence that a high level of coach EQT was protective against injury severity.12
Intrinsic risk factors
The different injury patterns observed in girls and boys who participate in similar sports (eg basketball, soccer and baseball/softball) raise questions about inherent biological differences that may be risk factors.
Caine and colleagues summarised the evidence for potential injury risk factors in paediatric sports; for female athletes in particular, noted risk factors included the adolescent growth spurt, fitness, age and prior injury.59 For example, young female gymnasts who were in the stages of pubertal development associated with rapid physical growth were at an increased risk for injury relative to those in more stable development stages.60 Physical fitness may also play a role, with higher levels of physical fitness associated with a significant risk of injury.61 Age has also been implicated as a potential risk factor, though the direction of the relationship is not clear, with some studies reporting an increased injury risk among older female athletes,62 but others reporting a decreased risk associated with older age.63 Finally, there is very strong evidence that prior injury is a significant predictor of another injury either to the same site or to a new site.12 53 63 64 65 66
For ACL injuries specifically, intrinsic factors have been extensively reviewed. A 2008 publication of the International Olympic Committee’s statement on non-contact ACL injuries in female athletes summarised the research and evidence for several intrinsic risk factors, including anatomical factors, hormones and menstrual cycle, neuromuscular characteristics, muscle strength and flexibility, all of which have been examined in depth.30 As noted in that review and others, the causes of ACL injuries are widely considered multifactorial, with no one intrinsic factor playing a causal role.29 30 49 52
Until recently, both intrinsic and extrinsic risk factors were identified by describing the distinct patterns observed in injured athletes. Though such methods provided important information about potential risk factors, from an epidemiological perspective, risk factor identification can only occur by also examining risk factor patterns in non-injured athletes. Future studies on risk factors also need to account for the multivariate nature of sports injuries by including sufficient sample size and as many relevant risk factors as possible.67
Prevention
Focused research to identify risk factors has been paralleled by efforts to develop effective prevention measures. Such measures can target either extrinsic or intrinsic factors in efforts to reduce injury risk.
Protective equipment
Protective equipment is an extrinsic measure aimed at protecting athletes in the context of normal play. Helmets, face guards, and knee pads and braces are examples of such equipment that are used to prevent injuries in both male and female athletes. Unfortunately, use of protective equipment is not always mandatory, particularly in sports technically considered non-contact or partial contact, regardless of any actual contact that may occur during normal play (eg lacrosse, field hockey).
A current estimate of lower extremity discretionary protective equipment use among high school girls’ sports is 38 per cent, and female athletes are significantly more likely than male athletes to use ankle braces, shin guards and knee pads, but not knee braces.68 The use of such equipment has also been evaluated as a protective factor against lower extremity injury. Though sex-specific results were not presented, Yang and others found that use of lower extremity protective equipment (specifically knee pads) in the NCSHAIS was associated overall with a 9 per cent reduction in the rate of lower extremity injuries.24
Prevention programmes
Prevention efforts are gaining prominence in sports medicine.69 Recent reviews of ACL injury prevention programmes note the benefit of plyometrics, leg strengthening, and activities aimed at increasing neuromuscular control in reducing the risk of non-contact ACL injuries.29 30 52 70 71
But for all injuries, the design of intervention studies is critical, as randomised controlled trials (RCT) provide the most methodologically rigorous evaluations. Several randomised controlled trials that included female athletes showed a protective effect of specific training programmes on the risk of injury.59 Though different interventions were implemented in each study, they contained similar elements, including extended structured warm-up exercises and proprioceptive training (eg ankle disc, wobble board).72 73 74 75 76 77
Summary and further research
In general, the risk of sports injury is lower among female than male athletes. This is not solely explained by the choice of sport (ie football), because incidence rates still tend to be higher for male athletes even after standardising the time-at-risk. Importantly, however, for some injuries, girls and women appear to be at a higher risk than men and boys. Specifically, female athletes have a greater incidence of non-contact ACL injuries, though the incidence is low when compared to overall injury rates. And, in gender-comparable sports such as soccer and basketball, there is some evidence that female athletes have a higher risk of concussion than male athletes.
In summary, the evidence does not support the declaration of an injury epidemic in girls’ sports. Nevertheless, given the importance of organised sport as a vehicle to encourage physical activity, it is essential for continued research efforts to identify modifiable risk factors using rigorous epidemiological methods and develop evidence-based prevention programmes for both male and female athletes.
What is already known on this topic
Girls’ participation in competitive sports has substantially increased over the past 30 years.
Girls have a higher risk of injury for some types of injury than boys, particularly injuries to the anterior cruciate ligament.
Mainstream media focus on girls’ sports-related injuries has declared an “injury epidemic” among female athletes.
What this paper adds
Even though girls are at a higher risk for specific types of injuries compared with boys, such injuries are relatively rare and girls have a lower overall rate of injury. However, female athletes tend to have higher rates of surgery for the same injuries than male athletes, and there is some sport-specific evidence that girls are at a higher risk for concussion.
The evidence does not support the existence of an injury epidemic in female athletes; nevertheless, sports injuries remain a very important public health problem among female athletes.
Increased and consistent use of multivariable analysis (that considers exposure time at risk) and randomised controlled trials of injury prevention interventions will provide the strongest evidence for identifying modifiable risk factors and effective prevention programmes.
REFERENCES
Footnotes
Competing interests None.
Provenance and Peer review Commissioned; externally peer reviewed.