Article Text

Abstract
Objectives: To determine sex differences in the distribution of regional and total skeletal muscle (SM) using contiguous whole body magnetic resonance imaging (MRI) data, and to examine the relations between fat free mass (FFM) and total and regional SM masses.
Methods: A total of 20 Japanese college students (10 women and 10 men) volunteered for the study. FFM was measured by two compartment densitometry. Whole body MRI images were prepared using a 1.5 T scanner. Contiguous transverse images with 1.0 cm slice thickness were obtained from the first cervical vertebra to the ankle joints. All MRI scans were segmented into four components (SM, subcutaneous adipose tissue, bone, and residual tissues). In each slice, the SM tissue cross sectional areas (CSAs) were digitised, and the muscle tissue volume per slice was calculated by multiplying muscle CSA by slice thickness. SM volume units (litres) were converted into mass units (kg) by multiplying the volumes by the assumed constant density (1.041 mg/ml) for SM.
Results: The SM distribution pattern (shape of curve) from the contiguous whole body slices was essentially similar for the two sexes, with two large peaks and three smaller peaks (arms excluded). However, the largest peak was observed at the upper portion of the thigh for women and at the level of the shoulder for men. Men had larger (p<0.01) total and regional SM mass than women. All regional SM masses correlated highly (r = 0.90–0.99, p<0.01) with total SM mass. A strong positive correlation was observed between FFM and total and regional SM masses in both sexes (women, r = 0.95; men, r = 0.90; all p<0.01). As FFM increased, there was a corresponding increase in SM/FFM ratio for all subjects (r = 0.86, p<0.01).
Conclusions: Sex differences in total SM/FFM ratio and regional SM distributions are associated with the degree of absolute FFM accumulation in men and women.
- body composition
- cross sectional area
- fat free mass
- muscle distribution
- skeletal muscle mass
- FFM, fat free body mass
- SM, skeletal muscle
- MRI, magnetic resonance imaging
- CSA, cross sectional area
- ATFM, adipose tissue free body mass
Statistics from Altmetric.com
- FFM, fat free body mass
- SM, skeletal muscle
- MRI, magnetic resonance imaging
- CSA, cross sectional area
- ATFM, adipose tissue free body mass
In most standard textbooks of sports and exercise physiology, fat free body mass (FFM) is used as a surrogate for whole body skeletal muscle (SM) mass for normalisation of various physiological variables such as metabolic cost, oxygen uptake, muscle force production, physical work capacity, and sports performance.1–4 The reasoning behind substituting FFM for SM mass is that SM is the largest non-fat tissue component of the human body and SM mass can account for almost 50% of total body weight.5,6 In the calculation of tissue/organ level body composition, however, fat free adipose tissue mass is included in FFM. This model assumes that 85% of adipose tissue is fat, with the remaining 15% being the fat free component.7 By definition, any increase in FFM is accompanied by an increase in adipose tissue. In addition, there are no methods for measuring SM mass that are suitable for field studies.5 Therefore the in vivo association between FFM and SM mass has remained unknown in men and women.
Studies using multiscan magnetic resonance imaging (MRI) have recently developed several new insights into the in vivo mass and regional distribution of SM.7–9 However, these data have all been obtained by the same assessment process, which uses less than 41 images (4.0 cm interslice gap) to evaluate whole body SM mass.7–9 There are over 600 discrete skeletal muscles in the human body, and differences exists in the direction and size of these muscles. Furthermore, the shape of the female pelvis is somewhat different from that of the male pelvis.10 Some of these differences may be related to variations in trunk muscle mass and distribution between the sexes. Therefore a more representative MRI method for measuring whole body SM would be a process that examines more and/or contiguous slices that cover the entire body. To the best of our knowledge, there are no data on sex differences in the contiguous slice by slice entirety of SM distribution and total mass in vivo.
Thus the purpose of this study was to determine sex differences in the distribution of regional and total SM mass using contiguous whole body MRI data. We also examined the relations between FFM and total SM mass and between FFM and regional SM mass in both men and women.
METHODS
Subjects
Ten female and ten male college students volunteered for the study. All were physically active, participating in regular exercise (aerobic and/or resistance type exercise two to three times a week). None were taking any drugs at the time of the study. The purpose, procedures, and risks of the study were explained to each subject before inclusion, and all subjects gave written consent to participate. The study was approved by the department’s ethics commission.
FFM measurement by two compartment densitometry
Body density was measured by the hydrostatic weighing technique, with simultaneous measurement of residual lung volume by oxygen dilution.11 Body fat percentage was calculated from the body density using the equation of Brozek et al.12 FFM was estimated as body mass minus fat mass.
Whole body SM measurement by MRI
MRI images were prepared using a General Electric Signa 1.5 T scanner (Milwaukee, Wisconsin, USA). A T1 weighted, spin echo, axial plane sequence was performed with a 1500 millisecond repetition time and a 17 millisecond echo time. Subjects rested quietly in the magnet bore in a supine position with their legs and arms extended in the anatomical reference position. With the first cervical vertebra as the point of origin, contiguous transverse images with 1.0 cm slice thickness (0 cm interslice gap) were obtained from the first cervical vertebra to the ankle joints for each subject (about 150 slices per person). Four sets extended from the first cervical vertebra to the femoral head during breath holding (about 20 seconds). The other three sets of acquistions were obtained from the femoral head to the ankle joints during normal breathing.
All MRI scans were segmented into four components (SM, subcutaneous adipose tissue, bone, and residual tissues) by a highly trained analyst, and then traced. In each slice, the skeletal muscle tissue cross sectional areas (CSAs) were digitised, and the muscle tissue volume (cm3) per slice was calculated by multiplying muscle tissue area (cm2) by slice thickness (cm). SM volume units (litres) were converted into mass units (kg) by multiplying the volumes by the assumed constant density for SM (1.041 kg/l).6 The estimated coefficient of variation of this SM mass measurement from test-retest (n = 5) was 2.1%.
To determine whether regional differences existed, the body was divided into four different anatomical regions. Upper and lower leg SM masses were calculated using the images extending from the femoral head to the knee joint and from the knee joint to the ankle joint respectively. Trunk SM mass was calculated using the images extending from the femoral head to the first cervical vertebra, excluding the arm SM mass. The border of the arm SM was determined immediately distal to the axillary fold.
Statistical analysis
The data are presented as mean (SD). The differences between men and women were tested for significance by a one way analysis of variance. Linear regression analysis was used to assess the relations between total and regional SM mass and between FFM and SM variables.
RESULTS
Subjects
There were no sex differences in age and body mass index. Men had greater body mass and FFM (all p<0.01) than women. Women were shorter and had higher percentage fat and fat mass (all p<0.01) than men (table 1).
Total and regional skeletal muscle mass and body composition in men and women
Distribution pattern of SM area measurements per slice
Figure 1 illustrates the distribution of SM CSA measurements per slice for a man and woman with similar standing height (161 and 160 cm respectively) and FFM (49.0 and 46.6 kg respectively). The SM CSA distribution pattern—that is, shape of the curve—from the whole body slices was similar for all the subjects. For example, inspection of the SM CSA measurements per slice shows that two large peaks (P1, P4) and three smaller peaks (P2, P3, P5) were found in the whole body SM CSA distribution (arms excluded), although the individual value for the peaks was different among the subjects. The largest peak was observed at the upper portion of the thigh (P4), and the second largest peak at the level of the third thoracic vertebra, which is at about the level of the shoulder (P1). The other three smaller peaks were located between the lower portion of the xiphoid process (B1) and the iliac crest (B2) (which is at about the level of L3–L4 (P2)), between the iliac crest (B2) and the femoral head (B3) (which is at the level of the gluteus (P3)), and between the knee joint (B4) and the ankle joint (which is at the level of the widest part of the calf (P5)). Men had a greater SM CSA at the shoulder, chest, and lower gluteus regions. Abdomen, lower thigh, and calf regions were similar in area between the sexes (fig 1).

Distribution of skeletal muscle cross sectional area (CSA) measurements per slice for a man and woman with similar standing height (161 and 160 cm respectively) and fat free mass (49.0 and 46.6 kg respectively).
On average, SM CSA at the five peaks (P1–P5) and three troughs (B1–B3) were larger (all p<0.01) in men than women (table 2). Upper body muscle CSA (at P1, P2, B1, and B2) for women was about 56% (range 55.2–61.2%) of that for men. On the other hand, lower body muscle CSA (at P3, P5, and B3) for women was about 75% (range 68.8–84.4%) of that for men.
Skeletal muscle cross sectional area (cm2) at the five peaks and three troughs in men and women
Total and regional SM mass
Men had greater (all p<0.01) total and regional SM mass than women (table 1). Upper and lower leg SM mass for women was 63% and 75% respectively of those for men, whereas arm and trunk SM mass was about 50% of that for men. Hence, the total SM mass of women was 60% of that of men. The SM mass/FFM ratio, SM mass/body mass ratio, and SM mass/standing height ratio were higher (p<0.01) in men than women (table 1).
Relations between FFM and total and regional SM mass
A strong positive correlation was observed between FFM and total SM mass (female, r = 0.95; male, r = 0.90; all p<0.01; fig 2B) and between FFM and regional SM mass (female, r = 0.87–0.94; male, r = 0.80–0.90; all p<0.01; fig 2A) in both sexes. Also, as FFM increased, there was a corresponding increase in SM mass/FFM ratio for women (r = 0.76, p<0.01), but not for men (r = 0.38). An analysis of all subjects showed that there was a positive correlation (r = 0.86, p<0.01) between FFM and SM mass/FFM ratio.

Relations between fat free mass and total skeletal muscle mass (B) and fat free mass and regional skeletal muscle mass (A) in men (closed symbols) and women (open symbols).
Relation between total SM and regional SM
All regional SM mass values correlated highly (r = 0.90–0.99, p<0.01) with total SM mass (fig 3). However, the correlation coefficient for the lower leg was lower than those for the other sites. The total SM mass to trunk SM mass regression had a slope of 0.48 kg/kg in all subjects and was much greater than for all other regions (fig 3).

Relations between total and regional skeletal muscle mass in men (closed symbols) and women (open symbols).
DISCUSSION
Previous multiscan MRI studies have been performed using an assessment process similar to ours. However, those studies used fewer than 41 images (4.0 cm interslice gap) to evaluate whole body SM mass. Theoretically, this interleaved process of evaluating SM mass should be accurate when estimating the cone shaped limb muscles. However, the large interslice gap may cause a large estimation error when complex shaped muscles such as the trunk SM are assessed, although there are no data on this. Our method, which examines contiguous slices (150–160 images; 0 cm interslice gap) covering the entire body, should be more accurate for the evaluation of trunk SM mass.
Greater sex differences in muscle size (CSA and mass) have been previously observed in the upper extremities than the lower extremities.13,14 However, few studies have reported sex differences in trunk muscle CSA at multiple levels of the spinal vertebrae. There are no data that comprehensively describe trunk muscle geometry in both men and women.15 To the best of our knowledge, this is the first study to use contiguous slice by slice entirety MRI data to determine sex differences in whole body SM distribution. We observed two large peaks and two smaller peaks in the trunk and thigh SM CSA distribution in both sexes. Comparison of trunk muscle CSA at the peaks and troughs of the distribution curve shows a greater sex difference in the upper trunk region (in women it is about 56% of that in men) than in the lower trunk region (in women it is about 75% of that in men). Furthermore, our absolute values for trunk muscle CSA are similar to those of a recent study which reported MRI derived trunk muscle CSA across multiple levels of the thoracic and lumbar spinal vertebrae.15 Therefore our results show that trunk muscle CSA distributions are similar in men and women, although the shape of the pelvis is somewhat different.
It is generally believed that disorders of the lower back are associated with two factors: inherent weakness of the lumbar region, and the forces or loads encountered by the lower back during daily living and athletic activities.16 Our results show that one of the smallest CSAs is found at the level of the iliac crest, making it a functionally disadvantaged region of the trunk. The lower portion of the xiphoid process has an even smaller CSA than the iliac crest. However, it is protected by the thoracic rib cage, whereas the iliac crest is only supported by the lumbar spinal vertebrae. The muscles at the iliac crest level consist mainly of the rectus abdominis, external and internal obliques, psoas major, and erector spinae. In this study, SM CSA of women at this level was found to be 61% of that of men. The maximum force generation potential of a muscle is related in part to its CSA. When the magnitude of absolute spinal loading is similar in the two sexes, the relative force exerted by the spinal loading muscles is higher in women than men. Thus our data explain why low back pain is more often prevalent in women than in men.17
Cadaver dissection studies have reported that SM mass accounts for almost 50% of total body mass in elderly subjects.18,19 Multiscan MRI studies have shown that total SM mass/body mass ratio is approximately 0.30 for women and 0.40 for men.7–9 In our study, total SM mass/body mass ratio was 0.24 for the healthy young women and 0.35 for the healthy young men. Clearly, total SM mass/total body mass ratio is highly variable and may be due to different degrees of accumulated fat mass between subjects. This difference may be due to environmental (culture, exercise) or genetic factors.
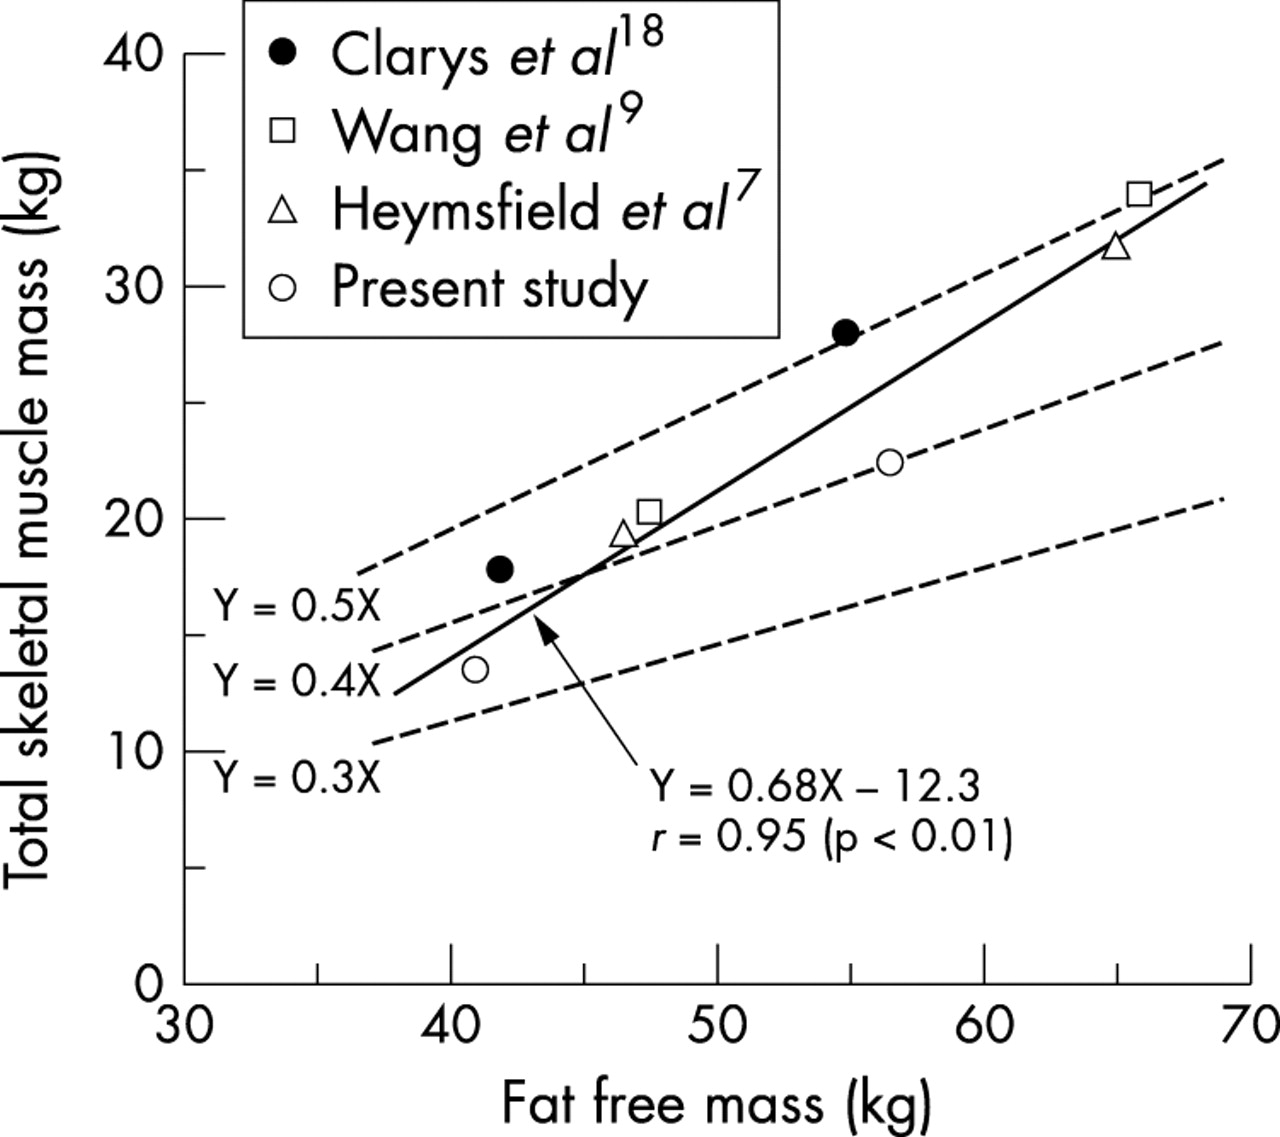
Figure 4 illustrates the relation between total SM mass and FFM using mean values from the present study and values taken from previous in vitro and in vivo studies.7,9,19 Heymsfield et al7 observed a strong correlation between total SM mass and FFM in pooled samples. They also reported an increase in the ratio of total SM mass to FFM with greater FFM. Unfortunately, they failed to discuss these findings. Our findings are consistent with this report in showing a strong positive correlation between total SM mass and FFM and that the total SM mass/FFM ratio increases with increased FFM. In addition, the regression line between total SM mass and FFM was similar for men and women in our study. Previous studies have proposed the concept of adipose tissue free body mass (ATFM), defined as total body mass minus adipose tissue mass.7,9 According to the data of Baker20 and Garrow,21 the proportion of fat in adipose tissue is 0.80. Using previous investigations, we sought to confirm this close association between FFM (molecular component) and ATFM (tissue/organ component), as defined by the formula: FFM = ATFM + 0.20 × adipose tissue mass. After conversion from ATFM into FFM, the ratio of total SM mass to FFM found in the present and previous studies was compared (fig 4). The ratio found in the present study (0.40 kg/kg for men and 0.33 kg/kg for women) was lower than previously reported (0.50 kg/kg for men and 0.43 kg/kg for women). The most important reason for the differences in SM mass/FFM ratio is the differences in the degree of absolute FFM among the investigations. The slope of the regression line between total SM mass and FFM (0.68 kg/kg) in fig 4 was greater than 0.50 kg/kg. If a slope of 0.50 kg/kg is used, there is a constant value for total SM mass/FFM ratio of 0.5. This may explain the result showing that the lower FFM in both male and female subjects in our study corresponds to a smaller SM mass/FFM ratio compared with previous studies. The total SM mass/FFM ratio should change according to the level of FFM. Therefore any sex difference in total SM mass/FFM ratio is associated with the degree of absolute FFM in men and women.
Relation between fat free mass and total skeletal muscle mass in men and women using mean values from this study and values from previous in vivo and in vitro studies.
Another potential reason for the difference in SM mass/FFM ratio is related to the intramuscular non-contractile tissue (fat and connective tissue) content of SM. MRI measured non-contractile tissue area was about 10% larger in older adults (14–16% of total muscle CSA) than young subjects (6% of total muscle CSA).22 The cadaver study, mainly older subjects, dissected SM tissue and included large non-contractile tissues as part of the total SM tissue. Therefore, this method may overestimate (by about 10%) total SM mass when older subjects are used.
Take home message
Women generally have lower total SM mass/FFM ratio than men. This is partly related to the degree of absolute FFM accumulation.
A previous MRI study reported that men had a greater percentage of SM mass in the upper body (43%) and a lower percentage of SM mass in the lower body (55%) compared with women (40% and 58% respectively).8 Our results show strong positive correlation between total and regional SM mass in both men and women, and the regression lines were similar in the two sexes. The regression between trunk SM mass and total SM mass has a slope of 0.48 kg/kg in all subjects and is much greater than the slopes for the other regions (0.33 kg/kg for upper leg, 0.11 kg/kg for arms, and 0.07 kg/kg for lower leg). This indicates that SM distribution in men and women is associated with the degree of accumulated total SM mass in normal adults. Thus, the sex differences in SM distribution in the upper and lower body are related to the degree of FFM accumulation in men and women. Another interesting observation is that regional SM mass can be estimated from FFM using the strong relation between the two variables.
In summary, the SM distribution pattern obtained from contiguous whole body slices was similar in men and women. Two large peaks and three smaller peaks (arms excluded) were found. The largest peak was observed at the upper part of the thigh for women and at the level of the shoulder for men. Men had larger total and regional SM mass than women. All regional SM mass values correlated highly with total SM mass. A strong positive correlation was observed between FFM and total and regional SM mass in both sexes. As FFM increased, there was a corresponding increase in SM mass/FFM ratio for all subjects. These findings indicate that sex differences in upper and lower body SM distribution and total SM mass/FFM ratio are associated with the degree of FFM accumulation. Ultimately, a high SM/FFM ratio may be important for superior sports performance, especially in sports requiring strength or power. However, this will require further study.
Acknowledgments
Our appreciation is extended to the men and women who participated in this study. The study was supported in part by the Ministry of Education, Science, Sports and Culture of Japan (grant No 15300221).