Article Text

Abstract
Objective: To investigate the relationship between several physiological variables that can be easily obtained during cycle ergometer gradual testing (for example, peak power output (Wpeak), Vo2max, or ventilatory threshold (VT)) and actual (>50 km) time trials (TT) time performance during the Tour de France.
Methods: We collected data in professional cyclists from the first TT of the 1998 Tour de France (TT1, 58 km distance; n = 6 cyclists) and the first (TT2, 56.5 km; n = 5) and second TT of the 1999 Tour de France (TT3, 57 km; n = 5).
Results: A negative relationship was found between power output (W) at VT (VTWatt) and TT final time (s) in TT1 (r = −0.864; p = 0.026; standard error of estimate (SEE) of 73 s; and 95% confidence limits (95% CL) −0.98; −0.18), TT2 (r = −0.77; p = 0.27; SEE of 139 s; and 95% CL −0.98; 0.35), and TT3 (r = −0.923; p = 0.025; SEE of 94 s; and 95% CL −1.00; −0.22).
Conclusions: Actual performance in long TT during the Tour de France (>50 km distance, performed after at least 1–2 weeks of continuous competition), in which some cumulative fatigue inevitably occurs, is related, at least in part, to the power output that elicits the VT. No other routine physiological variable (for example, Vo2max or Wpeak) is related to performance in this type of event.
- 95% CL, 95% confidence limits
- SEE, standard error of estimate
- TT, time trials
- VT, ventilatory threshold
- Wpeak, peak power output
- cycling
- endurance performance
- power output
- ventilatory threshold
- Vo2max
Statistics from Altmetric.com
- 95% CL, 95% confidence limits
- SEE, standard error of estimate
- TT, time trials
- VT, ventilatory threshold
- Wpeak, peak power output
Several studies involving trained cyclists or triathletes have investigated the relationship between physiological variables measured during laboratory bicycle ergometer tests (that is, protocols with gradual workload increases until volitional exhaustion) and actual cycling time trials (TT) performance (average speed, final time, or average power output) up to 40 km distance.1–10 For instance, a significant correlation (>0.90) has been found between maximal muscle power (also termed “peak power output” or Wpeak) achieved during progressive exercise to exhaustion and mean power output1 or final time during a TT of 16.1–20 km distance.3 Less is known, however, about the physiological determinants of long TT (>50 km) performance.
In previous research dealing with the possible determinants of TT performance, well trained but non-professional cyclists have been chosen as subjects.1–10 Some studies examining professional cyclists have described the exercise intensity of actual TT11–13 or the distinguishing physiological characteristics of TT specialists compared to climbing specialists.14,15 These latter investigations have shown higher Wpeak and Vo2max (expressed in l min−1)14 or more economical pedalling patterns during submaximal, highly intense exercise requiring lower motor unit recruitment to sustain equivalent workloads, estimated by surface electromyography.15 However, no previous investigation has identified which variable(s) (Wpeak, Vo2max, ventilatory/lactate threshold, etc) obtained during the routine laboratory gradual tests that most elite cyclists undergo at least once per year is related to long TT performance in the professional category. Thus, assessing the possible relationship between long TT performance and laboratory variables would be of practical applicability for these athletes, for example in terms of identifying those professional cyclists more talented for this specialty or for monitoring specific training induced improvements in TT specialists through laboratory testing. Although a study from the 1980s has reported a significant relationship between long (84 km) TT performance time and some laboratory variables (mostly Vo2max),16 young non-professional cyclists were selected as subjects and thus its results cannot be extrapolated to the professional category. On the other hand, most physiological variables which are currently assessed in the routine evaluation of elite cyclists (that is, the aforementioned Wpeak or ventilatory/lactate thresholds) were not measured.
Systematic research requires that athletes refrain from hard training during the few days prior to any performance test (for example, actual TT). This is indeed the scientifically correct approach for studying the physiological determinants of most endurance events. This is particularly true for single day events where a tapering period allows athletes to reach peak performance at the moment of competition. However, such a methodological approach is prohibited when examining long TT performance during 3 week professional tour races such as the Tour de France, Giro d’Italia, or Vuelta a España. For example, other than the opening prologue (<10 km distance) that is actually not a determinant in the final outcome of the race, the Tour de France traditionally includes one or two long TT (>50 km) that are determinants in the final result of the competition. One of these long TT is usually held after at least 1 week of daily racing and the other one at the end of the third week racing period (that is, on the penultimate day of the event). In fact, a certain state of hormonal exhaustion (decrease in basal (pre-stage) levels of both testosterone and cortisol) occurs by the end of 3 week races.17 Thus, this type of TT provides for an interesting model to study physiologic adaptations to repeated stress and extreme endurance exercise as some professional cyclists are expected to perform at their best despite experiencing cumulative fatigue.
In this study, we investigated the relationship between several physiological variables that can be easily obtained during the routine exercise testing that most professional cyclists perform at least once during the season and actual long TT (>50 km) performance during the Tour de France.
METHODS
Subjects
Following approval from the ethical committee of the Universidad Europea de Madrid, a group of 11 professional road cyclists (table 1) were selected for this investigation. The subjects signed an informed consent form to participate in the study. A previous physical examination at the beginning of the season (which is mandatory for all professional cyclists as determined by the International Cycling Union (ICU) and which includes ECG, echocardiographic evaluation, and blood and endocrine analysis, all of which must be performed in medical centres certified by the ICU) ensured that each participant was in good health. All riders are highly competitive (that is, world class) in the professional category (for example, three top three finishers of the Tour or Vuelta, two TT world champions, and winners of TT in the Tour, Giro, and/or Vuelta).
Characteristics of time trials (TT) and subjects studied
Time trials
We collected data from the first long TT of the 1998 Tour de France (TT1) and the first (TT2) and second long TT of the 1999 Tour de France (TT3) (table 1). We collected data from three cyclists who competed in both TT2 and TT3, and from two cyclists who took part in both TT1 and TT2. Heart rate (bpm) was continuously monitored during the laboratory tests (see below) and during all stages of the race (including TT) using a telemeter (Xtrainer Plus, Polar Electro Oy, Kempele, Finland). Only data from those subjects fully motivated to achieve top performance were taken for each of TT1, TT2, and TT3. Criteria to ensure motivation were: (1) the possibility of winning the TT; and/or (2) the need to perform well in the TT due to high expectations in the overall classification (top 10); and/or (3) the need to perform well in the TT due to team requirements (maintaining first place in the overall team classification). We did not detect the presence of any banned substance in any subject during each of the mandatory anti-doping examinations undertaken before and during the Tour. No subject showed major signs of overtraining during the race (for example, all had normal sleeping patterns (∼9 h/day) and no infectious diseases) and none evidenced major health problems. All of them followed the same nutritional and hydration pattern and timing of food intake during the race, which have been standardised in professional cycling teams over the past few years and which ensure a carbohydrate intake of ⩾12–13 g kg−1 mass.18,19 All the subjects had a high calorie breakfast and lunch within 4–6 h before the corresponding TT, accounting for a total carbohydrate intake of at least 300 g.18
Laboratory testing
We tested each cyclist once before the Tour in which he participated (that is, in 1998 (TT1), in 1999 (TT2 and/or TT3), or in both years for the two subjects competing in TT1 and TT2). The test consisted of a gradual protocol using a conventional cycle ergometer (Ergometrics 900, Ergo-line, Barcelona, Spain). Starting at 20 W, the workload was increased by 25 W min−1 until exhaustion. Subjects were allowed to choose their preferred cadence within the 70–90 rpm range. The tests were terminated when pedal cadence could not be maintained at 70 rpm (at least) for 5 or more seconds. All the subjects had previous experience with this type of protocol which (1) has been used for the physiological evaluation of professional cyclists (that is, detection of Wpeak, Vo2max, or VT) in several previous studies12,15,17,20–22 and (2) is reliable for the detection of the VT.23 Subjects refrained from hard physical training during the day prior to testing (they performed 2–3 h of easy cycling). During the tests, gas exchange data were collected continuously using an automated breath by breath system (in 1998: CPX/D, Medical Graphics, St. Paul, MN, USA; in 1999: Vmax 29C, Sensormedics, Yorba Linda, CA, USA). The following variables were measured: oxygen uptake (Vo2), pulmonary ventilation (VE), ventilatory equivalents for oxygen (VE⋅Vo2–1) and carbon dioxide (VE⋅Vco2–1), and end tidal partial pressure of oxygen (Peto2) and carbon dioxide (Petco2).
Maximal oxygen uptake (Vo2max) was recorded as the highest average Vo2 value obtained for any 1 min period during the tests. At least two of the following criteria were also required for the attainment of Vo2max: plateau in Vo2 values despite increasing power output, respiratory exchange ratio ⩾1.15, or the attainment of age predicted maximum heart rate.24
Peak power output (Wpeak) was determined as follows:14

where Wf is the power output (W) of the last completed workload, t is the time (in s) the last uncompleted workload was maintained, 60 is the duration (in s) of each completed workload, and 25 is the power output difference between consecutive workloads.
The workload (in W) eliciting the ventilatory threshold (VT) was determined using the criteria of an increase in both VE⋅Vo2–1 and Peto2 with no concomitant increase in VE⋅Vco2–1, whereas that eliciting the respiratory compensation threshold (RCT) was determined using the criteria of an increase in both the VE⋅Vo2–1 and VE⋅Vco2–1 and a decrease in Petco2.22 For VT and RCT determination, the values of the aforementioned variables (VE·Vo2–1, Peto2, etc) were averaged for every 1 min period (that is, every 1 min workload) and plotted against workload (in W, which increased at a rate of 25 W min−1, as mentioned above). Two independent, experienced observers detected VT and RCT. If there was disagreement, the opinion of a third investigator was obtained.22 This method of VT/RCT detection with the current gradual protocol has been used in numerous studies with professional cyclists.12,15,20–22
Accumulated exercise loads before time trials
We estimated total exercise loads (that is, intensity×volume) accumulated by the subjects before each TT by using a novel approach to the training impulse (TRIMP) based on a method recently developed by Foster et al.25 This method, which has been recently reported to estimate total exercise loads in 3 week professional races,21 uses heart rate data during exercise to integrate both total volume, on one the hand, and total intensity relative to three intensity zones, on the other (zone 1 or light intensity: HR below that eliciting the VT; zone 2 or medium intensity: HR between that eliciting the VT and that the RCT; zone 3 or high intensity: HR above that eliciting the RCT). Briefly, the score for each zone is computed by multiplying the accumulated duration in this zone by a multiplier for this particular zone (for example, 1 min in zone 1 is given a score of 1 TRIMP, 1 min in zone 2 is given a score of 2 TRIMP, and 1 min in zone 3 is given a score of 3 TRIMP). The total TRIMP score is then obtained by summating the results of the three zones.
Data analysis
The Kolmogorov-Smirnov test was applied to ensure a Gaussian distribution of the data. Pearson product-moment correlation coefficients (and the corresponding standard error of estimate (SEE) and 95% confidence limits (95% CL)26) were calculated to determine whether there was a significant relationship between TT performance time (total time to complete each of the three TT, in s), and conventional physiological variables determined during the previous gradual test, that is, Vo2max (ml min−1, ml kg−0.32 min−1, and ml kg−1 min−1), Wpeak (expressed as W, W kg−0.32, and W kg−1), VT and RCT (both expressed as W, W kg−0.32, W kg−1, and % Vo2max). The aforementioned physiological variables were expressed in absolute units (ml min−1 for Vo2max and W for VT and RCT) and also relative to mass exponents of 0.32 and 1 following the recommendations of Padilla et al for physiological evaluation of cycling ability (for example, TT ability) in professional cyclists.14 In order to discard the possible influence of individual variations in previously accumulated effort on subjects’ performance (for example, better performance in those subjects accumulating lower TRIMP scores before the TT), we calculated the relationship between performance time in each TT and accumulated TRIMP score from the start of the Tour to this time point of the competition with a Spearman’s rho test. The level of significance was set at p<0.05 for all statistical analyses and results are expressed as mean (SD).
RESULTS
The results of the laboratory tests are shown in table 1. Both independent experienced researchers were in agreement for VT and RCT detection in 12 of the tests (∼92% of total). In the only test where the opinion of a third observer was assessed for VT and RCT detection, there existed agreement with one of the two other researchers and VT and RCT were finally detected based on this agreement. Similar findings have been obtained in previous research in which VT and RCT were determined in professional cyclists using the same protocol.22
Total TRIMPs accumulated by the subjects before each TT are shown in table 1. No significant correlation was found in any TT between performance and accumulated TRIMPs, suggesting that variations in TT performance were not attributable to individual variations in subjects’ total exercise loads accumulated before each TT.
Tour 1998 (TT1)
Two of the six subjects finished TT1 within the top 11 (⩽158 s lost to the TT final winner, Jan Ullrich). A significant relationship was found between power output (W) at VT (VTWatt) and TT1 final time (s) (r = −0.864; p = 0.026; SEE of 73 s; and 95% CL −0.98 and −0.18) (fig 1). No other significant correlation was found between TT1 performance time and each of the other variables obtained from the exercise tests.

Regression equation of the relationship between final time performance in TT1 (first long time trial of the 1998 Tour de France, 58 km distance) and power output at the ventilatory threshold (VTWatt).
Tour 1999 (TT2 and TT3)
One subject finished both TT2 and TT3 in second position (⩽57 s lost to the TT winner in both TT, Lance Armstrong). In TT2 (n = 5), no significant correlation was found between TT2 final time and each of the other variables obtained from the exercise tests, including VTWatt (r = −0.77; p = 0.27; SEE of 139 s; and 95% CL −0.98 and 0.35 for TT2 final time v VTWatt).
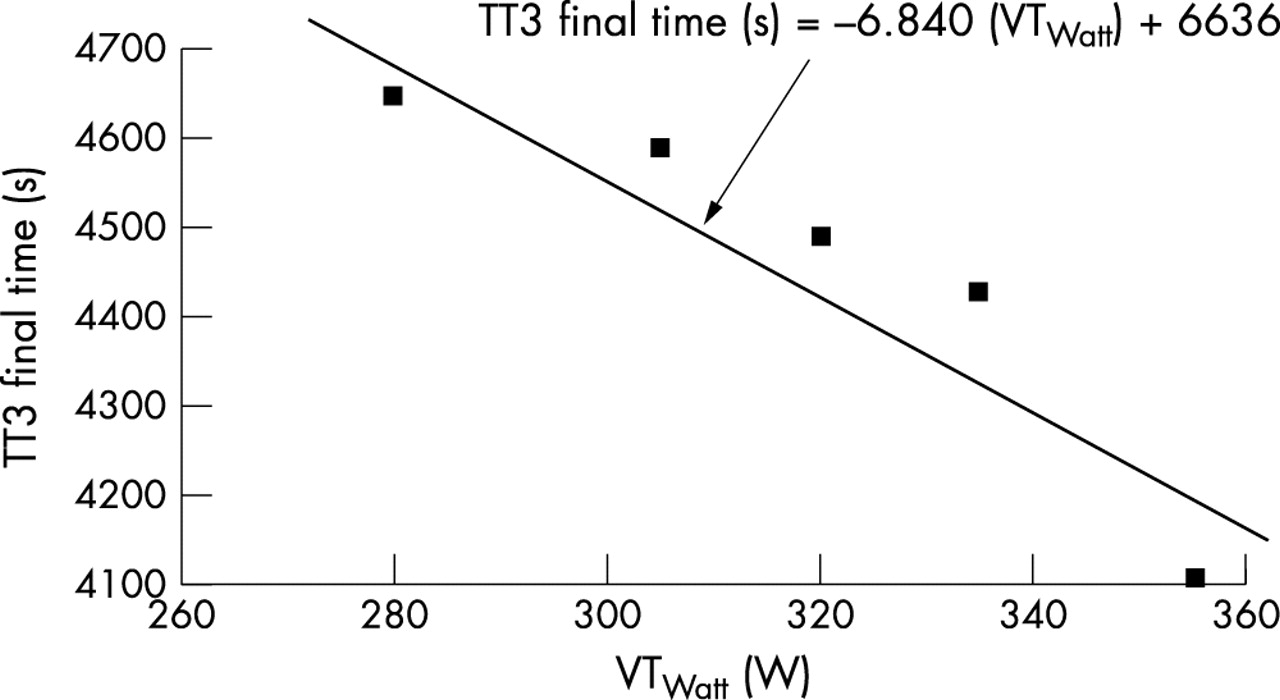
In TT3 (n = 5), a significant relationship was found between VTWatt and TT3 final time (r = −0.923; p = 0.025; SEE of 94 s; and 95% CL −1.00 and −0.22) (fig 2). No other significant correlation was found between TT3 performance time and each of the other variables obtained from the exercise tests.

Regression equation of the relationship between final time performance in TT3 (second long time trial of the 1999 Tour de France, 57 km distance) and power output at the ventilatory threshold (VTWatt).
DISCUSSION
The main finding of our study was that actual performance in long TT (>50 km distance) during the Tour de France (in which some cumulative fatigue is likely to occur after one or more weeks of continuous competition) is related, at least in part, to the power output that elicits the VT during a gradual laboratory test. Indeed, we found a high correlation between the wattage at VT and TT performance time in the three TT studied, and statistical significance was reached in two of them despite the small sample of subjects studied. No other physiological variable (Vo2max, Wpeak, etc) was related to TT performance time. Several studies with trained but non-professional cyclists have investigated the relationship between the aforementioned variables measured during gradual laboratory tests and performance during TT of 15–44 km distance.1–10 In these studies, subjects refrained from hard training at least 24 h before the TT and were assumed to be well rested so as to reach peak performance. Although this experimental model is correct for most single day endurance competitions, it cannot be used to analyse the performance determinants of a long TT held during the most important professional cycling events such as the Tour de France. Indeed, these competitions are highly demanding on cyclists, as suggested by a recent report which showed a certain state of hormonal exhaustion (that is, decrease in basal (pre-stage) levels of testosterone, cortisol, and melatonin) in a group of riders during the 1999 Vuelta.17 To date there are no other studies that have demonstrated a significant decrease in the basal levels of both testosterone and cortisol after only 3 weeks of strenuous exercise, which suggests the uniqueness of tour races in terms of physiological demands. In addition, cyclists are able to cover flat stages (held mostly during the first half of the Tour) at very high average velocities (∼45 km h−1). This requires that they push high gears (that is, 53×12–11) for long periods even if overall exercise intensity is rather low during this part of competition and inevitably results in some degree of muscle damage later in the race (that is, increased blood concentration of biochemical markers of muscle damage27). These phenomena would be expected to affect, at least partly, muscle performance during long TT, usually held at the end of the first and third week of the race, respectively.
Although unanimity does not reign in the results of previous research on TT (∼15–40 km) performance, it could be generalised that Wpeak (also termed “maximal aerobic (or muscle) power” by some authors) is the best possible performance predictor. (Performance been expressed either as total TT time or TT average power output.) For instance, a high, significant correlation (>0.90) has been found between Wpeak achieved during progressive exercise to exhaustion and either mean power output1 or final time during a TT of 16.1–20 km distance.4 However, the strong relationship between Wpeak and TT performance does not necessarily imply that any significant improvement in Wpeak brought about by an intense training program has a direct effect on TT performance.28,29
For instance, Westgarth-Taylor et al29 found that high intensity training increased Wpeak, but there was no significant relationship between the change in Wpeak and a decrease in 40 km time. It has been postulated that cycling performance is a combination of the cyclists’ absolute Wpeak and their ability to sustain a high percentage of Wpeak and that Wpeak could account for 70–90% of the variation in TT performance time.28 According to Noakes,30 maximal aerobic power may be related to peripheral factors (that is, muscles’ capacity for high crossbridge cycling and respiratory adaptations) rather than to oxygen supply limitations. During long TT in professional cycling, the main variable related to performance (VTWatt) is also thought to reflect muscle rather than central adaptations (as explained below).
Some attempts have been made to specifically assess the correlation between submaximal ventilatory variables (that is, VT and RCT) and TT performance in non-professional cyclists. Hopkins and Mckenzie6 found that VTWatt was correlated with race performance time and calculated power output during the competition (r = −0.81 and r = 0.82, respectively). Power output at VT and Vo2max accounted for 75% of the variance between subjects (r = 0.91) in performance time. In our study, however, Vo2max was not significantly related to TT performance. In line with our present findings, it has been previously shown that Vo2max, a variable that is mainly limited by maximal cardiac output, is not necessarily a good performance predictor in the professional category.20 Long TT, especially during the third week of the Tour (for example, TT3 in the current study), are held at submaximal intensities, that is, with an important contribution of zone 2 (below RCT or ∼70–90% Vo2max), as shown in table 1.
Both cumulative muscle fatigue and the long duration (>60 min) of this type of effort are responsible for the relatively low percentage of zone 3 contribution, especially in those TT held at the end of the 3 week period. For instance, the performance of one of our subjects in the last TT of the 1999 Tour was similar to that of the TT winner, Lance Armstrong, being separated by only 9 s in the final TT, despite a relatively low percentage of time spent in zone 3 (9% of total time or only ∼6 min out of a total of ∼68 min). In contrast, in the first TT of the 1999 Tour, the contribution of zone 3 amounted to 68% (or ∼50 min) of his total TT time. Thus, other physiological variable reflecting cyclists’ ability to tolerate high, but submaximal workloads (70–90% Vo2max) during long periods of time (>60 min) is likely to determine, at least partly, TT performance during 3 week races. Such a variable seems to be VTWatt. At the VT, pulmonary ventilation (VE) increases in response to the rise in CO2 output resulting from buffering of lactic acidosis.31 Such an increase in VE maintains arterial partial pressure of CO2 (Paco2) and pH within normal levels (the so called “isocapnic buffering”). Thus, the occurrence of VT at high power outputs (that is, ⩾350 W in the best time trialists of this study) is thought to reflect the muscles’ ability to generate high power outputs during long exercise bouts while adequately maintaining acid balance status.
What is already known
Previous studies in well trained, non-professional cyclists have reported on the relationship between several routine physiological indicators of endurance performance and actual time trial performance during individual events up to ∼50 km. These include peak power output, Vo2max, lactate and/or ventilatory (VT) thresholds.
What this study adds
The main finding of our study was that actual performance time in long TT (>50 km distance) during the Tour de France is related, at least in part, to the power output eliciting VT. No other laboratory variable seems to be related to TT ability.
One potential limitation of our study stems from the fact that we did not measure actual power output during TT. Indeed, the relationship between power output and speed is dependent on factors such as wind speed and direction, ambient temperature, and atmospheric pressure as well as body size, racing position, and bicycle design. The latter factor was largely controlled for since in each of the three TT, all but one subject (the team leader) used the same type of bicycle. On the other hand, previous studies have reported strong, significant relationships between actual (field) TT time (as measured in our study) and average power output during TT.3,4,8 Although a valid portable device (the SRM system) can be used to measure power output during actual cycling and some professional riders are currently using this device during training sessions and in some races, to the best of our knowledge no professional cyclist used this system during the stages of the 1998 or 1999 Tour de France, and very few (if any) are using it during the more recent race editions, especially during TT. Finally, commercial contracts between professional teams and manufacturers of bicycle components such as pedal cranks and chainrings make it unlikely that most professional cyclists will use this useful device in the next editions of the Tour de France. Our data are also limited by the small subject sample in each particular TT. In this regard, it must be emphasised to the reader how difficult it would be in a field study such as the present one to gather valid data from additional subjects who are professional cyclists both motivated to perform maximally during a TT of the Tour de France and having been tested with the same laboratory protocol.
In summary, actual performance in long time trials (>50 km distance) during the Tour de France is related, at least in part, to the power output that elicits the VT. No other physiological variable (for example, Vo2max or Wpeak) seems to be related to performance in this type of event.
REFERENCES
Footnotes
-
Conflict of interest: none declared.