Article Text

Abstract
Objectives: To compare metabolic and cardiorespiratory responses between subjects undergoing incremental treadmill (non-specific) and tennis field based (sport specific) tests.
Methods: Nine junior competitive tennis players randomly performed two incremental protocols to exhaustion: a treadmill test (TT) and a tennis specific fitness test (FT). The FT consisted of repeated displacements replicating the game of tennis at increasing speed on a court. In both tests, ventilatory variables and heart rate (HR) were determined at the ventilatory threshold (VT), respiratory compensation point (RCP), and maximal loads (max). Blood lactate concentration was determined at the point of volitional fatigue.
Results: Percentage (mean (SD)) maximal HR (83.6 (5.1) v 83.0 (2.8) and 92.1 (2.1) v 92.3 (2.1)%, respectively) and percentage maximal oxygen uptake (VO2max) (69.4 (8.1) v 73.5 (6.1) and 84.4 (6.5) v 85.5 (8.7)%, respectively) at the VT and RCP were not different between the FT and TT subjects, whereas VO2max was higher in the FT than in the TT (63.8 (3.0) v 58.9 (5.3) ml/min/kg; p<0.05). Blood lactate concentration (10.7 (3.0) v 10.6 (4.3) mmol/l) did not differ between the TT and FT.
Conclusions: Although cardiorespiratory variables were not different at submaximal intensities between the two tests, VO2max values derived from laboratory measurements were underestimated. Using field testing in addition to treadmill testing provides a better measurement of a player’s individual fitness level and may be routinely used to accurately prescribe appropriate aerobic exercise training.
- FT, fitness test
- HR, heart rate
- RCP, respiratory compensation point
- RPE, rating of perceived exertion
- Te, time to exhaustion
- TT, treadmill test
- VCO2, carbon dioxide production
- VE, minute ventilation
- VO2max, maximal oxygen uptake
- VT, ventilatory threshold
- field testing
- performance
- physiological responses
- racquet sport
- training
Statistics from Altmetric.com
- FT, fitness test
- HR, heart rate
- RCP, respiratory compensation point
- RPE, rating of perceived exertion
- Te, time to exhaustion
- TT, treadmill test
- VCO2, carbon dioxide production
- VE, minute ventilation
- VO2max, maximal oxygen uptake
- VT, ventilatory threshold
The exercise profile in tennis consists of intermittent periods of near maximal intensity (5–10 s) followed by longer resting periods (10–20 s) for a prolonged period of time (1–5 h).1,2 Increasing evidence suggests that technical and tactical skills, psychological preparation, game strategy, motor skills such as power, strength, agility, speed, and explosiveness, and a highly developed neuromuscular coordinating ability are strongly correlated with tennis tournament performance.3 Nevertheless, a major determinant of the outcome of the modern game in tennis is the player’s aerobic fitness, which not only enables the player to repeatedly generate explosive strokes and complete rapid on-court movements but also ensures fast recovery and contributes to maintaining concentration and preparation for the next rally during extended play.4,5
To date, a variety of test procedures have been used to evaluate performance ability in tennis players.6,7,8,9,10,11,12 The standard test for assessing aerobic fitness is the direct measurement of the player’s maximal oxygen uptake (VO2max) while running to exhaustion on a treadmill in a laboratory environment. Studies using breath by breath gas exchange measurements have identified two specific ventilatory changes that correspond to the ventilatory threshold (VT) and the respiratory compensation point (RCP).13 These reproducible ventilatory breakpoints appear to provide useful markers to characterise training effects, evaluate physical fitness, and identify target training areas that are distinguished by meaningful differences in sympathetic stress load, motor unit involvement, and duration to fatigue.14 However, during treadmill testing, the mode of exercise (continuous activity) cannot simulate the specific demands of tennis (intermittent activity) and does not reflect the specific muscular involvement of both lower and upper limbs with respect to the stop, start, and change of direction movement patterns.12
Recent efforts have been made to develop field tests in tennis in order to determine the exercise capacity or technical performance of athletes with an acceptable accuracy under standardised conditions.6,7,8,9,10,11 However, because these tests require expensive equipment (that is a ball machine, video, or radar6,9–11), only simulate rallies from the baseline,9 or do not reflect precisely the time intervals of tennis play,6 they cannot be routinely used to accurately evaluate an individual player’s fitness level in conditions similar to game play. In addition, although specific fitness tests for badminton15,16 and squash17,18 have been proposed to assess the metabolic and physiological demands of these sports, there are few tennis field procedures to help determine the exercise capacity of athletes and the appropriate on-court training intensity.
Therefore, the aims of this study were: (a) to develop a tennis specific incremental fitness test which included some elements of tennis play; and (b) to compare physiological responses recorded during this field test with those observed during an incremental treadmill test. We hypothesised that the physiological responses would differ because of the different movement patterns between the tennis specific (combined use of arms and legs) and treadmill (forward running only) tests.
METHODS
Subjects
Nine male junior competitive tennis players (mean (SD) age 16.0 (1.6) years; height 179.8 (9.4) cm; body mass 65.3 (11.9) kg; training frequency 8.2 (3.1) h/week) competing at regional and national levels (international tennis ranking ranging from 2 to 4) volunteered to participate in the study. All players were from the regional under-18 squad. Both the players and their parents provided written informed consent for the study, which was approved by the Ethics Committee of the University of Montpellier, France.
Study protocol
All subjects carried out two incremental protocols to exhaustion in randomised order: a treadmill test (non-specific) and a tennis fitness test (sport specific). Each test was conducted under standard environmental conditions (temperature ∼20°C, relative humidity ∼50%) at the same time of day.
Experimental procedures
Treadmill testing
The treadmill incremental test to exhaustion (TT) was performed on a motorised treadmill (S 2500, Tecmachine, Andrézieux-Bouthéon, France) and consisted of an initial 3 min continuous workload at 9 km/h followed by increases of 0.5 km/h every minute (0% incline). Each stage was composed of a 45 s running period followed by 15 s of active recovery during which subjects had to walk at 5 km/h. The test ended with voluntary exhaustion of the subjects.
Field testing
A tennis specific incremental fitness test (FT) was developed in which subjects repeated displacements replicating the game of tennis, at an increasing speed on the court. Each stage consisted of seven shuttle runs, performed from a central base to one of six targets located around the court, alternated with 15 s of passive recovery (fig 1). The sets of seven displacements included two forward (offensive), three lateral (neutral), and two backward (defensive) courses performed randomly. When the subject arrived at the target, he was instructed to mime a powerful stroke as in official competition before moving back to baseline after each drive. Subjects were asked to use the same running technique as in competition. The duration of the first sequence of seven runs was 40.5 s which progressively decreased by 0.8 s for each stage. Movement velocities and directions were controlled by visual and sound feedback from a PC. Briefly, specialised software was used to simultaneously activate a tune and project a picture of a player moving towards the target. These velocities and sequences of movement were calculated from data collected during official competitions (unpublished data). The test ended when the player failed to reach the target in time (that is, a >1 m delay occurred) or was no longer able to fulfil the criteria of the test (that is, perform strokes with an acceptable technique).
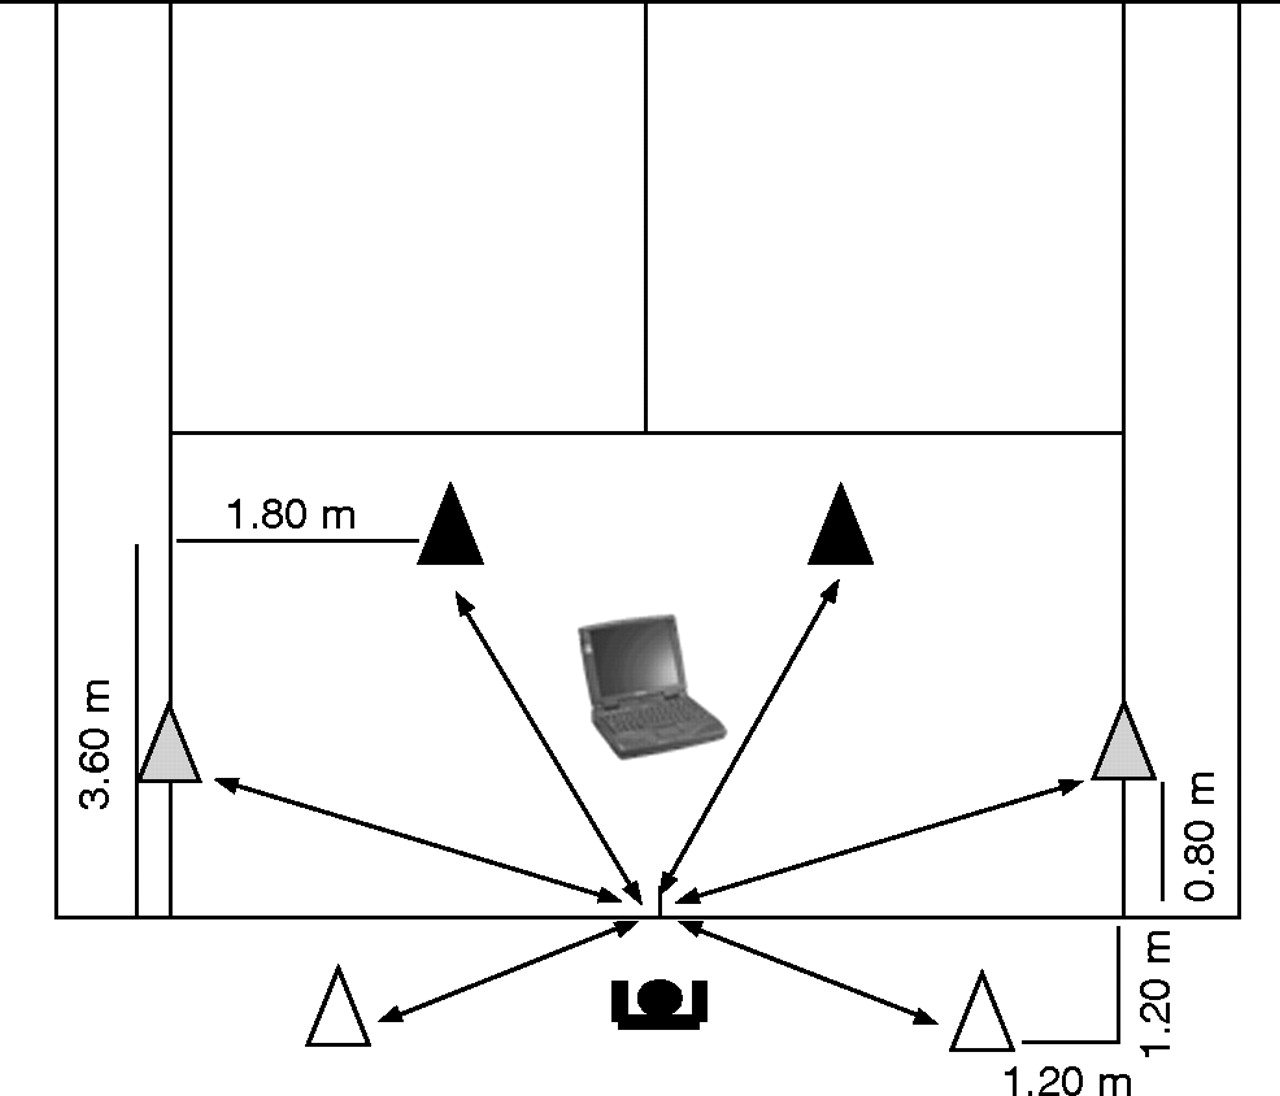
Set up of the specific incremental fitness test for tennis players. The positions of forward (black cones), lateral (grey cones), and backward (white cones) targets are indicated. See Methods section for further details.
Physiological measurements
During the TT (CPX/D; MedGraphics, Saint Paul, MN, USA) and FT (K4b2; Cosmed, Rome, Italy), the following gas exchanges data were measured using breath by breath gas analysers which were calibrated prior each test using the manufacturers’ recommendations: VO2, carbon dioxide production (VCO2), respiratory exchange ratio (RER = VCO2/VO2), minute ventilation (VE), breathing frequency, and tidal volume. The 5 s heart rate (HR) values were recorded by HR monitor with the athletes wearing a chest belt (S810, Polar, Kempele, Finland). The difference between the two analysers has been shown to be non-significant19 and in our laboratory the differences in VO2 values between the analysers were less than 2%.20 The Cosmed K4 system weights only 0.7 kg and was carried on the trunk (the main sample unit on the back and a battery pack on the chest). Rating of perceived exertion (RPE) responses were recorded using the Borg 6–20 scale and 25 μl capillary blood samples were taken from the fingertip and analysed for blood lactate concentrations ([La]) by using the Lactate Pro (LT-1710, Arkray, Japan) portable analyser at the point of volitional fatigue.
In both tests, the gas samples were averaged every 15 s, and the highest values for VO2 and HR over 15 s were regarded as VO2max and heart rate (HRmax). Four criteria were used to determine maximal efforts21:
-
a plateau or levelling off in VO2, defined as an increase of less than 1.5 ml/min/kg despite progressive increases in exercise intensity,
-
a final RER of 1.1 or above,
-
a final HR above 95% of the age related maximum, and
-
a final [La] above 8 mmol/l.
Time to exhaustion (Te, s) was recorded in each test.
Determination of VT and RCP
VT was determined using the criteria of an increase in VE/VO2 with no increase in VE/VCO2 and departure from the linearity of VE, whereas RCP corresponded to an increase in both VE/VO2 and VE/VCO2.22 All assessments of the VT and RCP were made by visual inspection of graphs of time plotted against each relevant respiratory variable measured during testing. The visual inspections were carried out by two experienced exercise physiologists. The results were then compared and then averaged. The difference in the individual determinations of VT and RCP was <3%. Each physiological variable corresponding to VT, RCP, and maximal load was expressed in absolute terms and relative to VO2max and HRmax.
Statistical analysis
Mean (SD) was calculated for all variables. Four subjects performed two FTs within 4 days to assess its reliability. This was done by calculating the relative difference and the coefficient of variation between test and re-test. Data obtained at VT, RCP, and maximal load were compared between FT and TT using paired sample t tests. VO2, VE, and HR curves were compared using a two factorial analysis of variance (factor 1: FT v TT; factor 2: measurement time). The Bonferroni test was used for post hoc comparisons. Pearson’s product moment correlation coefficient was used to determine relationships between maximum values of the various parameters attained by subjects at the termination of the FT and TT. Statistical significance was accepted at p<0.05. The statistical analyses were performed using SigmaStat 2.03 software (Jandel, San Rafael, CA, USA).
RESULTS
Reproducibility
No differences were found in Te, VO2, HR, [La], RPE, VT, or RCP between two FTs performed within 4 days (n = 4) (table 1).
Coefficient of variation (CV) of selected parameters between two tennis specific incremental field tests (FT) performed within 4 days (n = 4)
Te, [La], and RPE
Te (1666 (188) v 1491 (64) s; 10.5%) was higher (p<0.05) in TT than in FT. Mean values of [La] (2.2 (0.5) v 2.2 (0.6) and 10.6 (4.3) v 10.7 (3.0) mmol/l) and RPE (9.0 (2.1) v 8.6 (2.1) and 17.7 (1.0) v 18.5 (0.9)) measured before and after exercise did not differ between TT and FT, respectively.
Physiological variables at submaximal intensities
There was a significant effect of measurement time (p<0.001) as evidenced by progressive increases in VO2, VE, and HR both in FT and TT (fig 2). Over the duration of the test, submaximal VO2 (p = 0.514), VE (p = 0.109), and HR (p = 0.660) did not differ between TT and FT. VO2 (p<0.001) and VE (p<0.001) displayed a significant interaction effect between measurement time and testing condition, whereas only a tendency was observed for HR (p = 0.09).

Oxygen uptake (VO2, A), minute ventilation (VE, B), and heart rate (HR, C) in during the tennis field (FT) and treadmill (TT) tests in tennis players (n = 9). Data are expressed as a function of time to exhaustion.
Physiological variables at VT, RCP, and maximal load
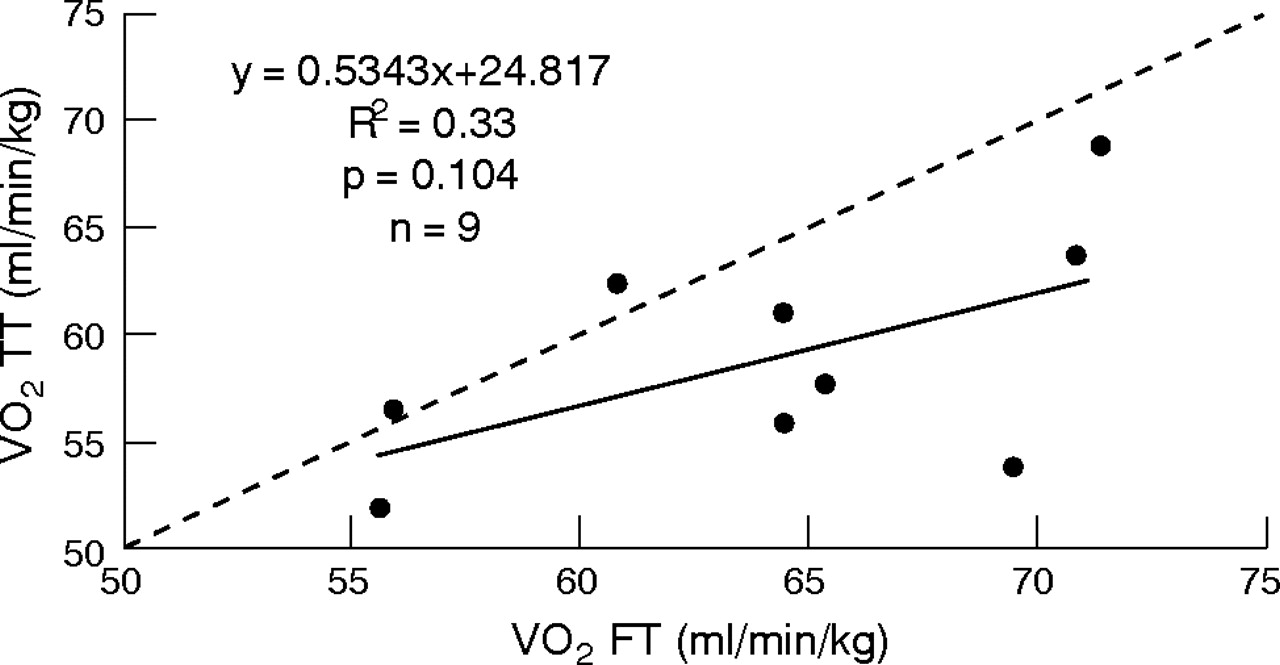
At VT and RCP, VCO2 and RER values were significantly higher in FT than in TT (tables 2 and 3). It is of interest to note that %HRmax and %VO2max at VT and RCP were not different between FT and TT. Again, VO2, VCO2, and RER values measured at maximal loads were significantly higher in FT than in TT (table 4). Table 5 describes the percentage of athletes who fulfilled the different criteria for a maximum effort in the two tests. Table 6 shows the correlation coefficients of the maximum values attained by the subjects at the termination of exercise during the two incremental tests. The relationship between VO2max measured during the FT and that measured during the TT (r = 0.58, p = 0.104) is presented in fig 3.
Physiological values in tennis players corresponding to the ventilatory threshold (VT) in tennis field (FT) and treadmill (TT) tests (n = 9)
Physiological values in tennis players corresponding to the respiratory compensation point (RCP) in tennis field (FT) and treadmill (TT) tests (n = 9)
Physiological values in tennis players corresponding to the maximum work load in tennis field (FT) and treadmill (TT) tests (n = 9)
Number of athletes who satisfied the criteria for a maximum effort
Correlation coefficients between tennis field (FT) and treadmill (TT) tests for the maximum values of the various parameters attained by tennis players at the termination of the exercise

Relationship between maximal oxygen uptake (VO2max, ml/min/kg) determined during the tennis field (FT) and treadmill (TT) tests. The dashed line represents the line of unity.
DISCUSSION
Determination of aerobic fitness is assumed to be highly dependent upon the mode of testing in continuous activities, which means that runners are generally tested on a treadmill, rowers on a rowing ergometer, and cyclists on a cycle ergometer.23 The physiological demands in racquet games such as tennis are highly influenced by the fact that players have to repeatedly accelerate, decelerate, change direction, move quickly, maintain balance, and generate optimum strokes.2 Laboratory testing on a treadmill cannot simulate the specific muscular involvement of both lower and upper limbs with respect to the changes in pace and direction in tennis and therefore is inadequate to evaluate the specific demands of this game.8,9,12 As a consequence, we designed a tennis specific incremental fitness test which included some technical characteristics (it is performed on a tennis court, the displacement technique is similar to that in competition, there is uncertain direction of motion, and ball hitting is simulated). It is of interest that the FT had a high reproducibility, illustrating that this test is sensitive and valid for providing information on a player’s fitness level and target training areas. Since subjects wore the 0.7 kg Cosmed K4 system during the FT, one may assume that their VO2max expressed relative to body mass was slightly underestimated. In the present study, the difference in the original VO2max value between wearing the portable device or not was 1.1±0.2% and therefore did not modify the main findings of this study. This is supported by previous findings24 that reported that a 0.1 kg additional weight carried on the trunk (near the centre of gravity) only caused a 0.1% increase in VO2.
Submaximal intensities
Although questions remain regarding the cause-effect relationship among ventilatory, lactate, EMG, and sympathetic hormone changes during incremental testing,14 by comparing visual and computerised methods, Santos and Giannella-Neto13 have recently confirmed that VT and RCP are valid and reliable markers for establishing target training areas. Surprisingly, only limited data are available regarding VT and RCP values in tennis players since VO2max has traditionally been considered to be the gold standard. However, there is increasing evidence that the ventilatory breakpoints may be better predictors for submaximal endurance performance.22 This is especially true in tennis where the performance is multifaceted, involving technical, tactical, psychological, and physiological factors.2 The intensity at VT and RCP found in the present study for junior competitive tennis players is higher than that generally reported for physically active subjects (80 v 90% of HRmax and 50 v 80% of VO2max at VT and RCP, respectively).14 Comparing the metabolic profiles of young tennis players and untrained boys, Mero et al25 reported that tennis players had significantly lower VO2 at the RCP (38 v 47 ml/min/kg) than controls but with the same corresponding treadmill speed and the same VO2max. According to König et al,5 high VT and RCP values could reflect the ability to tolerate high exercise intensity during tennis competitions. These ventilatory breakpoints values are, however, lower than those (88 v 95 and 85 v 91% of the HRmax and VO2max for VT and RCP, respectively) reported recently in elite squash players tested in a similar manner as in the present test but with time intervals specific to the squash game (shorter 10 s resting periods between stages, and longer stage durations with nine simulations of ball hitting).17 The discrepancies between these studies are mainly the result of the training status of the subjects. Nevertheless, comparing results between studies is awkward since subject characteristics, equipment, protocols, and test modes as well as the methods used to detect ventilatory breakpoints are often different.
An interesting finding of the present study is that the load increments during TT and FT were similar as evidenced by the progressive increases in VO2, VE, and HR (fig 2) and by the fact that rest intervals (15 s) were identical in the two tests. These data are not in good agreement with previous findings8,9 which reported lower submaximal HR and VO2 values during laboratory testing than under sport specific conditions. It has been shown that the length of the stage per se affects the peak metabolic responses during an incremental test.26 However, even stages of very different duration (3 v 8 min) did not result in different submaximal values (for example, at onset of blood lactate accumulation).27 In the present study, the difference in stage duration between FT and TT was very short. One may therefore assume that the two different protocols did not result in different submaximal values. The lack of difference in physiological variables (%HRmax and %VO2max) at VT and RCP between the two tests suggests that treadmill testing remains the gold standard to detect ventilatory breakpoints in order to define specific target areas for tennis on-court aerobic exercises. Interestingly, the VT intensity found in our players is similar to the relative HR and VO2 reported for tennis competitions (70–90% of HRmax and 60–75% of VO2max).1,2,5,28 This is, however, not consistent with the findings of Mero et al25 who suggested that tennis is played on average at an intensity slightly below RCP.
Maximal loads
The mean end exercise VO2, HR, and [La] values showed that during the last stages of both tests players experienced elevated cardiovascular stress and that the anaerobic energy system worked hard to provide energy. It is interesting to note that HR responses during the last stages of TT and FT were similar to the levels observed during intense tennis match play (190–200 bpm).5 Also, at maximal loads, [La] and RPE were similar in both tests, which differs from previous findings reporting higher [La] values following treadmill than field testing.8,9 A possible explanation could be the intermittent exercise pattern of the present treadmill test contrasting with previous protocols with a continuous load profile. Indeed, it is well established that lactate can be oxidised locally or transported from production sites to oxidative muscle fibres for subsequent oxidation during recovery periods.29
VO2max values measured in the FT and TT are in a similar range or slightly higher than those reported previously (50–60 ml/min/kg) in players of similar standard.1 This confirms that high aerobic power is a prerequisite in tennis to successfully sustain an elevated level of technical, tactical, physiological, and psychological capacity during several hours. It is also interesting that the VO2, VCO2, and RER values were significantly higher in the FT than in the TT at maximal loads, suggesting that VO2max values derived from laboratory testing were not relevant for an accurate estimate of fitness in tennis players. Although the design of the two tests meant exercise levels varied, it is noteworthy that during the FT, players were asked to perform repeated specific displacements in all directions with changing pace. These specific patterns included accelerations, decelerations, changeovers as well as upper arm involvement with racquet holding and stroke miming actions. In contrast, running on a treadmill was only characterised by a steady pace and little or no lateral movement. As suggested by Smekal et al,9 one may therefore assume that greater muscle mass was involved during the FT and that muscles were recruited at a higher rate than during the TT, which may have in turn increased VO2 in the FT.
What is already known on this topic
-
Recent efforts have been made to develop field tests in tennis in order to determine the exercise capacity or technical performance of athletes with acceptable accuracy under standardised conditions
-
There are few incremental tennis field procedures to assess the technical and physiological demands of the sport
While most of the subjects satisfied the criteria of maximal effort in both tests, showing that they were effectively exhausted after TT and FT, it is however interesting to note that none satisfied the RER criteria in TT. This finding is derived from the smaller VCO2 values observed at maximal loads in TT than in FT, which may be caused by the different modes of exercise in the two tests. The observation that RER was significantly lower in TT than in FT due to a lower VCO2 is surprising, especially at RCP where Bf and VE were higher. It is classically described that the disproportionate increase in VCO2 versus VO2 in incremental exercise is due to the production of CO2 in muscle because of lactic acid buffering by plasma bicarbonate. Recently, it was also shown that this increase in VCO2 is due to hyperventilation and not the reverse.30 But our results did not seem to be due to any of these metabolic causes since hyperventilation in TT was concomitant with a lower VCO2. However, ventilatory regulation is controlled by central integration of a number of chemical and neuromechanical factors. It is known that there is coordination (“entrainment”) between limb (and especially upper limbs) movements and breathing.31 Active breathing is modified if muscles are simultaneously involved in arm movements and breathing due to change in the mechanics of ventilation (forces acting on the trunk and thorax plus active upper body muscles). In the present study, one may postulate that during FT, since the subjects were asked to mime a powerful stroke and to use a specific running technique, the respiratory-locomotion coupling was very different from that during forward running on a treadmill. It is interesting that the increase in Bf between VT and RCP was twofold larger in TT (+12.8 breaths/min) than in FT (+5.7 breaths/min). Stride frequency increases progressively during an incremental test on treadmill, whereas, due to mechanical constraints, this is probably not the case to the same extent during TT. Another interesting finding is that there was no significant correlation between VO2max values evaluated from field and treadmill testing, with a greater number of subjects attaining a higher VO2max during the FT. Overall, these results indicate that the determination of maximal aerobic power in a group of competitive tennis players is more accurate under sport specific conditions.
What this study adds
-
Maximum oxygen uptake values derived from laboratory testing were not relevant for accurately estimating fitness in tennis players
-
Using field testing in addition to treadmill measurements provides a better measurement of physical performance and may be routinely used to accurately prescribe aerobic exercise in a context appropriate to the game
CONCLUSION
In conclusion, although physiological variables were not different at submaximal intensities between the two tests, suggesting that treadmill testing gives valid information for detecting ventilatory breakpoints in order to establish levels of tennis on-court aerobic exercise, VO2max values derived from laboratory measurements were significantly lower than those measured under sport specific conditions. VO2max values derived from treadmill testing were therefore not relevant to accurately estimate fitness in junior competitive tennis players. Furthermore, the present study showed that the FT had high reproducibility. Thus, using field testing in addition to treadmill testing provides a better measurement of a player’s individual fitness level and may be routinely used to accurately prescribe appropriate aerobic exercise training.
REFERENCES
Footnotes
-
Published Online First 19 July 2006
-
Competing interests: none declared