Article Text

Abstract
Background A history of ankle injury is known to be associated with an increased risk of future injuries. Prevention of a first-time injury to an ankle will also prevent subsequent re-injury; yet these participants are often overlooked in reports of preventive testing. Determining the functional deficits which promote injury risk in all ankles, through studies inclusive of previously injured and never injured ankles, will enable training to be directed at improving known deficits in all sports participants.
Objective To review studies investigating the measurement of intrinsic functions in healthy ankles and assess their predictive value for injury.
Method Systematic review and meta-analysis of journal articles from selected electronic databases. Using all papers that included sufficient data for extraction in any paradigm, the authors pooled results for measures of strength, postural control, proprioception, muscle reaction time in response to perturbation, range of movement and ligament stability.
Results Thirteen papers were found with adequate data reporting to allow calculation of pooled standardised mean difference (SMD) or pooled RR. The following are all associated with an increased risk of ankle injury: higher postural sway (SMD=0.693, 95% CI=0.151 to 1.235, p=0.012), being in the lower postural stability group (RR=2.06, 95% CI=1.364 to 3.111, p=0.001), lower inversion proprioception (0.573, 0.244 to 0.902, <0.001), higher concentric plantar flexion strength at faster speeds (0.372, 0.092 to 0.652, 0.009) and lower eccentric eversion strength at slower speeds (0.337, 0.117 to 0.557, 0.003).
Conclusion There is a set of intrinsic functional and structural ankle deficits associated with significantly increased risk of ankle injury. These findings will enable clinicians and sports trainers to measure and train specific deficits in sports people for the prevention of ankle injury.
Statistics from Altmetric.com
Introduction
In court and field sports, the ankle is one of the most frequently injured body regions.1 Injury to an ankle puts an individual at risk of chronic ankle dysfunction.2 In a general clinical population, 73 % of patients reported ongoing symptoms 18 months after an ankle sprain,3 and of these 40 % have moderate to severe symptoms. Similarly, 74 % of patients with ankle injury attending a sports clinic reported ongoing symptoms.4 Chronic ankle symptoms of pain, recurrent sprains and subjective feelings of instability persist beyond 3 years after injury.5 Functional ankle instability (FAI) has recently been shown to be associated with a mixture of mechanical instability, self-reported instability and a history of recurrent sprains.6 Identification of intrinsic ankle performance characteristics that can be improved to reduce the risk of first-time ankle injury and subsequent re-injury has clinical value, and the potential to raise sports participation rates, prolong sporting careers and improve quality of life.4
Sensorimotor terminology
The terminology and theory underlying the functional control of the ankle has been summarised elsewhere.2 ,7 Control is provided by an interaction between active restraint from the muscles and passive stability from the non-contractile soft tissues and bony geometry. Active stability of the ankle joint and control of movement is achieved through the interaction of sensory reception, central nervous system interpretation and movement planning, and peripheral motor output.8 This system of sensory and motor (sensorimotor) control is summarised in figure 1.

The sensorimotor process in perceiving activity and producing joint stability.
The quality of sensorimotor control can be measured at each stage of the reception/processing/motor output process or to assess as an entirety (figure 2).9,–,13

Measuring sensorimotor function.
Reviews of intrinsic deficits associated with ankle injury risk
The risk of re-injuring an ankle is greater than the risk of ‘first-time’ injury. When viewed in isolation, the prevention of injury to previously healthy ankles shows lower clinical power14 and cost-effectiveness.15 ,16 However, this preventive value is much greater when it is remembered that every first-time injury prevented is also removing a predisposition to re-injury. In this context, the prevention of first-time injury assumes much greater importance despite its primary benefit being relatively smaller, because the risk of first-time and secondary re-injury is compounded. Hence, in terms of risk:
Risk of future ankle injury=risk of first-time injury×risk of re-injury.
An individual's history of ankle injury is not something which a clinician or a trainer can change. All sports participants, whether previously injured or not, will benefit from the prevention of ankle injuries. It is more useful to determine the functional traits which promote injury risk, to enable training to be directed at improving known deficits, whether in a previously injured or in a never-injured ankle.
Prediction and prevention of ankle injuries interests sports trainers and musculoskeletal health professionals and a number of authors have reviewed the literature in this area of study.15 ,17,–,20 The relationship between previous injury and ongoing injury risk is clear and well proven.21,–,24 However, to date, no meta-analysis has been done to investigate the association between pre-existing deficits in ankle structure and the function and risk of future ankle injury in all ankles, whether previously injured or never injured.
The aim of this paper was to identify studies that have found pre-existing functional and structural deficits associated with an increased risk of injury in previously healthy ankles and to combine their results through meta-analysis. Identification of deficits that can be improved should enable further development of training and treatment interventions to reduce the risk of ankle injury.
Method
Literature search
In order to identify suitable literature, we searched the following databases:
SPORTDiscus (via EBSCO); MEDLINE (via EBSCO); as subscribed by the Australian Institute of Sport, National Sport Information Centre (AIS, NSIC).
CINAHLPlus (via EBSCO); PEDro; ScienceDirect; Cochrane Library; as subscribed by the University of Canberra (UC).
The search term ‘Ankle AND Injury AND Prospective AND (Risk OR Prediction OR Incidence OR Prevention)’ was entered for each database, and the resulting references lists combined. The search was not historically date limited and finished in April 2011.
The sequence for selection of papers suitable for meta-analysis is shown in figure 3.

The search process and papers produced at each stage of the literature search.
Inclusion and exclusion criteria
We selected papers reporting studies that were prospective in design, and investigated ankle injury occurrence in association with measurements of biometric traits and functional abilities of the participants. The studies had to state the method used to define the participants as healthy, prior to baseline measurements. To facilitate data extraction, we selected English-language papers that presented injured and un-injured group scores, SD (or an alternative from which SD can be calculated) and the number of participants in injured/un-injured groups. For categorical variables, the number of participants in each category and outcome had to be available, rather than a single OR or RR.
Papers that did not meet these inclusion criteria were excluded from meta-analysis, but considered in our discussion of the body of research in this area. Papers were also excluded if the study was of a population with medically compromised ankle function or with general mobility.
Quality assessment
To assess the quality of design and reporting of the papers included for meta-analysis, we used the quality index (QI).25 An adapted version of this index26 has been used in a review of studies of ankle sensorimotor deficits in participants with FAI.27 The earlier version was used,26 because our review involved studies that do not need to blind researchers for a prior injury outcome and that only measure prospectively.
The modified QI contains 15 questions. We calculated a percentage score, giving a point for each question that was answered ‘yes’. If the response was ‘unclear’, it was given the same score as a ‘no’ answer, since this implied poor quality of design or reporting. If a question was not relevant to a particular paper, it was excluded from the percentage calculation.
Data analysis
Each paper was searched for raw scores and injury incidences and performed a meta-analysis where two or more papers presented data on the same type of deficit. StatsDirect statistical software (http://www.statsdirect.com StatsDirect Ltd. England. Version 2.7.8, released 15/03/10) random effects model was used28 to construct Forest plots of multiple study outcomes on the same feature of ankle function, to calculate pooled mean effect sizes (d+) of standardised mean differences (SMD) or pooled RR for all group comparisons and the 95% CI.29 If a study provided sufficient information for SMD and RR, it was included in each meta-analysis.
The likelihood that the pooled effect size or RR differed from zero was calculated,30 with a p value of ≤0.0531 using the χ2 test. Effect size thresholds were defined as negligible (<0.2), small (0.2–0.6), moderate (0.6–1.2) and large (>1.2).32
Funnel plots were created when results from four or more studies were pooled, to assess the influence of publication bias in results where the p value was ≤0.05.33
To evaluate the influence of study quality on effect size outcomes, the mean quality score of the papers was calculated for each of the pooled groups and correlated with the pooled effect size produced by each meta-analysis. The difference in the mean QI score between the meta-analyses which produced a p value of ≤ 0.05 and those with a p value > 0.05 was also determined.
Results
Papers
An initial 2397 papers matched the electronic database search parameters. After the systematic review, 13 papers remained and these provided results which were able to be used in the meta-analysis (figure 3). The participant numbers, injury numbers and sports involved are detailed in table 1.
Details of participants and quality ratings of studies suitable for meta-analysis
Features of ankle function
Strength
Five papers presented the results of the tests of ankle strength between injured and un-injured groups.34 ,35 ,43 ,45 ,46 However, Beynnon et al35 reported male and female groups separately, so these were entered separately into the meta-analyses. The methodology of testing was similar in all studies. A pooled effect size was calculated for each strength direction and each agonist–antagonist ratio reported for two or more participant groups.
Some studies also tested their participants at a range of different isokinetic speeds: 30°/s,34 ,35 ,45 ,46 60°/s,43 120°/s45 ,46 and 180°/s.43 It has been suggested that researchers have historically tested the strength at a mixture of speeds, from a belief that slower speeds test muscular strength, while faster speeds test power.30 Based on this theoretical premise, study results were pooled into slow (<110°/s) and fast (≥110°/s) testing30 and then pooled effect sizes for the SMD by movement direction (tables 2 and 3). A negative effect size indicates that the injured group was weaker in that test. In comparing strength ratios, a negative sign indicates that the injured group had a lower ratio than the un-injured, showing a relative weakness in the first direction of the parameter (eversion and dorsiflexion, DF).
Meta-analyses results for strength at slower speeds
Meta-analysis results for strength at faster speeds
Forest plots are shown for the comparisons with a p value ≤0.05 (figures 4 and 5) and a funnel plot for the ‘slow’ eccentric inversion strength meta-analysis that included more than four papers (figure 6).

Eccentric inversion strength (slow).
Concentric plantar flexion strength (fast).

Funnel plot of eccentric inversion papers.
Postural stability
Eleven papers presented results from various tests of balance, in 12 cohorts of participants. Four studies used similar instrumented measures of postural sway (in five cohorts).35 ,39 ,43 ,45 Five gave sufficient information to perform the meta-analysis of RR for their selected categorical designation of poor balance between their cohorts.37 ,38 ,41 ,42 ,44 Three studies used different scoring systems for counting balance errors, allowing some subjectivity on the part of the scorer.36 ,40 ,45 We pooled the SMD and RRs for each paradigm, with the results as shown in table 4 and figures 7–10.

Instrumented postural sway.

Funnel plot of instrumented sway papers.

Postural stability risk ratio.

Funnel plot of postural stability risk ratio.
Meta-analysis results for the measures of postural stability
A positive effect size in error counting or the amount of sway indicates a greater error rate and the range of sway instability in the injured cohorts. The RR is the risk of injury relative to the un-injured control cohort.
Proprioception (JPS)
Our search found three papers that reported measures of joint position sense (JPS) in a prospective study of ankle injury risk,45,–,47 but none using the proprioceptive paradigms of kinaesthesia or force perception.
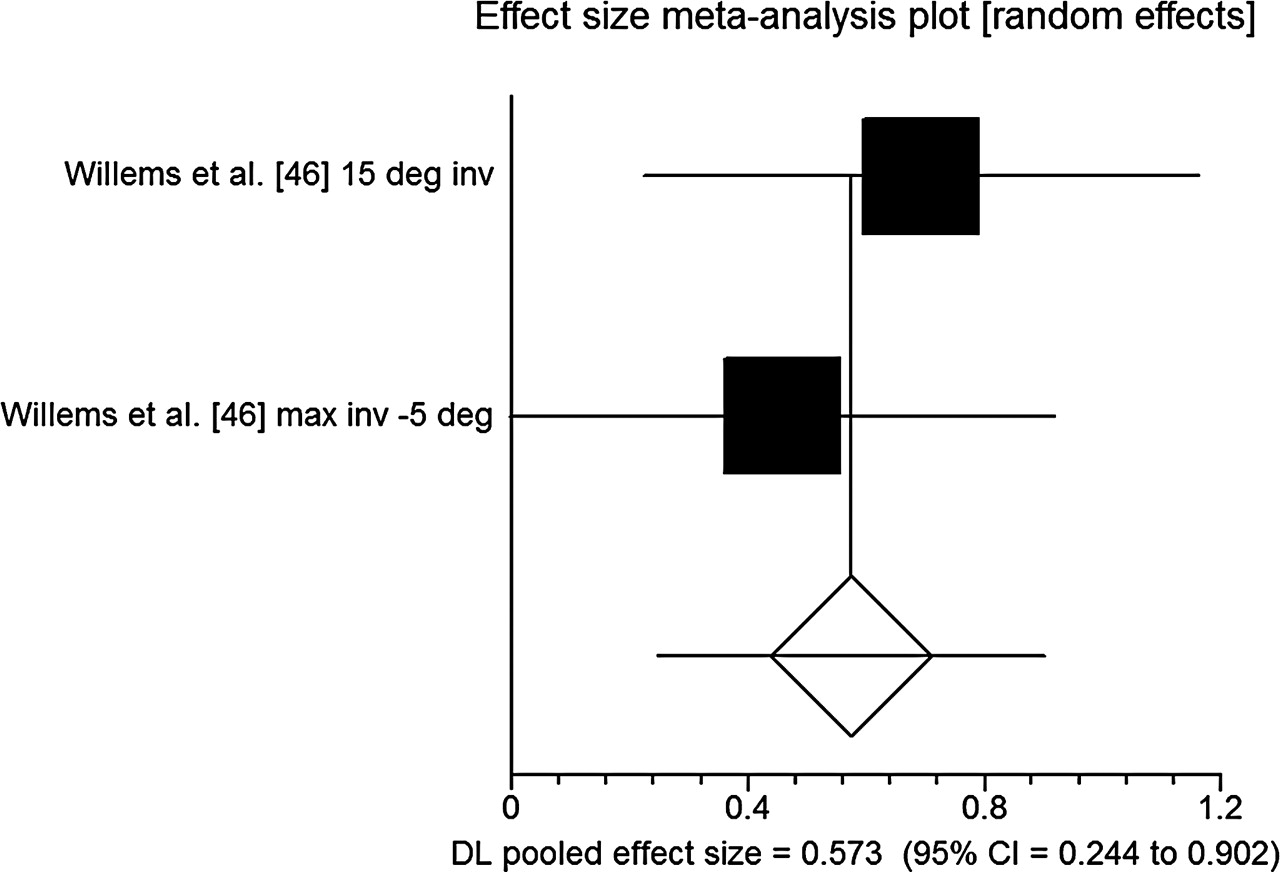
However, only one paper presented full data on the different JPS tests used, including scores with a p value of >0.05.46 This study reported the results of multiple test formats separately: active and passive position replication tests, with two inversion positions and an eversion position for each paradigm. The results of the two passive and the two active inversion JPS tests could be pooled separately, to provide an overall effect size for each testing paradigm. Since the pattern of results was similar for ‘absolute’ and ‘exact’ methods of scoring the same test, we analysed the absolute results.
The passive tests show a statistically significant difference between injured and un-injured groups (figure 11), while the active tests do not reach significance (table 5). A positive effect size indicates that the injured group had a greater mean error in replicating the test angle.

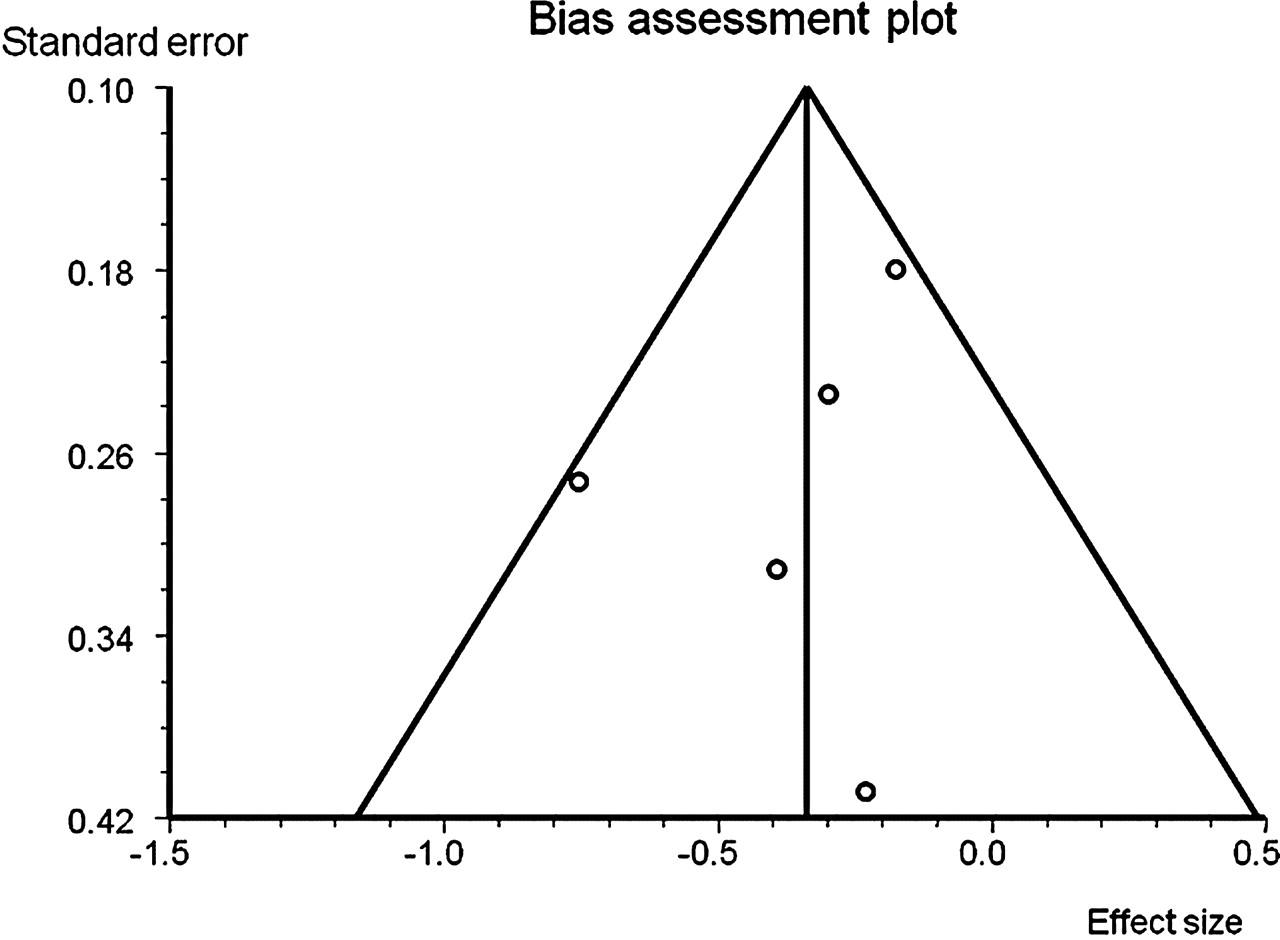
Passive inversion JPS (deg=degrees, max=maximum, inv=inversion).
Inversion JPS at multiple joint angles
Muscle reaction time
Three studies measured muscle reaction times to a perturbation or to a movement and related these to future injury occurrence,35 ,45 ,46 but one paper did not report these results.46 So two papers, providing three cohorts, were entered into a meta-analysis for each of the muscle groups tested. Both papers included an inversion component in their perturbation movement. In table 6, a negative effect size indicates that the injured group had a shorter muscle reaction time.
Meta-analysis results for muscle reaction times
Range of movement
Six studies measured range of movement (ROM) in various planes of movement34,–,36 ,43 ,45 ,46 in seven cohorts, with five testing inversion and eversion ROM,34,–,36 ,45 ,46 a different grouping of five testing DF with two associated knee positions34 ,35 ,43 ,45 ,46 and two studies including plantar flexion (PF).45 ,46
When meta-analysis was first conducted for inversion and eversion ROM, the results of one paper36 were more than two SD outside the effect sizes for the other four studies (five cohorts) included in the meta-analysis, indicating a heterogeneous bias in this study's findings relative to the other four. Subsequently, this paper was excluded, resulting in a reduced pooled effect size for both analyses, but no change in the statistical significance of the outcome (table 7).
Results of meta-analysis of ankle range of movement
Ligament stability
Three studies tested the ligament integrity, giving four cohorts.35,–,37 Two different tests of ligament stability were used: (A) an anterior draw mechanism, intended to stress the anterior talo-fibular ligament (ATFL) and (B) the talar tilt into inversion, believed to stress the calcaneo-fibular ligament and the ATFL. These papers presented results from four cohorts tested by the anterior draw,35,–,37 and two for the talar tilt35 (table 8).
Meta-analysis results for ligament testing
The influence of study quality on effect size of results
The effect sizes of all pooled comparisons shown in tables 2–8 were correlated against the mean QI percentage score for their respective groups, with the scores for ligament testing and RR associated with postural stability excluded. Mean QI score and pooled effect size for each meta-analysis were not significantly correlated (r=0.001, p=0.497 one-tailed, n=31).
An independent-sample's t test on the QI scores between those meta-analyses with p value greater or less than 0.05 (mean QI score 13.987 and 14.08 for p values >0.05 and ≤0.05, respectively) showed these not to be significantly different (p=0.402 one-tailed, n=34).
Discussion
This review has enabled the meta-analysis of the features of ankle function that have been examined in research on the risk of ankle injury.
Strength
Weaker eccentric inversion strength is associated with an increased occurrence of ankle injury at testing speeds slower than 110°/s. The effect size (0.337) is small, suggesting that the injured participants were only slightly weaker than those who remained uninjured. It is important to note that although the effect size was small, it was still able to differentiate between those that subsequently were injured and those that were not.
Although none of the other strength comparisons at slow speeds reached significance, the effect size for the eversion/inversion strength ratio is actually greater than that for the eccentric inversion (0.353), suggesting that the relative weakness of the evertor muscles (peroneii) is also worthy of further study. It might be expected that the evertors, which assist in reducing or controlling inversion movements, would show a deficit in those who injure more readily. This is borne out in meta-analysis of individuals suffering FAI or recurrent sprains postinjury.30 However, the finding here regarding inversion strength is consistent with another meta-analysis of ankle strength in FAI.48 In this type of postinjury dysfunction, the inversion strength was found to be significantly less than in healthy control groups, and as a consistent finding in injury prone participants before injury and postinjury. Although Arnold et al30 found no meaningful difference between fast and slow strength testing speeds in their meta-analysis investigating deficits in FAI, our meta-analyses was prospective in nature and produced different results. At speeds faster than 110°/s, the injured participants were stronger in concentric PF than those who remained un-injured. The effect size (0.372) is again small. However, greater PF strength may not be a direct cause of heightened injury risk; rather greater strength may be associated with other variables which increase the ankle injury risk, for example, higher grade of sports participation or higher intensity of workload during their chosen sport. Studies which evaluate strength in association with other covariants are required to address this question.
Higher PF strength may also alter the DF/PF ratio, which may be more meaningful for injury risk. However, none of the studies found by our search included these ratios at the higher speeds.
Postural stability
Reduced postural control has been shown repeatedly to indicate heightened injury risk in healthy ankles, whether tested by functional-specific tasks,37 single leg balance,41 more complex balance postures45 or postural sway.39 ,42 ,43 One study of balance on demi-pointe in the adolescent dancers revealed a correlation in the first test cohort, which did not then replicate in a second test group of ankles.37
Meta-analysis revealed that participants who subsequently injured their ankle had a larger mean area of sway when tested using an instrumented measurement. They also have a higher risk ratio if they were determined to be in the lower category of postural control when scored by observation or by sway. However, methods that test postural control by scoring the number of errors during a test have not shown this pattern, suggesting that the increased subjectivity of these methods may increase the variability in scores and render them less useful for this particular purpose.
JPS
The two different joint positions used to test inversion JPS produced similar findings.46 These indicate that relatively poor active position-replication JPS performance in inversion is associated with ankle injury risk, in the female population studied. The effect size for these two tests combined is 0.573, with the group which subsequently injured their ankles having a greater error in angle when attempting to replicate the test position.
Eversion JPS was tested at 10°45 ,46 and 20° eversion.47 As only one paper presented the scores in sufficient detail,46 meta-analysis was not possible. Both studies at 10° found no difference between injured/un-injured groups, while at 20° right ankle inversion correlated significantly with right ankle sprain, in women only. Three of four ankle groups tested in this paper (men/women, right/left ankle) did not show a significant difference between injured/un-injured groups. These results generally do not suggest that reduced eversion JPS is associated with increased risk of ankle injury.
Although a number of papers have found that there is evidence of a deficit in joint position sense associated with CAI,19 because of the retrospective nature of this study it is possible that this deficit may not exist prior to injury in healthy ankles.
The method of testing ankle JPS in two of these three studies involved supine lying, with the knee at 90° flexion and the limb non-weight-bearing.45 ,46 The other study used a sitting position with knee-flexion for the test.47 Since these studies were conducted, it has been found that higher percentages of weight-bearing are positively correlated with ankle JPS acuity, and this testing position may have reduced the sensitivity of the test.49 Gross limb positioning also has a significant effect on ankle JPS, giving much greater acuity when the knee is extended, whether in sitting or in standing.50 Further, psychophysical testing requires a large number of trials for each movement direction, as thresholds vary with time and repetition.51 This aspect was missing in the reported studies, with each subject tested only twice45 ,46 or three times47 for each of the joint positions.
An additional factor of the JPS test used in all three studies is that they tested isolated ankle joint mechanisms in relatively mid-range joint positions. The role of joint capsule receptors and their afferent neural pathways has been described as being particularly important in determining the extreme limits of movements.52 This suggests testing for injury risk, using mid-range positioning may exclude some of the receptors which are most active at the time when the joint is at risk—close to the limit of safe joint range.
In assessing functional deficits, ethical considerations (necessarily) restrict putting the participants being placed in positions where damage is imminent. However, it is most likely to be at this range where the necessary sensorimotor skills to stabilise real-life critical loads and positions are demonstrated. Some authors consider mid-range testing incompatible with the functional severity of injuring movements, and with the joint excursion present in healthy sporting activities.9 Studies that move closer to the limits of ankle control may reveal sensorimotor deficits in healthy sportspeople, and reveal a stronger correlation between ankle function and risk of injury.
The lack of studies and the limited publication of detail in results published provide limited information about the utility of JPS in predicting ankle injury. Are current testing methods sufficiently specific and sensitive, and is JPS more significant to injury risk for women as opposed to men? The results from our meta-analysis of two different inversion positions suggest that poor inversion JPS is associated with increased ankle injury risk, and may be useful as part of a preventive screening protocol. Other methods of proprioceptive testing, such as kinaesthesia and force sense, have not been used in the prospective studies of injury prediction. They are also potential avenues for further study in this area.
Muscle reaction time
Meta-analysis did not show any association between muscle reaction times and future injury occurrence. These negative findings are in keeping with the findings relating to individuals with FAI, and suggest that the muscle reaction time following an inversion perturbation is too slow to prevent the movement occurring, and that the protective role of reactive muscle contraction is more a saving response for balance, than to contract to prevent the injuring movement itself.53 ,54 It is probable that, similar to those individuals with FAI, muscle function in preparation for ankle loading may be more important to injury prevention than reactive muscle reaction times.55
ROM
Analysis of ROM for inversion, eversion, PF and dorsiflexion did not show a link to ankle injury risk. This finding differs from an earlier systematic review,18 but the criteria for meta-analysis in this study was also different from those in the previous review.
Ligament stability
While investigations into ligament stability seem promising, with a high RR for talar tilt tests in particular, these values did not reach significance. This is most likely due to the variability of testing and scoring methods applied. Furthermore, it should be noted that these studies did not include the injury history associated with ligament laxity. In all likelihood, individuals with increased ligamentous laxity have a history of injury.
Future studies in this area must use a standardised testing and scoring methodology and include injury history as a covariate.
The influence of study quality on effect size of results
Study quality measures did not show any influence on effect size, with the mean QI score of studies within each meta-analysis not related to the size of the d+ score. Likewise, the meta-analyses whose p value was ≤0.05 did not differ significantly in their mean QI score, from those with a p value above 0.05. The quality of study design and reporting did not influence the outcomes of these meta-analyses.
However, since low-quality studies are to some extent excluded from the meta-analysis by their lack of methodological detail and incomplete data reporting, it is likely that the systematic review process has controlled the standard of quality in the selected papers.
Conclusions
Meta-analyses demonstrate that higher postural sway, being in the lower postural stability group, lower eccentric eversion strength at slower speeds, higher concentric PF strength at faster speeds and lower inversion JPS in women are all associated with the risk of ankle injury. These findings will enable clinicians and sports trainers to measure and train specific deficits in sports people for the prevention of ankle injury.
Since the risk of ankle injury is dependent on multiple variables,56 ,57 a single clinical predictive algorithm58 is unlikely to be established for the risk of ankle injuries. Determination of appropriate threshold scores for high-risk versus low-risk levels for injury in each variable may allow screening to target whichever deficits are present in an individual. It would also be useful to assess the mechanism by which intervention to modify these risks may work, to enable more targeted, efficient and effective intervention to be applied. Further study is also required to further define elements that best predict the risk of ankle injury for specific sports, playing positions and participant subgroups.
Acknowledgments
Jeremy Witchalls was supported by an APA scholarship administered by the University of Canberra and the Australian Institute of Sport during the writing of this review.
References
Footnotes
-
Competing interests None.
-
Provenance and peer review Not commissioned; externally peer reviewed.