Article Text

Abstract
Cardiac channelopathies are potentially lethal inherited arrhythmia syndromes and an important cause of sudden cardiac death (SCD) in young athletes. Other cardiac rhythm and conduction disturbances also may indicate the presence of an underlying cardiac disorder. The 12-lead ECG is utilised as both a screening and a diagnostic tool for detecting conditions associated with SCD. Fundamental to the appropriate evaluation of athletes undergoing ECG is an understanding of the ECG findings that may indicate the presence of a pathological cardiac disease. This article describes ECG findings present in primary electrical diseases afflicting young athletes and outlines appropriate steps for further evaluation of these ECG abnormalities. The ECG findings defined as abnormal in athletes were established by an international consensus panel of experts in sports cardiology and sports medicine.
- Athletics
- Injury Prevention
Statistics from Altmetric.com
Introduction
Inherited primary arrhythmia syndromes are known causes of sudden cardiac death (SCD) in young athletes. Channelopathies represent a heterogeneous group of genetically distinct cardiovascular disorders associated with sudden death and ventricular arrhythmias from disturbed function of the cardiac ion channel.1–3 Ventricular pre-excitation and other disturbances of cardiac conduction also are associated with diseases predisposing to SCD in young athletes.4 Primary electrical disorders may present with disease-related symptoms or be asymptomatic and thus only identified by abnormal testing during preparticipation screening. The 12-lead ECG is commonly abnormal among athletes with pathological cardiac disease, and clinicians responsible for ECG interpretation in athletes must be familiar with key findings associated with conditions at risk for SCD. This paper will review ECG findings associated with primary electrical diseases relevant to the care of the young athlete. Initial testing for further evaluation of abnormal ECG findings is also presented.
Distinguishing normal from abnormal
A challenge in the use of ECG for screening or diagnostic evaluations in athletes is the ability to accurately differentiate findings suggestive of a potentially lethal cardiovascular disorder from benign physiological adaptations occurring as the result of regular, intense training (ie, athlete's heart). Several reports have outlined ECG criteria intended to distinguish normal ECG findings in athletes from ECG abnormalities requiring additional evaluation.5–10
On 13–14 February 2012, an international group of experts in sports cardiology and sports medicine convened in Seattle, Washington, to define contemporary standards for ECG interpretation in athletes. The objective of the meeting was to assist physicians distinguish normal ECG alterations in athletes from abnormal ECG findings that require additional evaluation for conditions that predispose to SCD.11 A review of normal ECG findings in athletes is presented separately.12
In this paper, abnormal ECG findings suggestive of an ion channel or conduction disorder associated with SCD in athletes are presented including congenital long and short QT syndromes (LQTS and SQTS), catecholaminergic polymorphic ventricular tachycardia (CPVT), Brugada syndrome (BrS), ventricular pre-excitation, supraventricular tachycardias (SVT), atrioventricular (AV) blocks and premature ventricular contractions (PVCs). Table 1 summarises a list of abnormal ECG findings unrelated to athletic training that may suggest the presence of a pathological cardiac disorder and should trigger additional evaluation in an athlete.
Abnormal ECG findings suggestive of primary electrical disease
The congenital QT syndromes
Congenital long QT syndrome (LQTS) and short QT syndrome (SQTS) are potentially lethal, genetically mediated ventricular arrhythmia syndromes with the hallmark electrocardiographic feature of either QT prolongation (LQTS) or markedly shortened QT intervals (SQTS) (figures 1⇓–3). Symptoms if present include arrhythmic syncope, seizures or aborted cardiac arrest/sudden death stemming from either torsades de pointes (LQTS) or ventricular fibrillation (SQTS). The pathophysiology of the QT syndromes is understood as either delayed ventricular repolarisation (LQTS) or accelerated ventricular repolarisation (SQTS) originating primarily from loss-of-function (LQTS) or gain-of-function (SQTS) mutations in genes encoding voltage-gated potassium channels (Kv7.1 and Kv11.1) that govern phase 3 repolarisation in the ventricular myocytes. Currently, 13 LQTS-susceptibility genes and 3 SQTS-susceptibility genes have been identified and account for over 75% of LQTS and <20% of SQTS.1

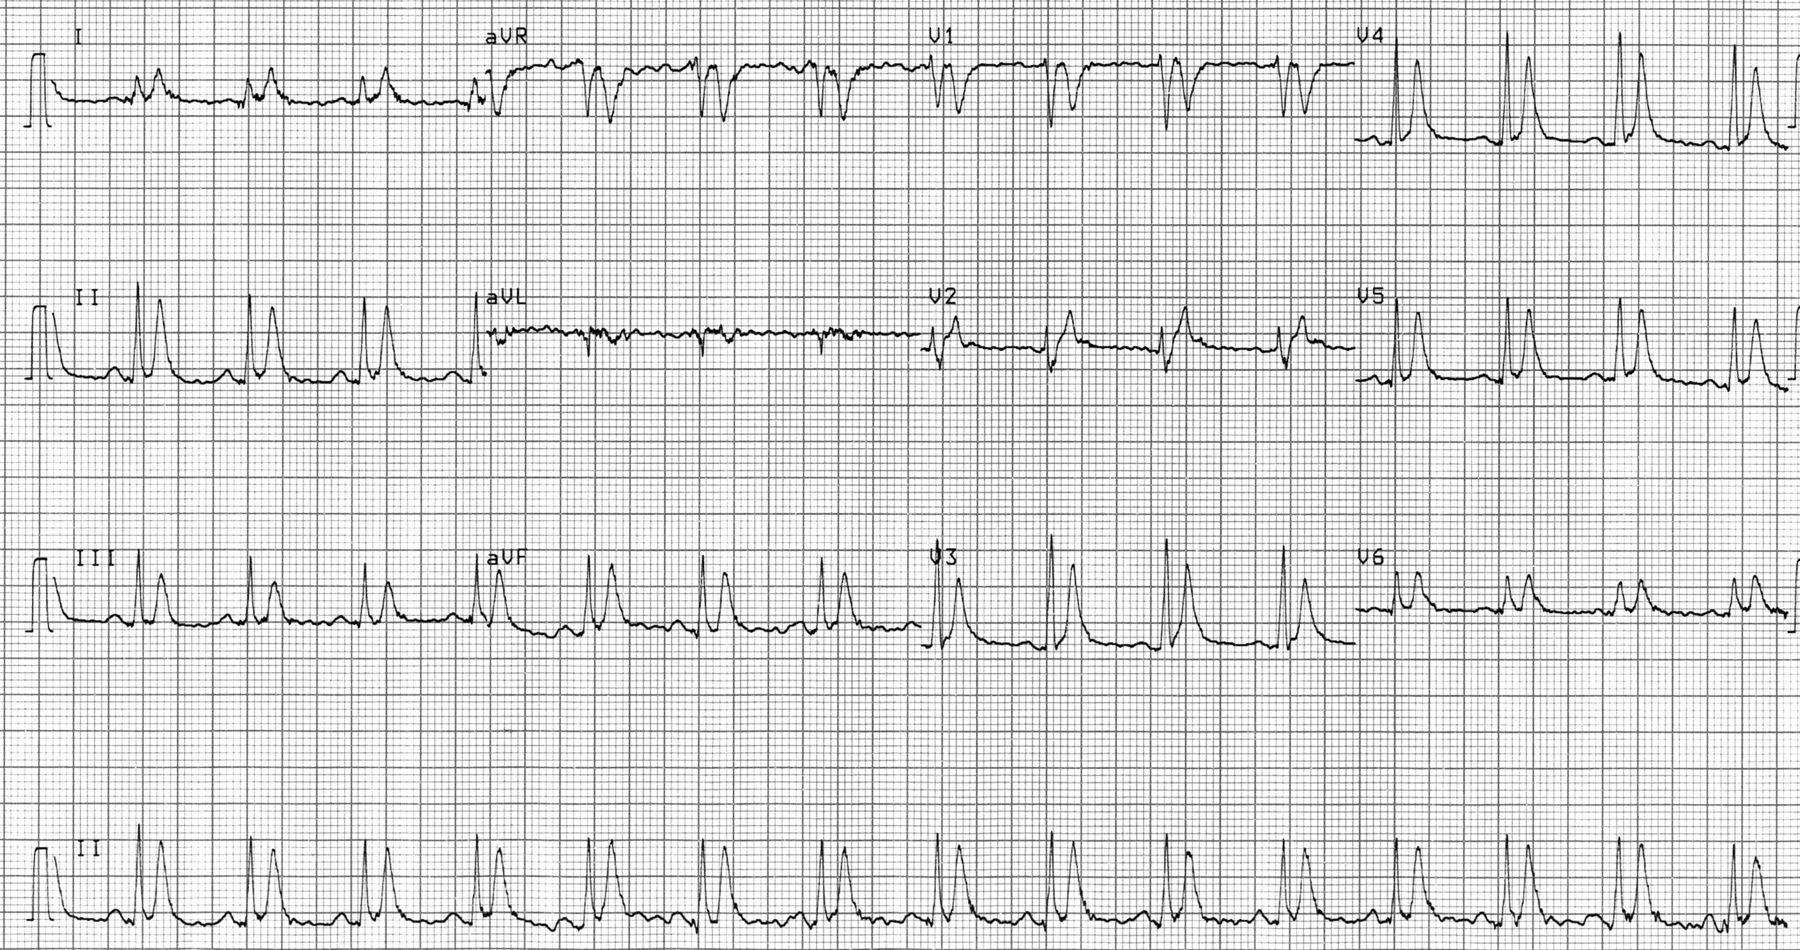
ECG demonstrating a profoundly prolonged QT interval. The computer derived a QTc measurement of 362 ms which was inaccurate. Manual measurement of the QTc was 760 ms.

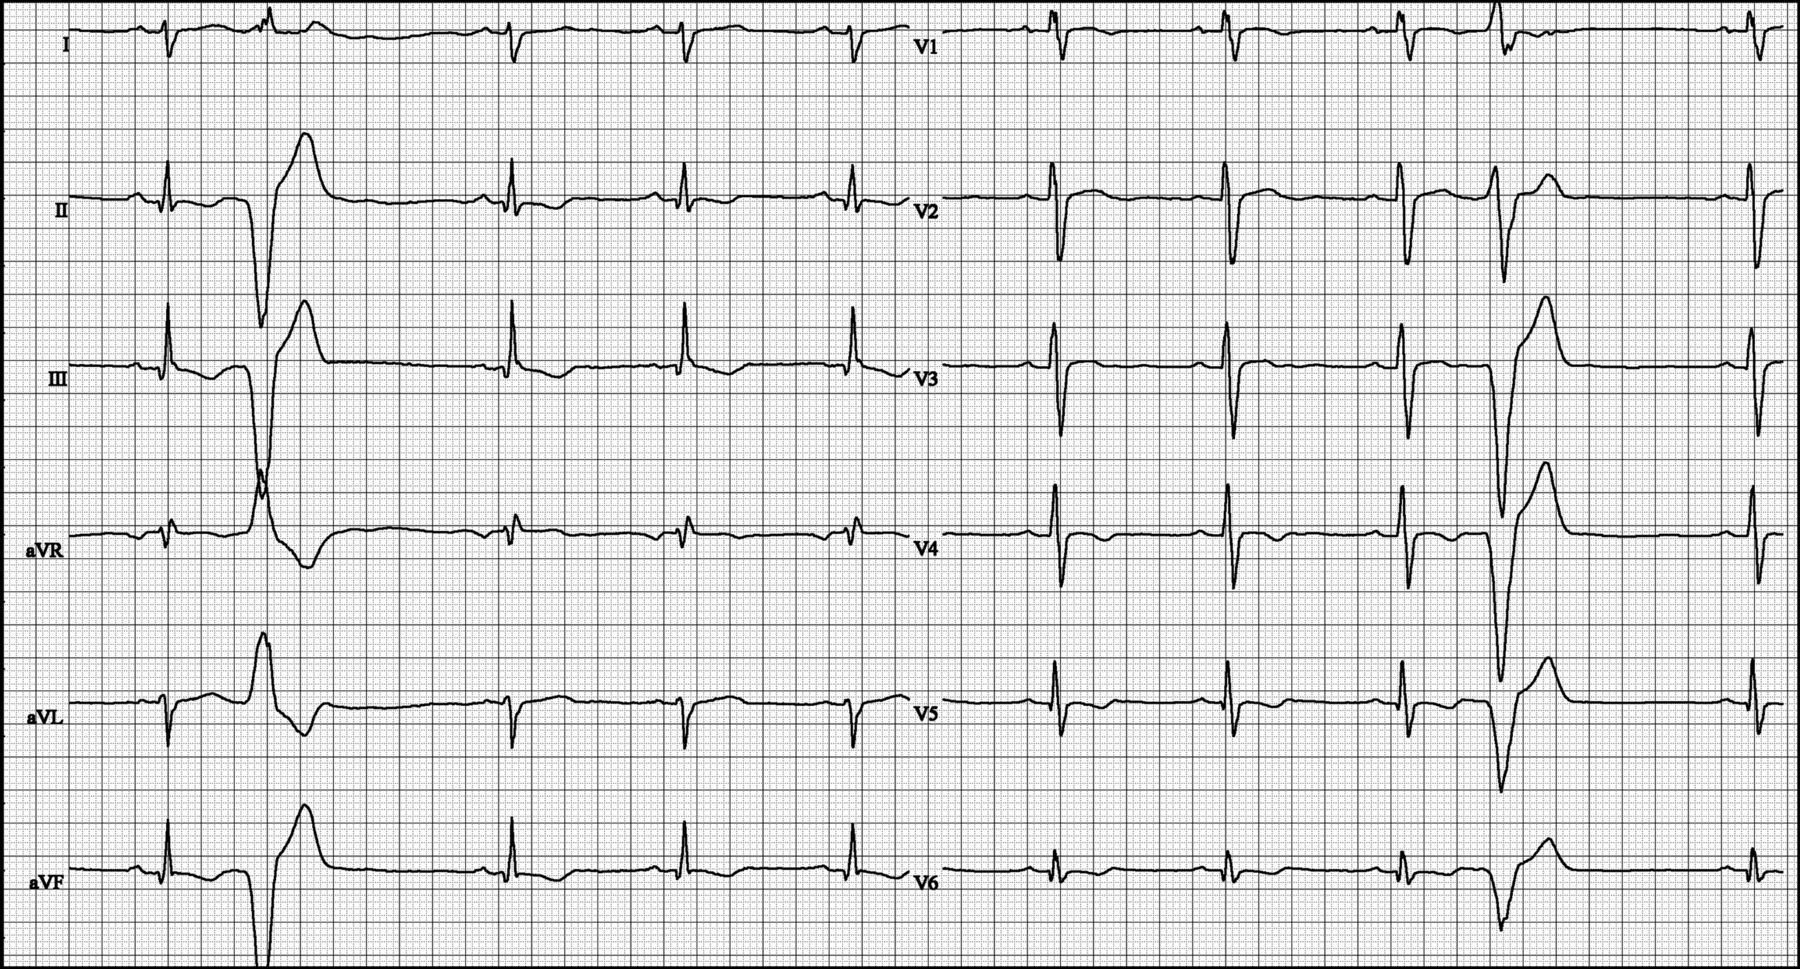
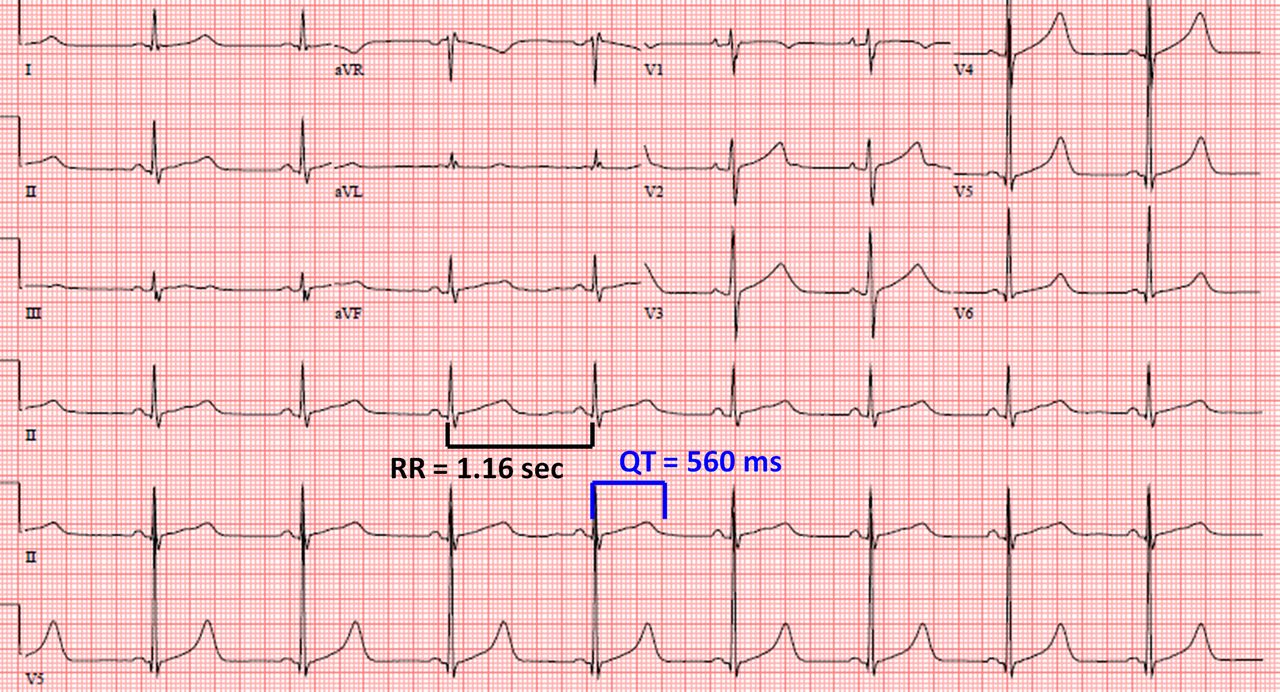
ECG from a 27-year-old man with long QT syndrome (QTc=520 ms). Heart rate is 52 bpm. Bazett's formula: QTc=QT/√RR. Note the RR interval is measured in seconds. This figure is only reproduced in colour in the online version.

ECG from a patient with short QT syndrome. The QT interval is 250 ms and the QTc 270 ms. Note the tall, peaked T waves across the precordial leads characteristic of short QT syndrome. (ECG courtesy of Professor P Mabo).
Prevalence
SQTS is extremely uncommon affecting less than 1:10 000 individuals. Although once considered similarly rare, LQTS is now estimated to affect 1 in 2000 individuals and given the subpopulation of so-called ‘normal QT interval’ or ‘concealed’ LQTS, this may be an underestimate.13
Contribution as a cause of SCD
Among individuals between 1 and 40 years of age, approximately 25–40% of sudden unexpected deaths are classified as autopsy negative sudden unexplained death (SUD) lacking necropsy findings to establish the cause and manner of death.14–16 Here, cardiac channelopathies such as LQTS, SQTS, CPVT and BrS are considered as possible culprits and have been implicated by postmortem genetic testing as the root cause for up to 25–35% of SUD in selected cohorts.17–19 LQTS is the most common channelopathy responsible for about 15–20% of SUD.20 SQTS is a very rare cause of autopsy negative SUD.14
In a series of young athletes with SCD from the USA (n=1049), a precise cause of death was identified in 690 cases.4 LQTS was implicated in less than 4% of cases (23/690) with an identified cause.4 However, this estimate does not include one-third of the total cases in the series (359/1049) with no precise diagnosis but in whom post-mortem genetic testing was not documented. Thus, it is likely ion channelopathies or accessory electrical pathways represent a larger percentage of SCD in young athletes than previously reported.
Diagnostic criteria
Both QT syndromes are diagnosed based on a combination of symptoms, family history, electrocardiographic findings and genetic testing. The Gollob score is used for SQTS while the Schwartz-Moss score is used to invoke low, intermediate and high probability for LQTS.21–23 For LQTS, genetic testing is recommended for: (1) any patient where a cardiologist has an index of suspicion for LQTS (intermediate or high probability score), or (2) an asymptomatic patient with no family history but an incidental ECG finding with a QTc >480 ms prepuberty and >500 ms postpuberty that is confirmed on repeat ECG testing.1 Genetic testing may be considered for individuals with an incidental QTc finding (repeated) of ≥460 ms prepuberty and ≥480 ms postpuberty.1
Calculating the QTc
Whether the ECG was obtained for screening or diagnostic purposes, the heart rate corrected QT interval (QTc) derived by the computer must be confirmed manually because the accuracy of the computer generated QTc is only about 90–95%. Notably, the computer-derived QTc for the ECG in figure 1 was off by about 400 ms as the true QTc was around 760 ms but was read as 360 ms. Although this is an extreme example of an inaccurate computer QTc calculation, studies have also suggested that the ability of cardiologists and even heart rhythm specialists to accurately measure the QTc is suboptimal.24 However, an accurate assessment of the QTc can be taught and achieved by adhering to the following six principles.25
First, most ECG machines utilise the Bazett's heart rate correction formula (QTc=QT/√RR; note the RR interval is measured in seconds).26 Although there are many heart rate correction formulas for the QTc, it is recommended to use Bazett's correction to confirm the computer's QTc as the population-based QTc distributions most frequently used Bazett-derived QTc values.
Second, Bazett's formula loses accuracy at slow heart rates and can underestimate the individual's inherent QTc at heart rates <60 bpm, especially at heart rates <50 bpm. Accordingly, if an athlete has a heart rate <50 bpm, repeat the ECG after some mild aerobic activity to get his/her heart rate into a range (60–90 bpm) where the formula is most accurate.
Third, if there is beat-to-beat variation in heart rate (sinus arrhythmia) which is common among athletes, do not take the maximum QT interval on the ECG and divide it by the square root of the shortest RR interval,27 which will grossly overestimate the QTc. Instead, it is more accurate to derive an average QT interval and average RR interval.
Fourth, to perform a manual confirmation, the critical issue is identifying the end of the T wave since the onset of the QRS is seen easily. The rhythm strip at the bottom of the ECG generally includes leads II, V1 and/or V5, and lead II and V5 usually provide the best delineation of the T wave.
Fifth, it is incorrect to include the commonly seen low-amplitude U wave in the QT calculation. Such U wave inclusion will inflate greatly the QTc. Instead, follow the ‘Teach-the-Tangent’ or ‘Avoid-the-Tail’ method as shown in figure 4.25

This figure illustrates the ‘Teach-the-Tangent’ or ‘Avoid-the-Tail’ method for manual measurement of the QT interval. A straight line is drawn on the downslope of the T wave to the point of intersection with the isoelectric line. The U wave is not included in the measurement. This figure is only reproduced in colour in the online version.
Sixth, the morphology of the T waves, not just the length of the QT interval, can suggest the presence of a QT syndrome.28 As shown in figure 5, a notched T wave in the lateral precordial leads may be a tip off to LQTS even in the absence of overt QT prolongation.
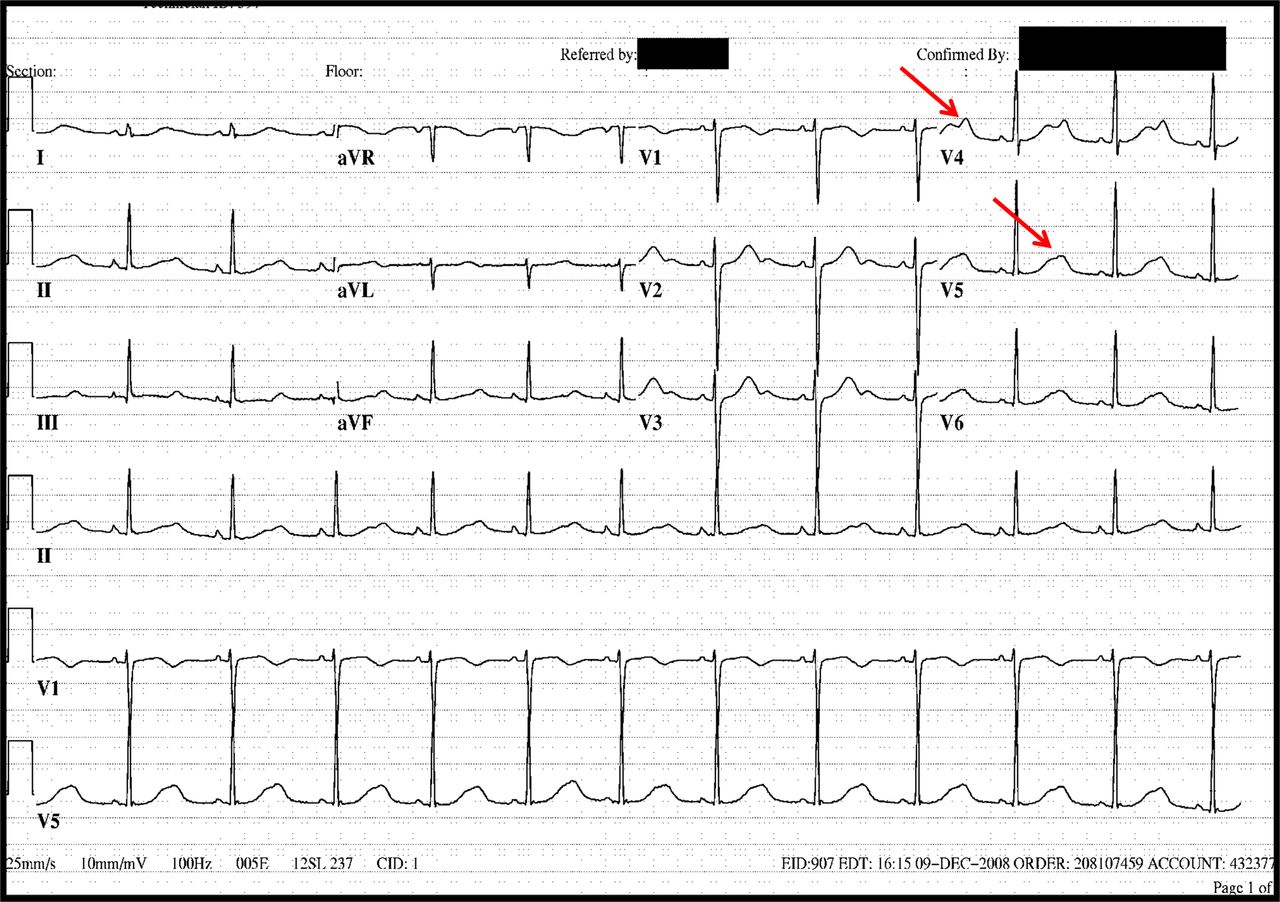
ECG of a patient with long QT syndrome. Note the notched T waves (arrows) in the lateral precordial leads (V4–V5) that are typical of long QT type-2. This figure is only reproduced in colour in the online version.
With this framework, the easiest and most efficient way to confirm the computer-derived QTc is to examine lead II and/or V5 and determine if the manually measured QT interval matches the computer's QT measurement. If there is concordance within about 10 ms of each other, one can trust that the computer can derive accurately an average RR interval and complete Bazett's calculation. As such, the computer generated QTc has been confirmed manually. If, however, the manually measured QT interval is >10 ms different than the computer's QT measurement, calculate an average RR interval and recalculate the QTc using Bazett's formula.
QTc cut-offs: how long is too long? How short is too short?
Figure 6 shows the overlap between the distribution of QTc values in population-derived cohorts of healthy individuals compared to patients with genetically confirmed LQTS.29–31 Considering that 25–40% of genotype positive individuals (mostly relatives of the index cases/probands) have normal QT interval/concealed LQTS, it must be acknowledged that no screening programme will identify all persons with either LQTS or SQTS.32 Instead, the QTc cut-off values, where the QTc measurement requires further evaluation, must be chosen carefully to balance the frequency of abnormal results and the positive predictive value that an SQTS or LQTS host has been identified.

Distribution and overlap of QTc values for healthy individuals compared to patients with genetically confirmed LQTS.
Published definitions of a ‘prolonged QTc’ requiring further evaluation have varied. Guidelines from the European Society of Cardiology for ECG interpretation in athletes define a QTc value of >440 ms in men and >460 ms in women (but <500 ms) as a ‘grey zone’ requiring further evaluation, and a QTc ≥500 ms, otherwise unexplained and regardless of family history and symptoms, as indicative of unequivocal LQTS.6 In the USA, the AHA/ACC/HRS guideline has dropped the term ‘borderline’ QT prolongation and instead now annotates a QTc ≥450 ms in men and ≥460 ms in women as ‘prolonged QTc’.33 Concern has been raised that these QTc cut-offs will produce a high number of false-positive test results if followed in a screening population of athletes.29 However, one study of 2000 elite athletes age 14–35 in the UK found that only 0.4% of athletes had a QTc >460 ms, and another study detailing ECG findings in 32 561 young adults from the USA undergoing screening reported only 0.3% had a QTc >460 ms.10 ,34 Nonetheless, these QTc thresholds (440–460 ms) represent the approximate 90–95th percentile values for QTc distribution in the general population, and utilisation of these QTc cut-offs in a screening programme of athletes will have a <1% positive predictive value for LQTS in the absence of any personal or family history to indicate disease.29 ,31 In 2011, an international statement on ECG interpretation in athletes recommended that all athletes with a QTc >470 ms in men and >480 ms in women undergo further evaluation for LQTS to better balance false-positive and false-negative findings.7
Accordingly, it seems prudent to shift the QTc cut-off values that should trigger further evaluation in asymptomatic athletes with no concerning family history. This consensus group recommends cut-off values around the 1st percentile (QTc ≤320 ms) for a short QTc and around the 99th percentile (≥470 ms in men and ≥480 ms in postpubertal women) to indicate a prolonged QTc. These cut-offs will improve the positive predictive value if ECG is used for athlete screening while still identifying the most overt QT abnormalities and those individuals most like to experience QTc-related adverse events. These cut-offs are also consistent with thresholds defined by the 36th Bethesda Conference.35
However, it is critical that an athlete should not be obligated to a diagnosis of either SQTS or LQTS for falling below or above these QTc cut-off values, but rather these cut-off values should trigger the need for further evaluation. In other words, a prolonged QTc measurement on a single ECG does not equal LQTS. Further evaluation as outlined below and the use of scoring systems that account for personal symptoms, family history, as well as electrocardiographic features are helpful in clarifying the diagnosis.
QTc cut-offs: relative versus absolute risk of a QT syndrome
By definition, the 99th percentile cut-off for genetically confirmed LQTS assumes 1% of those with a value outside of this QTc threshold (≥470 ms in men, ≥480 ms in women) have a false-positive result. If one assumes that the prevalence of LQTS is 1 : 2000 individuals, and approximately half of these individuals will have a QTc above and half below these QTc thresholds (1 : 4000), then the positive predictive value of detecting true disease for a QTc outside the cut-off value is about 2.5%.29 ,30 However, once a prolonged QTc is identified, that individual has a 1 in 40 (rather than 1 : 2000) chance of having true disease. In other words, with no additional corroborative evidence, a single prolonged QTc value above the defined cut-off would suggest a 50-fold increase in relative risk for LQTS but only a 2.5% absolute risk. However, in an athlete with a QTc ≥500 ms, the predictive value now favours the presence of not only LQTS but possibly higher risk LQTS.34 ,36
Evaluation of a possible long or short QT syndrome
An athlete identified as crossing the aforementioned QTc thresholds (≥470 ms men, ≥480 ms women) should have their personal history (exercise/emotion/auditory-triggered syncope or seizures) and family history (exertional syncope, exercise/auditory-triggered ‘epilepsy’, postpartum-timed syncope/seizure, unexplained motor vehicle accidents, unexplained drowning, and premature, unexplained sudden death <50 years of age) reviewed. If their personal/family history is positive, then the athlete should be referred to a heart rhythm specialist for further evaluation. If the personal/family history is negative, then a repeat ECG should be obtained. If the follow-up ECG is within the QTc cut-off values, then no additional evaluation is needed and the athlete should be reassured and may continue sports participation.
On the other hand, if the repeat ECG still exceeds the QTc cut-off values, then a screening ECG of the athlete's first-degree relatives (parents and siblings) should be considered and the athlete should be referred to a heart rhythm specialist or cardiologist as the possibility for newly discovered LQTS or SQTS has increased. Reversible, extrinsic factors, such as electrolyte abnormalities (hypokalaemia) or the presence of QT prolonging medications, must also be evaluated. If an athlete's ECG shows a QTc ≥500 ms and no reversible causes are identified, then the athlete should be referred immediately to a heart rhythm specialist or cardiologist as the probability of LQTS and future adverse events has increased.36 Further testing including provocative treadmill stress and/or epinephrine QT stress testing along with genetic testing need to be considered carefully and should be performed and interpreted by a cardiologist familiar to the disease.
Catecholaminergic polymorphic ventricular tachycardia
CPVT is an inherited arrhythmogenic disorder characterised by ventricular ectopy induced by exercise or emotional stress. CPVT is a primary electrical disease involving cardiac channels, particularly the RYR2-encoded cardiac ryanodine receptor/calcium release channel, and typically occurs in patients with structurally normal hearts. Exercise or acute emotion can lead to progressive ventricular ectopy eventually causing a fast ventricular tachycardia. This tachycardia may lead to syncope and in some cases ventricular fibrillation and sudden death. The average age of presentation of CPVT is between 7 and 9 years old, but onset as late as the fourth decade of life has been reported.37 If untreated, approximately 30% of individuals experience cardiac arrest and up to 80% have at least one episode of syncope.38
Prevalence and contribution as a cause of SCD
The prevalence of CPVT is estimated to be around 1 in 10 000 people, although the true prevalence of this condition is not known.39 The incidence of SCD in athletes from CPVT is also not known. However, one study showed a prevalence of 9.4% in adults with sudden unexplained death and a pooled analysis found 4–10% of autopsy negative SCD could be attributed to CPVT.20 ,40 ,41
Diagnostic criteria and ECG findings in CPVT
CPVT should be considered in any person who experiences syncope during exercise or extreme emotion, particularly in those who experience syncope during maximal exertion or have repeated episodes of syncope with exercise. CPVT cannot be diagnosed on the basis of a resting ECG, as the resting ECG is normal. An echocardiogram is also typically normal. As ventricular ectopy occurs only in the face of increased emotion or exercise, exercise stress testing is the key test in the evaluation CPVT. As exercise workload increases, there is typically an increase in the amount of ventricular ectopy which ultimately may result in polymorphic ventricular tachycardia42 (figure 7). This graded, exercise-induced ventricular ectopy differentiates CPVT from benign PVCs which typically suppress with exercise.

15-year-old boy undergoing exercise stress test for evaluation of CPVT. Polymorphic ventricular ectopy is evident late in stage 3 of the exercise stress test. Heart rate 148 bpm. This figure is only reproduced in colour in the online version.
The ventricular tachycardia in CPVT can be bidirectional with a 180° rotation of the QRS complex alternating from beat to beat. However, exercise-induced bidirectional ventricular tachycardia is uncommonly seen in patients with genetically proven CPVT. Instead, as heart rate increases during exercise there will be increasing ventricular ectopy initially with isolated PVC's, then ventricular bigeminy, progressing to ventricular couplets and ventricular tachycardia if exercise persists.43
Evaluation of possible CPVT
Evaluation of possible CPVT should be referred to a cardiologist. An exercise stress ECG such as an exercise treadmill test may be diagnostic in CPVT. Infusion of intravenous catecholamines (isoproterenol) during ECG monitoring or CPVT genetic testing may confirm the diagnosis in questionable cases.1 ,44
Brugada syndrome
BrS is a primary electrical disease which is characterised by the distinctive ECG pattern of ‘high take-off“ ST segment elevation in the right precordial leads and predisposes to ventricular fibrillation and sudden death in the absence of clinically demonstrable structural heart disease.45 Loss-of-function defects in the SCN5A gene, which encodes for the α-subunit of the sodium channel, accounts for approximately 20–25% of BrS and approximately 40% of BrS accompanied by prolonged PR intervals.1 ,45–47
Prevalence and contribution as a cause of SCD
The syndrome is estimated to account for up to 4% of all sudden deaths in the general population and 5–20% of sudden deaths victims with a structurally normal heart at autopsy.20 ,45 Ventricular fibrillation and sudden death in patients with BrS occurs more commonly during rest and sleep and is unrelated to exercise.
Diagnostic criteria
In 2002, a consensus conference endorsed by the Heart Rhythm Society and the European Heart Rhythm Association proposed ECG criteria for the diagnosis of BrS.48 Three types of Brugada ECG (Br-ECG) patterns were defined: the ‘diagnostic’ (type 1) which is characterised by a ‘coved-type’ ST segment elevation in the right precordial leads, and the ‘non-diagnostic’ (types 2 and 3) which show a ‘saddle-back’ configuration. (figure 8) The type 1 Br-ECG may be unmasked or worsened by sodium channel blockers such as ajmaline, flecainide and procainamide.49 Higher placement of the V1 and V2 electrodes in the second intercostal space (rather than the fourth intercostal space) also can precipitate a type 1 Brugada ECG pattern. Conversion of type 2 and 3 Br-ECG to type 1 by sodium channel blocker administration is considered diagnostic for a positive Brugada ECG pattern and is used in clinical practice for diagnosis and management of BrS according to current guidelines.49

Brugada pattern ECGs. Type 1 Brugada pattern ECG is defined as a high-take off and downsloping ST segment elevation ≥2 mm followed by a negative T-wave in at least two contiguous leads (V1–V3). Type 2 and 3 Brugada pattern ECGs have a ‘saddleback’ appearance with J-point elevation ≥2 mm, ST segment elevation >1 mm in type 2 and ≤1 mm in type 3, and either a positive or biphasic T-wave.
ECG findings in Brugada syndrome
Type 1 Brugada pattern ECG is defined as a high-take off and downsloping ST segment elevation ≥2 mm followed by a negative T-wave in at least two contiguous leads (V1–V3) (figure 8). Type 2 and 3 Brugada pattern ECGs have a ‘saddleback’ appearance with J-point elevation ≥2 mm, ST segment elevation >1 mm in type 2 and ≤1 mm in type 3, and either a positive or biphasic T-wave (figure 8).
The downsloping ST elevation in Brugada type-1 ECG should be distinguished from the ‘convex’ ST segment elevation characteristic of early repolarisation in a trained athlete (figure 9). Measuring the ST elevation at the start of the ST segment/J-point (STJ) and 80 ms after the start of the ST segment (ST80) can help differentiate the slope of the ST segment. In Brugada type-1 pattern the downsloping ST segment will have a STJ/ST80 ratio >1. In early repolarisation patterns in an athlete the initial upsloping of the ST segment will produce a STJ/ST80 ratio <1 (figure 9).

Brugada type-1 ECG (left) should be distinguished from early repolarisation with ‘convex’ ST-segment elevation in a trained athlete (right). Vertical lines mark the J-point (STJ) and the point 80 ms after the J-point (ST80), where the amplitudes of the ST segment elevation are calculated. The ‘downsloping’ ST segment elevation in Brugada pattern is characterised by a STJ/ST80 ratio >1. Early repolarisation patterns in an athlete show an initial ‘upsloping’ ST segment elevation with STJ/ST80 ratio <1.
Evaluation of possible brugada syndrome
Patients with a type 1 Brugada pattern ECG should be referred to a cardiac electrophysiologist for further evaluation and management.
Ventricular pre-excitation
The PR interval is the time required for the electrical impulse to travel from the sinus node through the AV node to the Purkinje fibres, and it is measured from the beginning of the P wave to the beginning of the QRS. Ventricular pre-excitation occurs when an accessory pathway of electrical activation bypasses the AV node. As a result, there is abnormal conduction to the ventricle (pre-excitation) with shortening of the PR interval and widening of the QRS. This is evident on the ECG as the Wolf–Parkinson–White (WPW) pattern.
Prevalence and contribution as a cause of SCD
WPW pattern occurs in approximately 1 : 1000 athletes.50 The presence of an accessory pathway can predispose an athlete to sudden death if the athlete also goes into atrial fibrillation. Rapid conduction of atrial fibrillation across the accessory pathway can result in ventricular fibrillation. The risk of sudden death associated with asymptomatic WPW pattern in most population-based studies is 0.1% per year in adults.51 There is evidence to suggest a higher risk of sudden death in asymptomatic children and younger adults with WPW pattern.52–54 Overall, WPW accounted for 1% of cardiovascular deaths in a long-term registry of sudden death in athletes.4
Diagnostic criteria and ECG findings in ventricular pre-excitation
WPW pattern is defined as a short PR interval (<120 ms), the presence of a delta wave (slurring of the initial QRS) and a wide QRS (>120 ms).55 (figure 10)

ECG demonstrating the classic findings of Wolff–Parkinson–White with a short PR interval (<120 ms), delta wave (slurred QRS upstroke) and prolonged QRS (>120 ms). This figure is only reproduced in colour in the online version.
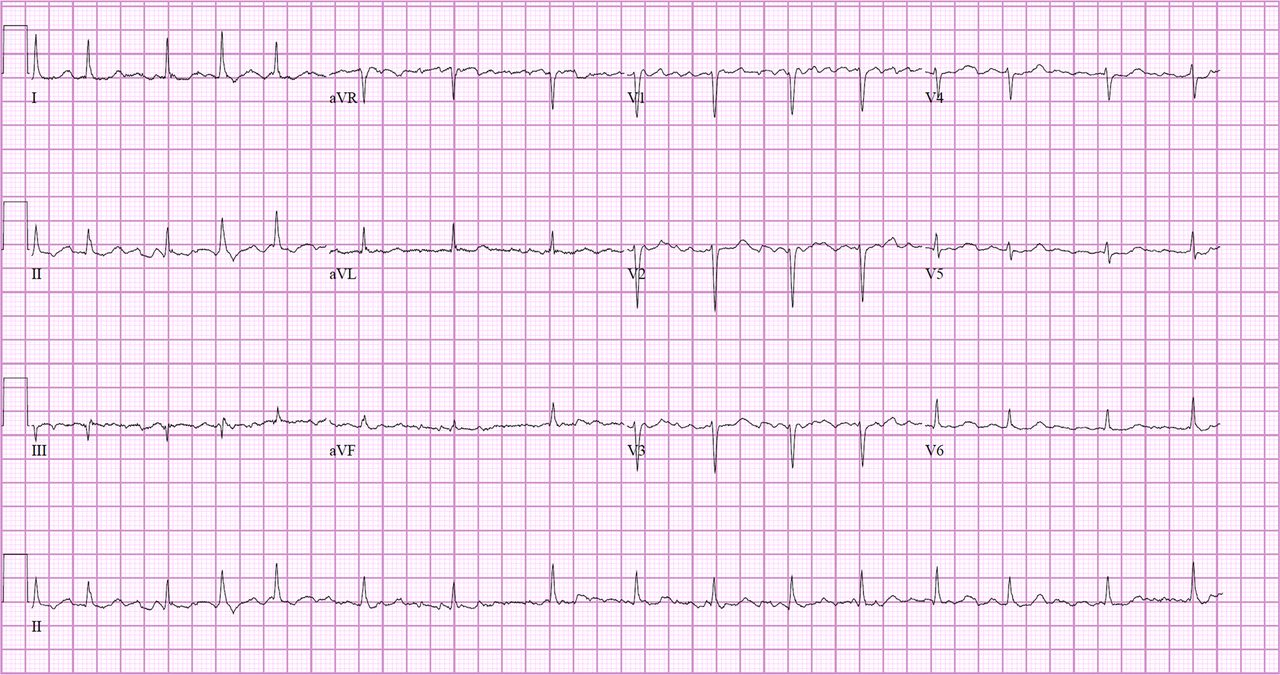
WPW pattern should be differentiated from a low atrial rhythm with a short PR interval that is a common finding in athletes (figure 11). The short PR is a result of the impulse being generated by an atrial focus outside the sinus node and closer to the AV node. Due to the proximity to the AV node, atrial conduction time is reduced and the PR interval is shortened. Findings that can help differentiate this from pre-excitation include an atypical P wave axis (negative P wave in the inferior leads) suggesting the atrium is activated from bottom to top rather than top to bottom as in sinus rhythm (figure 11). No further evaluation is recommended for asymptomatic athletes with only a short PR interval and no other ECG abnormality.

ECG demonstrating a low atrial rhythm with short PR interval. Since the impulse is initiated adjacent to the AV node the atrial conduction time is decreased and the PR interval shortened. The P wave is also negative in the inferior leads (II, III, aVF) which confirms this as a low atrial rhythm and differentiates it from Wolf–Parkinson–White. This figure is only reproduced in colour in the online version.
Evaluation of WPW
The diagnostic evaluation of asymptomatic athletes with WPW pattern remains controversial and is conducted usually by an electrophysiologist. Stratification methods for the risk of sudden death include invasive and non-invasive tests. Non-invasive measures of a low-risk accessory pathway include intermittent pre-excitation during sinus rhythm and abrupt, complete loss of pre-excitation during an exercise stress test.56 ,57
If non-invasive testing is inconclusive, electrophysiology testing should be considered. Characteristics of a high-risk pathway are generally determined during an electrophysiology study by the shortest pre-excited RR interval during induced atrial fibrillation. If the shortest pre-excited RR interval is measured as ≤250 ms [240 beats/min (bpm)] then the pathway is deemed high risk.52 Young athletes with a shortest pre-excited RR interval ≤250 ms should proceed with transcatheter ablation.58 An echocardiogram should also be considered due to the association of WPW with Ebstein's anomaly and cardiomyopathy.
Supraventricular tachycardias
SVT are heart rhythms >100 bpm, originating from the sinus node, atrial tissue or involving the AV node. The most common SVT is sinus tachycardia, seen during exercise, anxiety, fever, infection, dehydration, hyperthyroidism, anaemia, pulmonary disease, heart failure, stimulant use and other causes.
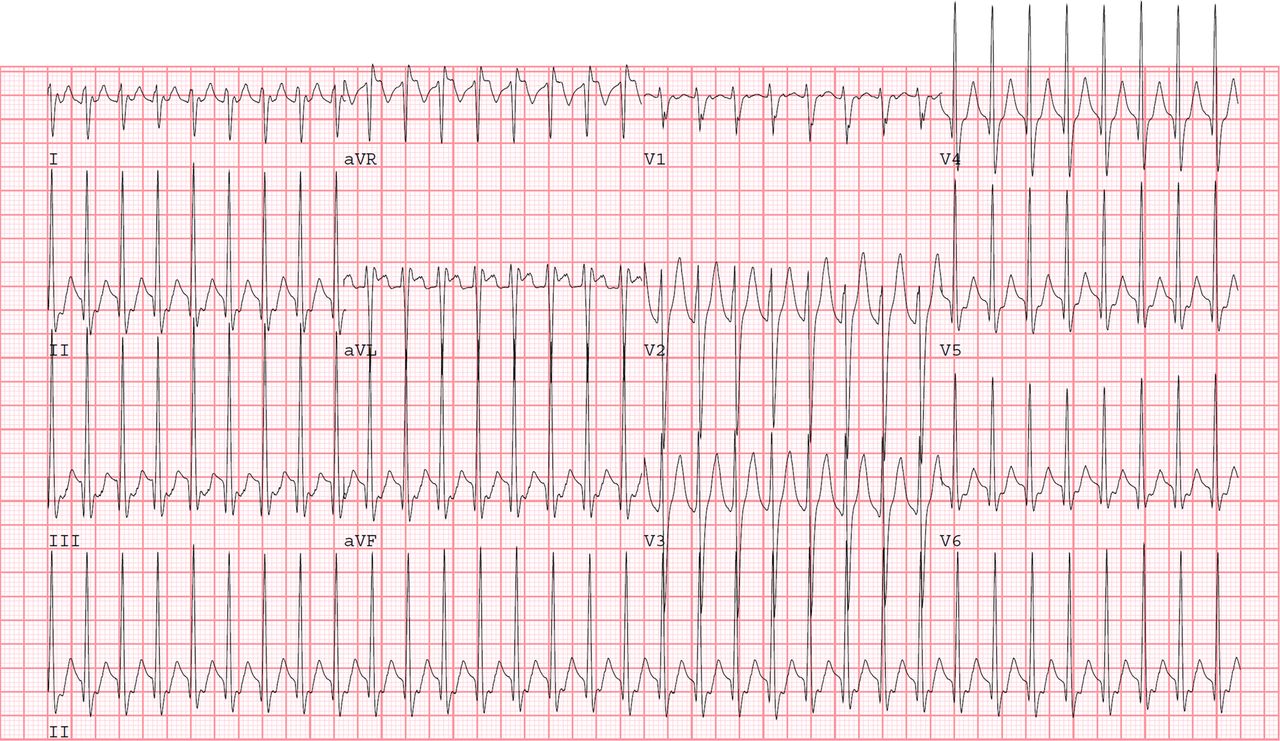
Paroxysmal SVT includes AV nodal re-entrant tachycardia (AVNRT), AV reciprocating tachycardia (AVRT), atrial tachycardia and other rare tachycardias (figure 12). AVNRT is a circuit involving a slow and fast pathway entering and exiting the AV node. The electrical circuit usually travels down the slow pathway and up the fast pathway, but can be reversed or even involve multiple slow pathways. AVRT involves an accessory AV bypass pathway where the circuit typically conducts down the AV node and up the bypass pathway, producing a narrow complex tachycardia. In WPW pattern, the circuit also may conduct down the bypass pathway and up the AV node. Since the ventricular myocardium is activated by the bypass tract and not the His-Purkinje system, there is a resultant wide complex tachycardia. More commonly in AVRT there is a concealed bypass pathway that only conducts retrograde and, therefore, is not seen on ECG. Lastly, atrial tachycardia occurs from an abnormal focus within the atrium that activates faster than the sinus node.

Paroxysmal supraventricular tachycardia (SVT) refers to narrow complex tachycardias including atrioventricular nodal re-entrant tachycardia (AVNRT), atrioventricular reciprocating tachycardia (AVRT), atrial tachycardia and other rare tachycardias. Atrial fibrillation and flutter are types of SVT but do not fall into the paroxysmal classification. Here, there is a narrow complex tachycardia at 240 bpm, which was later found to be AVRT. This figure is only reproduced in colour in the online version.
Atrial fibrillation and flutter are other types of SVT. Atrial fibrillation is the most common abnormal SVT and is defined by the rapid and irregular atrial electrical activation with the resultant dysfunctional atrial mechanical activation. Atrial flutter is characterised by a macro-reentrant circuit within the atrium and is more organised than atrial fibrillation.
Prevalence of SVT
The incidence of SVT is difficult to determine because of the various study populations and ascertainment methods. Many studies have included elderly patients, with coronary disease or heart failure, which are not relevant to a younger athletic population. SVT is rarely found on a screening ECG, as most young athletes are symptomatic with SVT. In a study of 32 652 Italian subjects, 29 (0.09%) had SVT and 5 (0.02%) had atrial fibrillation or flutter.50 Uncontrolled supraventricular arrhythmias led to disqualification in 73 of 42 386 subjects in the Veneto region of Italy from 1982 to 2004.59 In 32 561 screening ECGs, an ectopic atrial tachycardia was found in only 4 (0.01%) and atrial fibrillation in 2 (<0.01%).10 These studies suggest the presence of SVT to be quite rare on a screening ECG.
Contribution as a cause of SCD
SVT, atrial fibrillation and atrial flutter very rarely lead to SCD, but are more likely to lead to symptoms (ie, palpitations) that prevent intense physical activity due to uncontrolled ventricular rates or lack of adequate AV mechanical synchronisation. Another concern is whether SVT or atrial fibrillation/flutter is reflective of an underlying cardiomyopathy or channelopathy that would place the athlete at risk for SCD. These may include hypertrophic or other cardiomyopathies, BrS, myocarditis, short QT syndrome or WPW.60
ECG findings in SVT
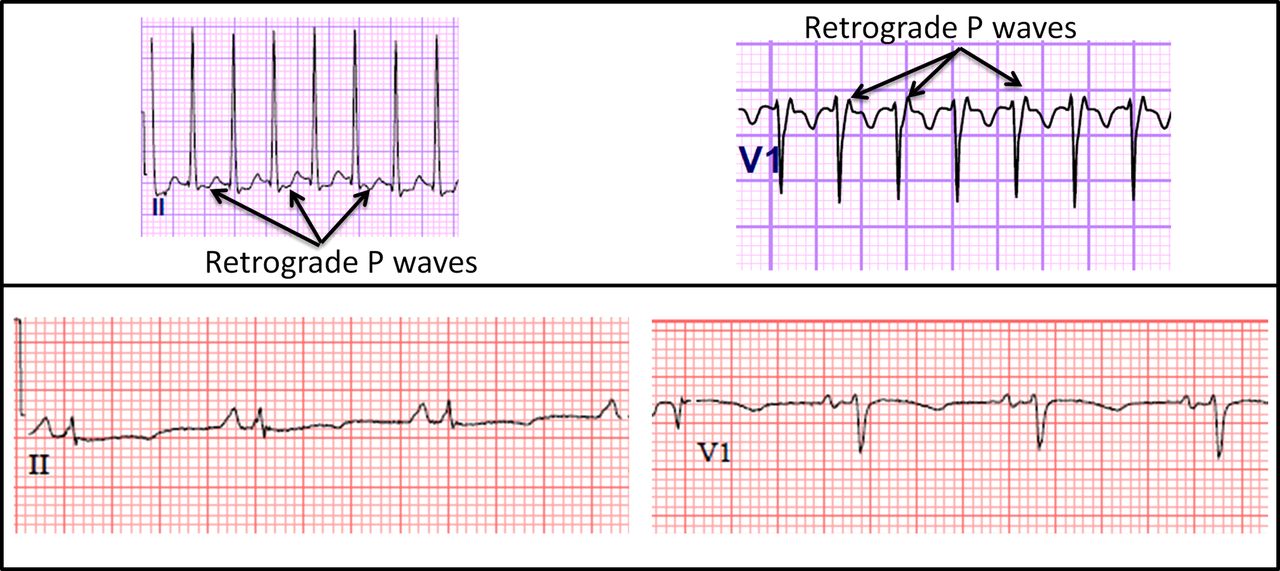
SVT is usually narrow complex, but in the presence of a bundle branch block can be wide complex. It is often difficult to see P waves in AVNRT, since the atrium and ventricles activate near simultaneously, but it is sometimes possible to see inverted P waves in the inferior leads and a pseudo R′ in V1 suggesting right bundle branch block, which are not present when in sinus rhythm (figure 13). AVRT will also usually show retrograde P waves, but they do not necessarily have to be inverted in the inferior leads. Some patients with AVRT will have a WPW pattern on their baseline ECG. Atrial tachycardia demonstrates a regular atrial rhythm which is faster than 100 bpm with P waves all of the same morphology.

The top row demonstrates atrioventricular nodal re-entrant tachycardia (AVNRT) and the bottom row is in normal sinus rhythm in the same patient. In lead II, retrograde P waves are present at the end of the QRS complex. In lead V1, a pseudo-R′ with right bundle branch block pattern is present due to the retrograde P waves. These deflections are not seen on the ECG when in sinus rhythm. This figure is only reproduced in colour in the online version.
The ECG in atrial fibrillation shows fibrillation waves instead of P waves (figure 14). These vary in size, morphology and frequency, but are usually low amplitude with changing shape and rate. The ventricular response to atrial fibrillation is irregular with varying QRS intervals. Atrial flutter, however, has regular atrial activity characterised by flutter waves. Counterclockwise typical atrial flutter, the most common type, shows negative, sawtooth flutter waves in leads II, III and aVF and a positive deflection in lead V1 (figure 15). The atrial activity in atrial flutter is almost always continuous with no isoelectric segment.

ECG demonstrating atrial fibrillation with no clear P waves and an ‘irregularly’ irregular QRS response. Fibrillatory activity is best seen in V1, as the fibrillation waves are irregular and of changing morphology. This figure is only reproduced in colour in the online version.

ECG demonstrating atrial flutter, as evidenced by regular, sawtooth flutter waves in the inferior leads and a positive deflection in V1. No isoelectric segment is present between the flutter waves. The QRS response is regular, in this case a 4 : 1 pattern. This figure is only reproduced in colour in the online version.
Evaluation of SVT
If paroxysmal SVT is seen, carotid sinus massage, Valsalva manoeuver or facial dunking in an ice bath should be completed while recording the ECG to determine if the rhythm terminates (suggestive of AVNRT or AVRT) or ventricular rate slows to reveal hidden P waves (suggestive of an atrial tachycardia or atrial flutter). Once the patient is no longer in SVT, a baseline ECG should be completed to assess for WPW, and if seen, an electrophysiologist should be consulted to discuss electrophysiology study and possible ablation. If the baseline ECG is normal, it is reasonable to obtain an echocardiogram to look for structural heart disease and consider an electrophysiology consultation to discuss possible ablation.
If the rhythm is atrial fibrillation or atrial flutter, an echocardiogram and 24 h Holter monitor should be completed to look for structural heart disease and assess the heart rate throughout the day, including with exercise. If a Holter cannot be performed during exercise, treadmill testing should be completed to assess maximum heart rate while in atrial fibrillation/flutter. Thyroid, liver and renal laboratory testing also should be completed.
Other abnormal ECG findings
Profound sinus bradycardia
Diagnostic criteria
Sinus bradycardia is one of the hallmark features of a well-conditioned athlete's heart. It is the result of increased vagal tone and possible structural atrial remodelling.61 The sinus rate only rarely falls below 30 bpm or shows pauses of ≥3 s during an ECG recording at rest.
Evaluation
Profound sinus bradycardia (<30 bpm) at rest in an athlete should be evaluated further but is not necessarily pathological (figure 16). If asymptomatic and the sinus rate quickly accelerates with an increase in sympathetic tone (ie, small exercise load), then additional testing is not usually necessary. The presence of symptoms, such as decreased exercise capacity or a predisposition for vasovagal syncope, may prompt additional testing to exclude primary sinus node disease. One might also consider temporary cessation of sports activity to evaluate reversibility, although even adaptive athlete's heart sinus bradycardia may not be fully reversible.62 ,63

ECG in an asymptomatic long-distance runner showing profound sinus bradycardia (30 bpm) compatible with high vagal tone. The athlete showed a normal chronotropic response during exercise testing.
Profound first-degree AV block
Diagnostic criteria
The high vagal tone in athletes also leads to a slowing of AV nodal conduction, and hence a lengthening of the PR interval. It is not uncommon to see PR intervals longer than 200 ms in athletes at rest. Even significant PR prolongation ≥300 ms may occur, although this by itself is not necessarily pathological and is usually asymptomatic.
Evaluation
In asymptomatic athletes with a profound first-degree AV block (≥300 ms), the athlete should undergo a minimal exercise load (ie, like climbing a flight of stairs) to increase sympathetic tone. If this results in shortening and normalisation of the PR interval, the PR prolongation is due to functional (vagal) mechanisms and hence benign. If the PR interval does not normalise to ≤200 ms with exercise, a structural cause of AV conduction disturbance (such as Lyme disease or sarcoidosis) should be investigated. Athletes with a profound first-degree AV block (≥300 ms) who have symptoms (ie, syncope, palpitations) or a positive family history of cardiac disease or sudden death require additional evaluation to rule out pathological causes of heart block.
Mobitz type II second-degree AV block
Diagnostic criteria
An abrupt loss of P wave conduction (P wave with no ensuing QRS complex), without prior PR prolongation, represents Mobitz type II second-degree AV block (figure 17). If Mobitz type II or more advanced types of AV block including 2:1 or 3:1 occur during sinus rhythm, it may be indicative of underlying structural heart disease.

ECG showing Mobitz type II second-degree AV block. Note the presence of P waves with loss of conduction and no QRS complex (arrows) and without PR prolongation in the beats prior, nor PR shortening in the beats after (which would suggest Mobitz type I). Mobitz type II second-degree AV block in an athlete is not due to increased vagal tone and should prompt evaluation for underlying conduction disease. This figure is only reproduced in colour in the online version.
Evaluation
Suspected Mobitz type II second-degree AV block or other more advanced types of AV block (2:1 or 3:1 block) should first be differentiated from Wenckebach (Mobitz type I) second-degree AV block. Wenckebach (Mobitz type I) block is present when there is PR prolongation before a blocked P wave and a shorter PR in the first conducted beat after the block. Mobitz type I second-degree AV block is usually a functional block from increased vagal tone and does not constitute pathology in an athlete. Further diagnostic evaluation can be done with an ECG after minor exercise, as a slight increase in sympathetic tone will resolve the conduction disturbance in physiological cases. A Holter monitor (or other form of long-term ECG recording) also can assist in clarifying the type of AV block. Mobitz type II or higher degree (2:1 or 3:1) AV block requires further evaluation for underlying pathological cardiac disease.
Third-degree AV block/complete heart block
Diagnostic criteria
Complete heart block is not an expression of athlete's heart and should be considered an abnormal finding requiring additional evaluation.
Evaluation
With true third-degree AV block, there are more P waves than QRS complexes and the ventricular rhythm is perfectly regular due to an undisturbed junctional or ventricular pacemaker (figure 18). Complete heart block can easily be confused with AV dissociation without block—a situation where the junctional pacemaker is faster than the sinus node, leading to more QRS complexes than P waves. Intermittent ventricular capture by sinus P waves (resulting in an irregular ventricular response) excludes complete AV block. AV dissociation without block is the expression of autonomic mismatch between AV and sinus nodal modulation, but is not pathological. Like all other functional disturbances, a small exercise load with repeat ECG recording will show resolution of the ECG findings in AV dissociation. Complete heart block requires further evaluation for underlying cardiac disease.

ECG showing third-degree (complete) AV block and a junctional escape rhythm. With third-degree AV block, there are more P waves than QRS complexes and the ventricular rhythm is perfectly regular due to an undisturbed junctional pacemaker. Complete heart block is not an expression of athlete's heart and requires additional evaluation. This figure is only reproduced in colour in the online version.
≥2 premature ventricular contractions
Diagnostic criteria
When two PVCs are recorded on a baseline (10 s) ECG, the likelihood is very high that the athlete has >2000 PVCs per 24 h. In athletes with >2000 PVCs per 24 h, underlying structural heart disease which may predispose to more life-threatening ventricular arrhythmias was found in 30% of cases, compared to only 3% of athletes with 100–2000 PVCs, and 0% of athletes with <100 PVCs on a 24 h Holter.64 Over half of the athletes with >2000 PVCs also had bursts of non-sustained ventricular tachycardia. Therefore, a structural cardiac abnormality should be ruled out in athletes with >2000 PVCs per 24 h.64
Evaluation
Documentation of ≥2 PVCs on baseline ECG should prompt more extensive evaluation to exclude underlying cardiac disease (figure 19). However, excluding pathology may be difficult and the extent of the evaluation is controversial. At a minimum, a 24 Holter monitor, echocardiogram and exercise stress test should be done. If the Holter and echocardiogram are normal and the PVCs suppress with exercise, some experts recommend no further evaluation for an asymptomatic athlete. However, in cases with >2000 PVCs per 24 h or episodes of non-sustained ventricular tachycardia, and depending on the level of clinical concern, morphology of the PVCs and type of sport, additional evaluation may also include cardiac MRI and more extensive electrophysiological (EP) evaluation with signal averaged ECG, long-term ECG recording, invasive EP study and/or cardiac biopsy.65 ,66 Therefore, many such cases require referral to a heart rhythm specialist.
ECG of a 35-year-old cyclist shows two premature ventricular contractions which should trigger further evaluation for underlying structural heart disease and/or more complex arrhythmias. This asymptomatic athlete had inducible ventricular tachycardia during EP study, and later received appropriate shocks from an implanted ICD.
Considerations in high-level endurance athletes with PVCs
In high-level adult endurance athletes (such as cyclists, triathlon athletes, marathon runners and rowers), concern has been raised about right ventricular changes that may resemble familial arrhythmogenic right ventricular cardiomyopathy (ARVC), but in the absence of demonstrable desmosomal mutations or a familial history.66 ,67 There is evolving evidence that persistent high volume and pressure load on the right ventricle from such long-term endurance exercise may result in ‘exercise-induced’ ARVC in such athletes.68 Its prognosis is not benign and may result in major ventricular arrhythmias or sudden death, although many athletes with exercise-induced ARVC initially present with minor arrhythmias or symptoms. PVCs originating from the right ventricle typically show a left bundle branch block (LBBB) pattern with a predominantly negative QRS complex in V1. Therefore, in high-level adult endurance athletes, it may be reasonable to consider a single PVC, especially with LBBB morphology and superior axis, sufficient to warrant further investigation similar to that discussed above.
Conclusions
The ECG plays an important role in the cardiovascular assessment of athletes given its capacity to detect inherited primary arrhythmia syndromes and other diseases of disturbed cardiac conduction. As outlined in this paper, there is a concise list of ECG findings that are associated with the presence of a primary cardiac channelopathy or other disorder predisposing to ventricular arrhythmias. Clinicians charged with the cardiovascular care of athletes should be familiar with abnormal ECG findings indicative of primary electrical disease. During preparticipation screening that includes the use of ECG, asymptomatic athletes with any of these abnormal findings should undergo additional testing. Athletes presenting with symptoms (ie, palpitations, exercise, or emotion related syncope or seizure-like activity) should undergo prompt evaluation including an ECG. The evaluation of an athlete with abnormal ECG findings is conducted ideally in consultation with a cardiovascular specialist familiar with primary electrical diseases and with experience caring for athletes.
Additional Resources
For a free online training module on ECG interpretation in athletes, please visit: http://learning.bmj.com/ECGathlete. For the November 2012 BJSM supplement on ‘Advances in Sports Cardiology', please visit: http://bjsm.bmj.com/content/46/Suppl_1.toc.
References
Footnotes
Competing interests None.
Provenance and peer review Commissioned; internally peer reviewed.
▸ References to this paper are available online at http://bjsm.bmjgroup.com