Article Text

Abstract
Objectives: To provide normative data on maximum oxygen uptake (V˙o2max) and physical activity in children 6–7 years of age and analyse the association between these variables.
Methods: V˙o2max was measured in 366 boys (mean (SD) 6.8 (0.4) years of age) and 332 girls (6.7 (0.4) years of age) from preschool classes in two suburban communities in Copenhagen, during a progressive treadmill exercise. Habitual physical activity was measured with accelerometers.
Results: Boys had higher V˙o2max both in absolute values (1.19 (0.18) v 1.06 (0.16) litres/min (+11%), p<0.001) and relative to body weight (48.5 (6.0) v 44.8 (5.6) ml/kg/min (+8%); p<0.001) than girls. The difference in V˙o2max between boys and girls decreased to +2% when expressed relative to lean body mass (LBM). Absolute V˙o2max was related to LBM, body mass, and stature (all p<0.001). Boys were more physically active than girls (mean counts +9.4%, p<0.001), and even when boys and girls with the same V˙o2max were compared, boys were more active. The difference in physical activity between the sexes was higher when sustained activity of higher intensity was compared.
Conclusions: V˙o2max is higher in boys than girls (+11%), even when related to body mass (+8%) and LBM (+2%). Most of the difference in V˙o2max relative to body mass was explained by the larger percentage body fat in girls. When boys and girls with the same V˙o2max were compared, boys engaged in more minutes of exercise of at least moderate intensity.
- BMI, body mass index
- CVD, cardiovascular disease
- LBM, lean body mass
- PA, physical activity
- SFS, sum of four skinfolds
- V˙o2max, maximum oxygen uptake
- accelerometer
- aerobic fitness
- anthropometry
- maximal testing
- treadmill
Statistics from Altmetric.com
- BMI, body mass index
- CVD, cardiovascular disease
- LBM, lean body mass
- PA, physical activity
- SFS, sum of four skinfolds
- V˙o2max, maximum oxygen uptake
The fitness level in children in the western world has declined, but few data are available.1 Even though children do not suffer from lifestyle diseases, it is recommended that they stay physically active and fit, because a high physical activity (PA) level may prevent future illness.2 A high level of physical fitness has been associated with a decreased risk of cardiovascular disease (CVD) in the adult population.3 Even in children, risk factors for CVD have been identified,4 and physical fitness also seems to have an effect on the level of risk factors in children.5 Even though children do not suffer from CVD, it is recommended that children are physically active and fit, as this may help to prevent the disease in the future. Therefore it is important to assess physical fitness at an early age. Maximum oxygen uptake (V˙o2max) is probably the best index of physical fitness and has been studied intensively in adults.6 However, measurements of V˙o2max in 6–7 year old children are sparse, and representative data do not exist.6,7,8,9,10,11 Even in older children and adolescents, very few population based studies exist.10,12,13 The reasons for this include difficulties in testing young children. Ethical considerations, safety factors, and equipment made for adults render testing with young children more challenging. Another health related measure of children is their level of PA, as PA has a positive effect on metabolism.14 Most studies have assessed PA by self report, but accelerometers provide a robust measure of habitual PA.15 No population study has analysed the association between V˙o2max and PA assessed by accelerometry.
V˙o2max is consistently higher in boys than in girls even before puberty.16 This has been attributed to a different body composition and a larger stroke volume of the heart in boys. However, even though boys have been shown to be more active than girls, the difference is too small to explain the difference in V˙o2max.8,17,18
The aim of this study was to provide population data on V˙o2max and PA measured using accelerometry in 6–7 year old children from Copenhagen, and also explore potential sex differences and analyse the association between PA and V˙o2max. We hypothesised that boys have higher V˙o2max than girls, and that this difference may be the result of differences in their levels of fat and PA.
METHODS
Children from 46 preschool classes (6–7 years of age) in 18 schools in two suburban communities in the Copenhagen area were invited to participate in the Copenhagen school child intervention study. In 2000 the community of Ballerup (10 schools, 27 classes) increased the number of PE lessons from two to four a week for the first three years of school. The community of Taarnby (eight schools, 19 classes) was chosen as a control as it resembles Ballerup in sociodemographics. A total of 706 children (69% of those eligible) volunteered for the study, and written informed consent was obtained from the parents/guardians. Of these 706 children, 415 from Ballerup and 291 from Taarnby participated. The ethics committee of Copenhagen county approved the study. The tests were performed from December 2001 until May 2002 at the 18 different schools involved. The exercise test was performed using permanently installed equipment in a camper trailer. All other physiological tests were performed in a gym or a classroom. All tests were performed before noon (0800–1200).
PA was generally measured one week after the other tests. At schools with more than 50 participating pupils, two weeks of PA measurements were necessary. The 31% not participating were analysed about one year later. The first systematic medical examination of children in Denmark takes place one and a half years after they start school, so we were unable to gather data from non-participants in their first year. There were no significant differences between groups with respect to age, height, weight, and body mass index (BMI) for either sex. The analysis included 612 participants and 277 non-participants.
Height was measured by a Harpenden stadiometer to the nearest 1 mm. Body weight was measured to the nearest 0.1 kg using a SECA electronic scale. Bicipital, tricipital, subscapular, and suprailiac skinfolds were measured with a Harpenden skinfold caliper according to criteria presented by De Lorenzo et al.19 The dominant side of the body was determined by asking the child to take a pen and write his/her name. The data shown in this study represent the mean of three measurements taken on the non-dominant side of the body. The sum of four skinfolds (SFS) was used as an indicator of body fatness. Fat mass, fat percentage, and lean body mass (LBM) were derived as:
Fat mass (kg) = 0.38 × body weight + (0.30 × triceps) + (0.87 × G) − 9.42
where for boys G = 1 and for girls G = 2.20
Habitual PA was measured by the MTI 7164 activity monitor (Manufactory Technology Inc, Fort Walton Beach, Florida, USA). The monitor has been validated in several studies and has shown both high mechanical reproducibility15 and good validity with respect to free living conditions in children.21 The monitor samples acceleration at 10 Hz and integrates counts over a time period (epoch) defined by the user. In children, PA is characterised by short bursts of activity. Therefore we chose an epoch of 10 seconds. The choice of epoch limited the registration to three full days and 19 hours. To allow familiarisation, the children had the MTI monitor put on one day before recording. It was secured directly to the skin at the lower back using an elastic belt. The children were instructed to wear the monitor continuously except during water based activity or when sleeping. To distinguish true zeros that arise as a result of below threshold activity from zeros recorded when the MTI monitor was not worn, the data were cleaned as follows: all MTI files were screened for sustained periods of zero activity. Periods of 10 minutes or more with zero counts were interpreted as “MTI not worn” and removed from the file. In spite of instructions, some children slept with the monitor on and therefore had activity recorded even late at night. Therefore we chose to control for nocturnal activity (2230 to 0600). Given these criteria, the data were included if the child had accumulated more than eight hours of activity a day for at least three days. In the end, 466 children had four valid days and 96 children had three valid days, of whom 82 had two week days and one weekend day and 14 had one week day and two weekend days. Fifty eight children had less than three valid days. A mean count was calculated for each child. Furthermore, the number of minutes in periods longer than five or 10 minutes of sustained activity above 2000 counts/min, which is about three METS, was calculated.
Measurement of V˙o2max
V˙o2 was determined with an AMIS 2001 Cardiopulmonary Function Test System (Innovision, DK 5260 Odense, Denmark). This system has been validated against the Douglas bag system.22 We used a Hans Rudolph mouth piece with a volume of 15 ml especially designed for children. Heart rate was measured continuously every fifth second (Polar Sport Tester, Kempele, Finland).
We conducted a pilot study to establish a protocol that enabled most of the children to reach exhaustion. We chose a continuous walking and running protocol on a treadmill. The velocity on the treadmill was initially set to 4 km/h without inclination and kept there for the first three minutes to allow familiarisation. At three minutes, the velocity was increased to 8 km/h, and at five minutes the inclination was raised to 3%. At seven, nine, and 11 minutes, the inclination was increased to 6%, 9%, and 11% respectively. If the child could endure more, the velocity was increased to 9 km/h after 13 minutes and then 10 km/h at 15 minutes. No child completed the last work load.
The children were instructed to run until exhaustion. One subjective and three objective criteria were used to determine if the test was maximal. Every child had to meet the subjective criterion and at least one of the three objective criteria. Criteria were chosen according to Rowland’s recommendations.23 The physiological criteria were: heart rate >200 beats/min; respiratory exchange ratio ⩾0.99; a defined plateau of V˙o2 (an increase less than 2.1 ml/kg/min). Subjective criteria were signs of intense effort such as unsteady running pattern, sweating, facial flushing, and clear unwillingness to continue running in spite of repeated strong verbal encouragement.
Twenty 6–7 year old children outside the sample were invited to do a test-retest on the peak V˙o2 test. Written informed consent was obtained from the parents/guardians. The children were retested either five or seven days after the first test. Four children did not meet the criteria on one or both occasions, and their results were not used in the later analysis, leaving 16 children with two valid tests. A Bland-Altman plot showed no systematic difference between the first and second test, suggesting no learning effect from the first to the second test. The plot also showed that the size of the difference was not dependent on the absolute level of V˙o2max. The typical error of measurement on the difference between V˙o2max between tests was 0.02 litre/kg.
Statistical analysis
The data were stored and analysed using SPSS 11.5.0. Data that were not normally distributed were log transformed, and the mean of transformed values was back transformed to obtain the geometric mean as suggested by Altman.24 V˙o2max relative to body mass was split into deciles by sex to compare differences over the whole distribution, and V˙o2max (ml/kg/min) was calculated for each of the deciles. For a comparison of differences between sexes, we adjusted for body size by two methods of allometric scaling. Data from this study were used to find the scaling factors. In the analyses, the scaling exponent b was identified in the allometric equation Y = a1+ a2Xb, where Y is the physiological variable (V˙o2max) and X is the anthropometric scaling variable (weight or LBM). To obtain b, both the Y and X were log transformed, and least squares regression identified the b in the equation ln(Y) = ln(a2) + bln(X).
Differences between sexes were tested using Student’s t test. The relation between V˙o2max and PA was assessed by linear regression. A significance level of p<0.05 was chosen.
RESULTS
Table 1 shows the total number of boys and girls that entered the study, the number of valid tests, the number of children that stopped before exhaustion, the number of children not fulfilling the criteria, and children who refused to do the treadmill test. A valid V˙o2max measurement was not assessed in 114 children, because 37 failed to comply with the approval criteria and 57 did not want to wear the V˙o2 equipment or did not wear the equipment satisfactorily. Ten children were unwilling to perform the test, and 10 children were absent on all the test days. The final number of accepted tests was 592. Analysis of children with non-valid tests was performed for each sex separately. Time to exhaustion, heart rate, and V˙o2max were lower for the 20 boys and 17 girls that did not meet the criteria (p<0.001). The girls that did not comply with the criteria were 2.6 cm shorter than girls who did comply (p<0.05). Twenty eight boys and 29 girls had a recorded time to exhaustion, but had no valid V˙o2 measurements. The girls without a valid V˙o2 recording ran 42 seconds less (p<0.05) than girls with a valid test. Differences between all other age, anthropometric, and V˙o2 test data were non-significant. Only data for the 592 children with a valid test were included in the following analysis. Of the 592 children that met the subjective criteria, 210 met the levelling off criterion (35%), 283 (47%) met the pulse criterion, and 507 (86%) met the respiratory exchange ratio criterion.
Age, height, body weight, and maximal exercise data for groups with different test status for the maximal exercise test
Table 2 shows descriptive data for age, anthropometry, and PA. Except for BMI, differences were found between boys and girls for all variables. The girls had larger SFS (15%, p<0.001) and fat percentage (23%, p<0.001). The boys were older (2%, p<0.001), heavier (3%, p<0.05), taller (1%, p<0.001), had a greater LBM (8%, p<0.001), a higher level of PA (mean counts/min 8%, p<0.001), and more minutes in periods of five or 10 minutes of sustained activity at a level of 2000 counts/min or greater (60% and 103% respectively, p<0.001). It should be noted that all boys had five minute periods of sustained activity, whereas three girls did not have any. Further, 38 boys and 83 girls did not have any 10 minute periods of sustained activity.
Anthropometric and physical activity data in 6–7 year old children by sex
The absolute differences in the treadmill data between boys and girls were moderate (table 3). The girls had higher maximum heart rate (2%, p<0.001) and respiratory exchange ratio (5%, p<0.001), and the boys had higher absolute V˙o2max (11%, p<0.001), V˙o2max relative to body mass (8%, p<0.001), and V˙o2max relative to LBM (2%, p<0.05). V˙o2max remained different (9%, p<0.001) after allometric scaling using (body mass)0.712 as scaling, but did not differ when LBM1.105 was used as the scaling factor.
Maximal exercise data on 6–7 year old children by sex
Deciles in V˙o2max (ml/kg/min) by sex were constructed and then V˙o2max was compared between boys and girls for each decile (fig 1). This was done to see if the difference between the sexes appeared over the whole distribution or if only the lower or upper part of the distribution differed. The whole distribution was shifted to the right in boys compared with girls. Differences were found between all groups within sexes using Bonferroni post hoc analysis of variance (p<0.001).
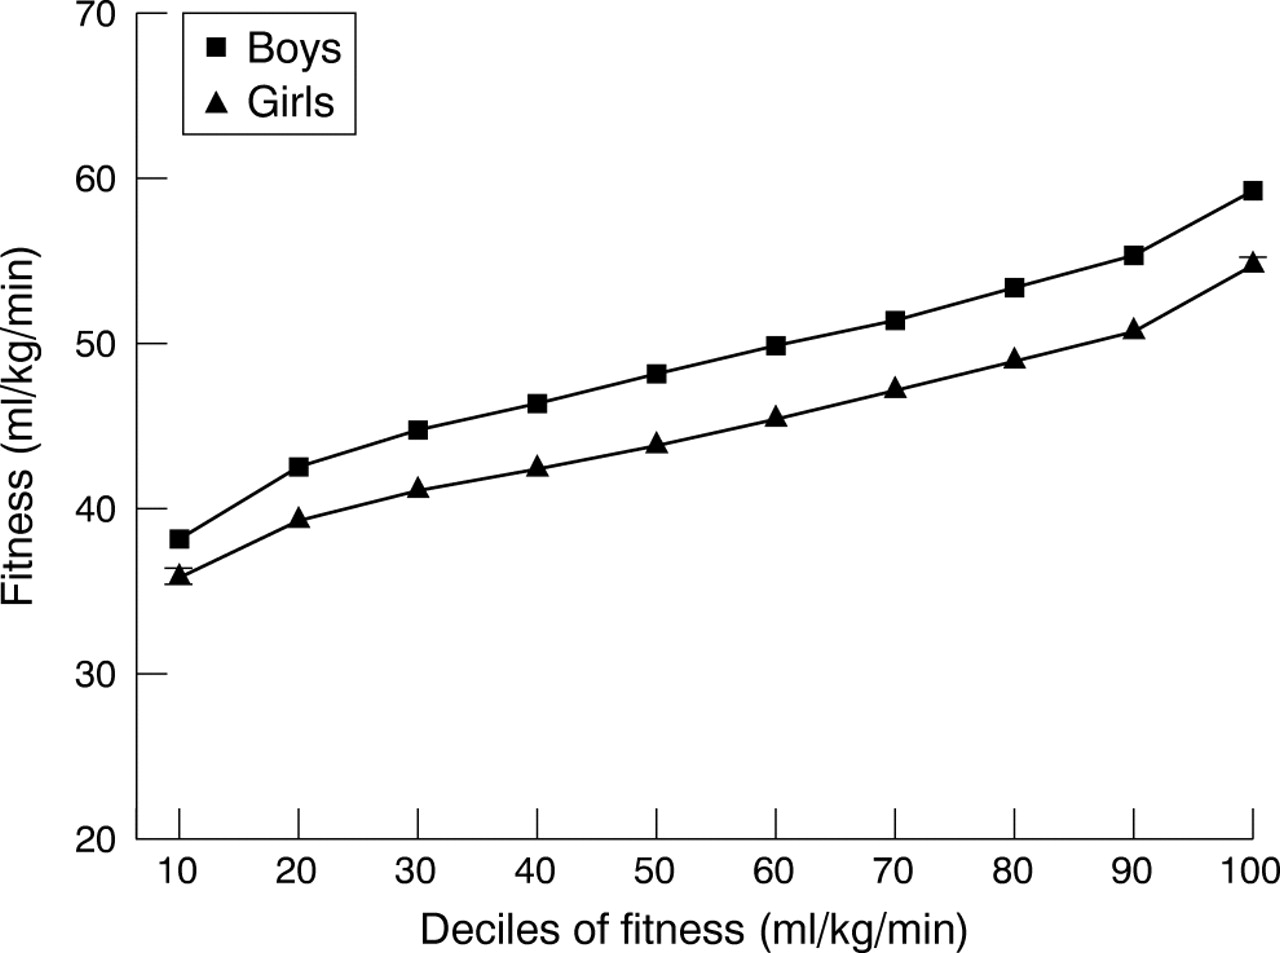
Subjects were ranked into 10 centiles of V˙o2max by sex. The mean V˙o2max was calculated for boys and girls separately in each centile. Standard errors are so small that they are not visible.
Relation between PA and fitness
A scatterplot of V˙o2max relative to body weight and the PA variables showed a linear relation. A linear regression was performed with mean count of PA, the number of minutes above 2000 counts/min in five minute periods, and sex as independent variables, and V˙o2max relative to body weight as a dependent variable.
The following equations where G = 1 for boys and G = 2 for girls were used:
Model (1) V˙o2max (l/kg/min) = 49.9 – 3.8 × G + 0.02 × PAmean count (p<0.001)
Model (2) V˙o2max (l/kg/min) = 49.6 − 3.1 × G + 0.02 × PAin 5 min periods (p<0.001).
Partial correlations for model (1) were −0.38 and 0.12 for sex and PAmean count respectively. Partial correlations for model (2) were −0.25 and 0.24 for sex and PAin 5 min periods respectively.
To explore the relation V˙o2max versus PA and fatness further, all subjects were ranked into six fitness groups by V˙o2max (independent of sex) and the mean sums of PA level (PAin 5 min periods) and SFS were calculated for each sex within each fitness group. When PA was compared between boys and girls with the same level of fitness, boys were more active than girls except for the least fit decile (fig 2). In a linear regression, the association between sex and PA level was highly significant (r = 0.20, p<0.001) even after adjustment for fitness (r = 0.26, p<0.001).

All subjects together were ranked into six groups of V˙o2max relative to body weight. Physical activity level was plotted with SE for boys and girls with the same fitness level. Numbers of girls and boys are shown for each group.
When fatness was compared between boys and girls with the same level of fitness, girls had a larger SFS than boys except for the least fit decile (fig 3). In a linear regression, the association between sex and SFS was borderline significant (r = 0.09, p = 0.05) after adjustment for fitness (r = 0.27, p<0.001). After adjustment for both fitness and PA, there was no difference between sexes with respect to SFS.

All subjects together were ranked into six groups of V˙o2max relative to body weight. Sum of four skinfolds was plotted with SE for boys and girls with the same fitness level. Numbers of girls and boys are shown for each group.
There were only two girls in the most fit group, and no standard error was plotted for this group in fig 3. The opposite analysis was also performed—that is, mean V˙o2max was calculated for boys and girls with the same activity level and the same SFS respectively. The boys had a 3–5 ml/kg/min higher fitness level in each category of activity (p<0.001) and a 1–6 ml/kg/min higher fitness in each category of SFS (p<0.01).
DISCUSSION
The main findings in this study are that, in a large sample of young children, boys had a higher V˙o2max and PA level than girls. Most of the difference in fitness between the sexes could be accounted for partly by body composition and partly by PA. As no differences in haemoglobin or sex hormones have been reported in this age group,17 it is likely that the difference in V˙o2max relative to body weight is due to body composition and PA. However, when children with the same V˙o2max were compared, boys were still more active, and in boys and girls with the same PA level, boys were fitter.
Only a few studies in the literature report measured values of V˙o2max for children less than 8 years of age and only for a small number of children.8,25–27 Mean values of 39–53 ml/kg/min have been reported. Differences in V˙o2max between studies seem to be due, at least partly, to differences in protocol. The lowest mean value reported (39 ml/kg/min) came from a field test.25 The highest mean values found were 53 and 52 ml/kg/min for 5–7 year old boys and girls respectively.26 The highest values were calculated from the original data of Åstrand.26 Testing was carried out on a treadmill with a continuous running protocol in a laboratory setting, and subjects were highly selected. Compared with earlier studies,8,26 in which a difference in V˙o2max relative to body weight of less than 2% between the sexes in prepubertal children was reported, our data show a considerable difference (8%). Rowland23 suggested that at least some of the sex difference in children comes from the difference in fat percentage. In our study, the difference was 23%. As the boys were 3% heavier than the girls, this indicates that at least part of the sex difference in V˙o2max is related to difference in body composition. The much smaller 2% difference we found in V˙o2max relative to LBM between boys and girls supports this. Further, when allometric scaling was performed with LBM as scaling factor, the difference was only 1% and statistically insignificant. This implies that the sex difference in V˙o2max is due mainly to a difference in body composition.
Vinet et al28 and Rowland et al29 came to different conclusions. Vinet et al found no difference in stroke volume and V˙o2max after allometric scaling and stated that body composition alone (and not cardiac functional capacity) could account for the sex difference. Rowland et al found a difference between sexes even after allometric scaling and stated that both body composition and cardiac functional capacity accounted for the difference between boys and girls. Further, Rowland et al found that anthropometric and aerobic physiological factors cannot entirely explain the magnitude of the sex differences.
Physical activity
We found a large sex difference (60%) in PA with regard to sustained activity, and sustained periods of PA explained 9% of the variance in V˙o2max relative to body weight. It was tempting to claim that habitual PA may be part of the explanation for the difference in V˙o2max between boys and girls. This is also the case, but even within the same stratum of V˙o2max the boys had a higher PA level, so differences in PA seem only partly to explain the differences in V˙o2max. Sundberg30 compared V˙o2max (ml/kg/min) in sighted children and blind children, who are not able to participate in vigorous play, and found 22% and 26% higher values in sighted boys and girls respectively compared with blind children. From Sundberg’s data, it could be expected that much of the difference between fitness levels in prepubertal children can be explained by differences in PA. It is therefore surprising in the present study that boys were more active than girls even within the same stratum of fitness. It is perhaps less surprising that boys have smaller SFS compared with girls in the same stratum of fitness. These two observations support the view of Rowland et al29 that the higher level of fitness in boys is due to both the higher level of PA and the lower level of fatness.
Representativity
The number of children in this study is relatively high and represents 69% of all children in preschool in two suburban communities of Copenhagen. There were no significant differences between participants and non-participants in age, height, weight, and BMI in the study, so it seems safe to conclude that the participant cohort is representative of the two communities. Further, we have compared our sample with a sample from nationwide Danish studies with measurements of height and weight in children.31,32 The differences between these two studies and our study with regard to mean height and BMI are less than 1%. It seems reasonable to conclude that with regard to height and BMI our cohort is representative of Danish children aged 6–7 years. The strengths of this study are that a large number of subjects were examined using objective and direct measurements and that the sample was representative.
What is already known on this topic
No study has assessed population data in 6–7 year old children on aerobic fitness and physical activity using direct measurement of V˙o2max and objective measurement of physical activity.
What this study adds
-
Even in 6–7 year old children, boys had 8% higher fitness levels than girls, and the difference in fitness may mainly be explained by differences in physical activity level and body composition
-
Moderate intensity physical activity may not influence physical fitness but still change body composition
The number of rejected tests in this study is relatively high. Even though there were no differences in age and size between subjects with valid tests and rejected tests, the tendency was that younger and smaller children chose not to run or stopped prematurely. We also chose to reject the data for 57 children who actually ran a subjectively approved test, but did not have a V˙o2max recording. In the end, 84% of the participating children completed a valid test, and we consider this satisfactory, especially as some authors have claimed that the reliability or validity of testing V˙o2max in children aged less than 8 years is questionable.33,34 Our own validation of the protocol showed good reliability, and it seems reasonable to conduct reliable physiological testing on 6–7 year old children with satisfying results. It should be noted that care must be taken to carefully examine every child’s measurements to ensure that the appropriate criteria have been met, and to discard non-valid tests. In conclusion, the absolute levels of V˙o2max relative to body weight were 48.5 ml/kg/min and 44.8 ml/kg/min in girls, V˙o2max is larger in boys than girls (+11%), also when related to body mass (+8%) and to LBM (+2%). Most of the difference in V˙o2max relative to body mass was due to the greater percentage body fat in girls and lower level of PA. When boys and girls with the same V˙o2max were compared, boys engaged in more minutes of at least moderately intense activity and had a smaller SFS.
REFERENCES
Footnotes
-
Competing interests: none declared