Article Text

Abstract
Objectives: To undertake a detailed, large scale epidemiological study of match injuries sustained by professional rugby union players in order to define their incidence, nature, severity, and causes.
Methods: A two season prospective design was used to study match injuries associated with 546 rugby union players at 12 English Premiership clubs. Team clinicians reported all match injuries on a weekly basis and provided details of the location, diagnosis, severity, and mechanism of each injury. Match exposures for individual players were recorded on a weekly basis. Loss of time from training and match play was used as the definition of an injury.
Results: The overall incidence of injury was 91 injuries/1000 player-hours, and each injury resulted on average in 18 days lost time. Recurrences, which accounted for 18% of injuries, were significantly more severe (27 days) than new injuries (16 days). Thigh haematomas were the most common injury for forwards and backs, but anterior cruciate ligament injuries for forwards and hamstring injuries for backs caused the greatest number of days absence. Contact mechanisms accounted for 72% of injuries, but foul play was only implicated in 6% of injuries. The ruck and maul elements of the game caused most injuries to forwards, and being tackled caused most injuries to backs. The hooker and outside centre were the playing positions at greatest risk of injury.
Conclusions: On average, a club will have 18% of their players unavailable for selection as a consequence of match injuries.
- elite rugby
- competition
- injury
- risk factors
Statistics from Altmetric.com
Rugby union is one of the most popular professional team sports in the world, but it also has one of the highest reported incidences of injury, irrespective of the injury definition used (table 1). It is therefore essential that the national and international governing bodies for rugby union together with team coaches and doctors have a complete understanding of the incidence, nature, severity, and causes of injuries in order to review the adequacy of their injury prevention, treatment, and rehabilitation strategies. Since rugby union became a professional sport in 1995, epidemiological studies of professional players have been limited to relatively small sample populations.1–4 This meant that only small numbers of injuries (49–145) were recorded, which restricted the depth of analysis that could be undertaken and the conclusions that could be drawn from the studies.
Effect of injury definition on reported incidences of match injuries in a range of professional team sports at club and international levels
The aim of this research was to undertake a detailed, large scale analysis of match injuries sustained by professional rugby union players in order to produce results and conclusions that could be used by stakeholders throughout the sport. Specific objectives of the study were to define the incidence, nature, severity, and causes of match injuries. A similar detailed study describing the incidence, nature, severity, and causation factors of training injuries is reported separately in part 2.5
METHOD
Players from 12 of the 13 clubs competing in the English Premiership during the 2002/03 and 2003/04 seasons (98 weeks) took part in the study. Players were included or excluded from the study when they became or ceased to be members of the club’s first team squad; all but six eligible players agreed to take part in the study. In total, 546 players took part (300 forwards, 246 backs), of which 296 were involved in both seasons. The average team squad size was 38 players.
The primary injury definition4 used in the study was “any injury that prevents a player from taking a full part in all training and match play activities typically planned for that day for a period of greater than 24 hours from midnight at the end of the day the injury was sustained”. In order that the overall incidence of injury could be compared with previous studies where a missed match definition of injury was used, injuries were also classified using the secondary definition4 “all injuries resulting in a player missing at least one competitive match”. However, unless specified otherwise, an injury refers to the primary definition throughout the text. Injury severity was defined by the number of days a player took to return to full fitness; full fitness was defined as “able to take a full part in training activities (typically planned for that day) and available for match selection”. An injury was reported as a recurrence on the basis of the judgment of the clinician assessing the injury. Absences because of illness and non-sport-related medical conditions were not included in the study.
Medical personnel at each club reported the details of every injury using a modified Orchard Sports Injury Classification System6 together with details related to the occurrence of the injury on a standard injury report form. Individual player match exposure data were recorded every week for each player; this identified position played and the total time on the field. A one month pilot study of the injury report form and the injury recording process was undertaken at three of the clubs before the start of the audit.
Incidence of injury was recorded as the number of injuries/1000 player-hours of match exposure. Significant differences in values for incidence and severity were assumed if the 95% confidence intervals (CI) for the variables did not overlap. Clubs provided the age, stature, and preseason body mass of players: data were reported as mean (SD). Variations in body mass measurements between clubs were assessed using a reference player (forward), who was measured at each club (mean (SD) 103.5 (0.7) kg; range 2.4 kg). Differences in age, stature, and body mass between groups were identified with t tests, where p⩽0.05, the absolute effect size and p value are reported.
RESULTS
Table 2 shows the mean age, stature, and body mass of the cohort. Differences were observed between forwards and backs for all three measures (age 1.1 years, p<0.001; stature 6.8 cm, p<0.001; body mass 19.0 kg, p<0.001).
Anthropometric data for the sample population
In total, 16 782 hours (forwards, 8973; backs, 7809) of play (420 matches) and 1534 injuries (forwards, 826; backs, 708) were recorded. This equated to a mean of 70 (95% CI 66 to 74) match injuries per team per season (forwards, 38 (95% CI 35 to 41); backs, 32 (95% CI 30 to 34)). Eleven players (three in 2002/03 and eight in 2003/04) retired because of injuries sustained during the study; none were catastrophic or permanently paralysing. In total, 27 639 days of playing and training time were lost through injury (forwards, 14 839; backs, 12 800). The mean number of match injuries per player was 1.8 (95% CI 1.7 to 1.9) per season, and the mean amount of playing and/or training time lost per player was 33 days (95% CI 31 to 35). Forwards received 1.8 injuries (95% CI 1.7 to 1.9) per season and missed 32 days (95% CI 30 to 34); backs received 1.9 injuries (95% CI 1.8 to 2.0) per season and missed 35 days (95% CI 32 to 38).
Incidence and severity of injury
There were no significant differences between forwards and backs with respect to the incidence or severity of new or recurrent injuries (table 3). The incidence of new injuries (82%) was significantly higher than that of recurrent injuries (18%), and the severity of recurrent injuries was significantly higher than that of new injuries for forwards and backs. Figure 1 shows the incidence of injury as a function of severity (days absence). Minor injuries (⩽7 days absence) accounted for 54% of injuries (12% of days lost), moderate injuries (>1–3 weeks) for 26% of injuries (18% of days lost), and major injuries (>3 weeks) for 20% of injuries (70% of days lost). The incidence of injuries resulting in a competitive match being missed (43%) was 40 (95% CI 37 to 43) (forwards, 38 (95% CI 34 to 42); backs, 41 (95% CI 37 to 46)) with a severity of 35 days (95% CI 32 to 39) (forwards, 37 (95% CI 31 to 42); backs, 33 (95% CI 29 to 38)).
Incidence (number of injuries per 1000 player-hours) and severity (days absence) of new and recurrent injuries
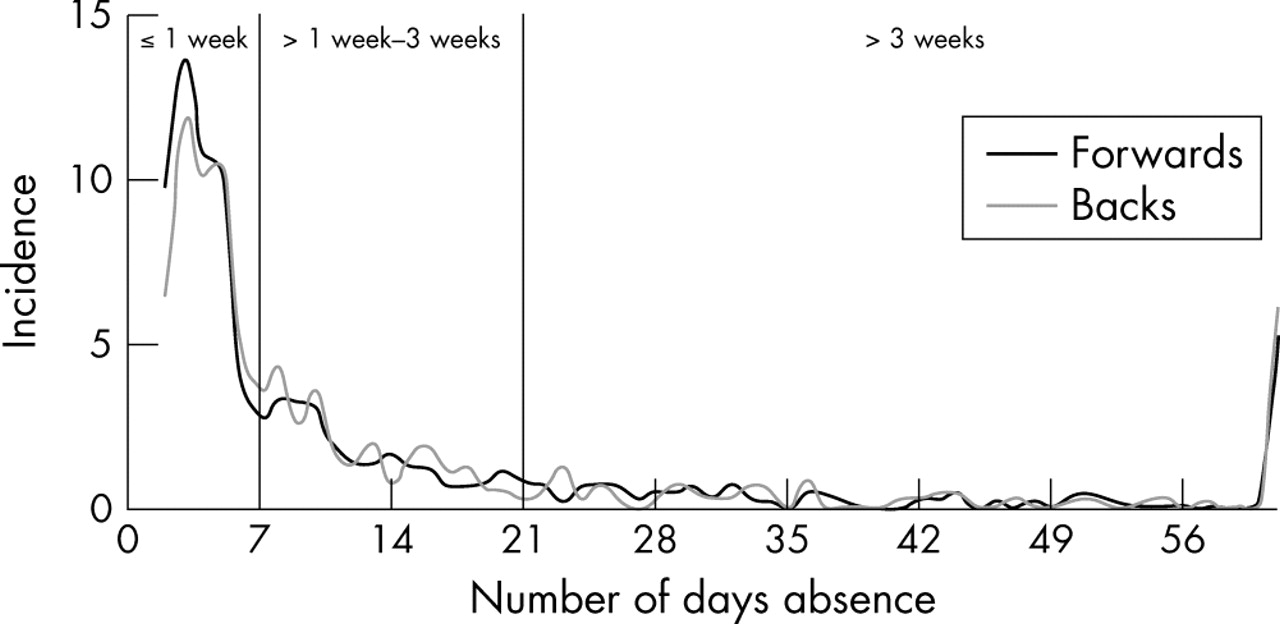
Injury incidence (number per 1000 player-hours) as a function of severity (days absence) for forwards and backs.
Nature of injury
Table 4 shows the distribution and severity of injuries in terms of location and pathology. The two most common pathologies were muscle/tendon and joint (non-bone)/ligament injuries, of which joint (non-bone)/ligament injuries had a significantly higher severity. There was a significantly higher severity for upper limb injuries than head/neck and trunk injuries, and the severity of fractures/bone stress injuries was significantly higher than that for all other pathologies.
Nature and severity of injuries as a function of their location and pathology
Figures 2 and 3 show the incidence and severity respectively of injuries in terms of anatomical location. Table 5 presents the incidence and severity of specific diagnoses as functions of injury location and playing position and highlights the 10 most common injuries for forwards and backs. Table 6 lists the injuries presenting the greatest risk (total days absence).
Incidence (number per 1000 player-hours) and severity (days absence) of specific injuries as a function of playing position
Injury diagnoses causing the greatest number of days absence for forwards and backs

Injury incidence (number per 1000 player-hours) with confidence intervals by anatomical location.

Injury severity (average days absence) with confidence intervals by anatomical location.
Playing position
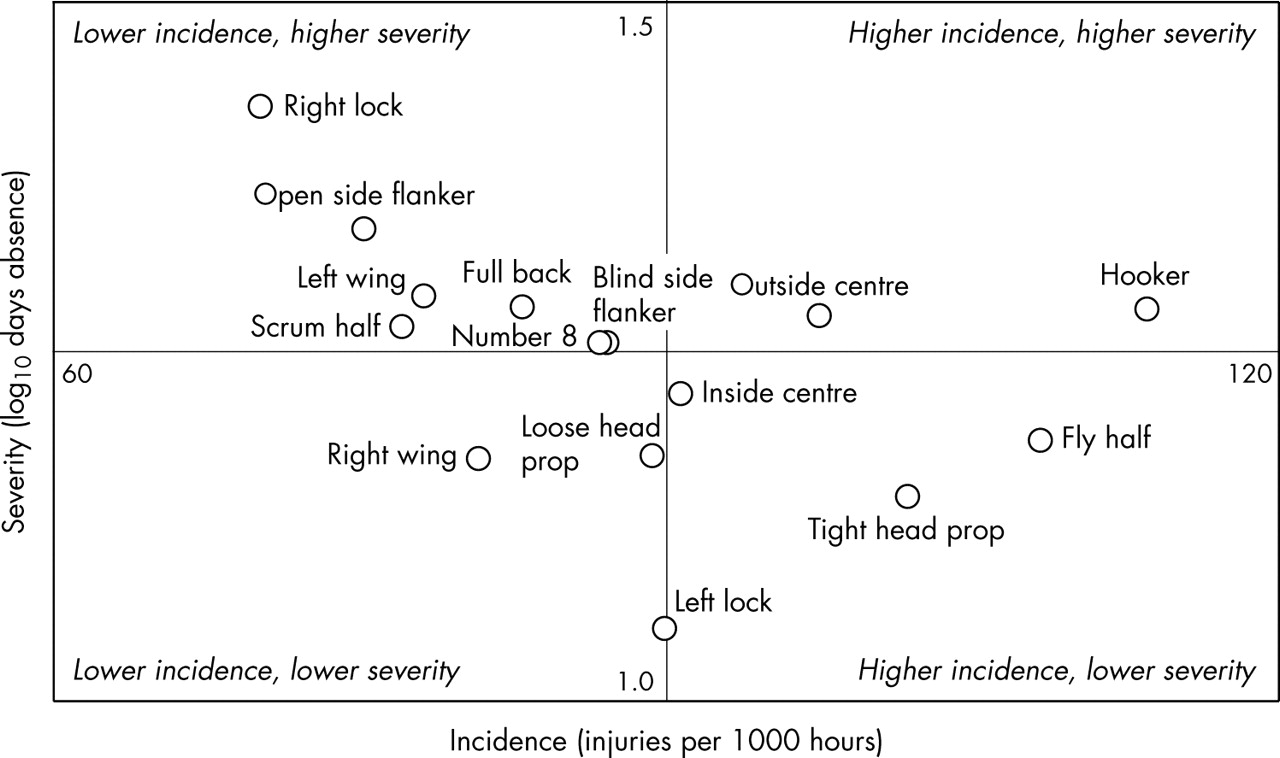
The incidence and severity of injuries in terms of playing position are summarised in table 7 and illustrated in fig 4. Hookers and fly halfs experienced the highest incidence of injury, and right locks and open side flankers experienced injuries with the greatest severity. Hookers and outside centres were at the greatest overall risk of injury (incidence and severity).
Incidence and severity of injuries by playing position

Incidence and severity of injuries by playing position.
Time of match
Figures 5 and 6 show the incidence and severity of injuries as functions of the time during the match. The incidence during the final quarter was higher for players starting a match (114; 95% CI 101 to 126) than for replacement players (87; 95% CI 66 to 108). The higher severity of injuries observed for backs in the third quarter was mainly because 75% of all ACL injuries sustained by backs (average severity 204 days) occurred during this period.

Injury incidence (number per 1000 player-hours) with confidence intervals by time during the match.

Injury severity (average days absence) with confidence intervals by time during the match.
Time of season
Figures 7 and 8 show the incidence and severity of injuries during the season. Although there were no significant differences in the monthly incidences of in-season injury, there was a significantly lower incidence of injury during preseason (August) matches (67; 95% CI 53 to 83) compared with the average incidence of injury for in-season matches (98; 95% CI 92 to 102).

Incidence (number per 1000 player-hours) of match injuries with confidence intervals during the season.

Severity (total days absence) of match injuries with confidence intervals during the season.
Injury mechanism
Six per cent of all injuries (forwards, 7%; backs, 6%) were caused by foul play. Figures 9 and 10 show the incidence and severity of injuries as a function of mechanism. Most injuries (72%) were sustained during contact with another player. The overall incidence for contact injuries was higher for forwards (70; 95% CI 65 to 76) than backs (61; 95% CI 56 to 67), although it was slightly lower (57; 95% CI 52 to 62) when the forward specific scrum and line out injuries were excluded. Injuries sustained during scrummaging accounted for 11% of injuries to forwards, but only a small proportion of these (15%) were caused by a collapsed scrum. The incidence of “tackled” injuries was significantly higher for backs, and the incidence of “ruck/maul” injuries was significantly higher for forwards. Most injuries sustained from being tackled were from side on (51%) and head on (34%) tackles, whereas most injuries sustained from tackling were caused by head on (56%) and side on (38%) tackles. The overall incidence of non-contact injuries was significantly higher for backs than forwards. There were no significant differences in injury severity as a function of injury mechanism. Table 8 lists the most common injury and the injury causing the greatest number of days absence for each injury mechanism.
Injuries of highest incidence and causing the greatest number of days absence as a function of mechanism

Injury incidence (number per 1000 player-hours) with confidence intervals by main mechanism.

Injury severity (average days absence) with confidence intervals by main mechanism.
Type of competition
Table 9 shows the incidence and severity of injuries within different types of competition. There was a significant difference in the incidence of injury between friendly/second team matches and Premiership and National Cup matches.
Injury incidence and severity as a function of playing level
DISCUSSION
The incidence of injury in this study (91) was lower than that reported previously for rugby union1 (120); however, the data from the previous study related to just one team for one season, and the number of injuries recorded was relatively small. The incidence in the present study was higher than that reported previously in professional ice hockey7 (78), soccer8,9 (26) and cricket10 (1.8). The incidence was significantly lower than that reported in a previous study of English international rugby union players4 (218), which is consistent with results observed in other team sports, where the incidence of injury is generally higher at international level than club level (table 1). Using the missed match definition of injury, the incidence in the present study (40) was similar to values reported previously for rugby union1 (45) and rugby league11 (39), but higher than values reported for Australian Rules Football12 (26) and soccer13 (5). There is no comparable data for professional American Football, although a value of 28 has been reported for collegiate level players.14
A number of rugby union studies have reported that injury rates increase as the standard of play increases.2,15–18 This is consistent with results from our study, where the incidence was higher during the major club competitions than during friendly/second team matches. One reason suggested for the higher incidences of injury observed at higher standards of play is the more efficient injury reporting regimens available at elite clubs1 because of the superior standard of their medical support. This factor can be discounted in our study, as the medical teams reporting injuries were the same for all matches. Greater body mass of players at higher playing standards has also been suggested as a contributory reason for the differences.15,18 However, this factor can also be discounted in our study, as the players were drawn from the same group. In addition, the average body mass of the sample population in a previous study of international players4 was very similar to that in our study yet the incidence of injury reported at international level was twice the value at club level. Factors that may explain the differences include body composition, levels of player fitness and strength, ball in play times, and the more competitive nature of matches at higher standards.1,15,18
We observed no significant differences in the incidence of injury for forwards and backs, whereas other studies at club level have reported higher proportions or incidences of injury for forwards compared with backs in rugby union (65%1 and 59%3) and rugby league (forwards, 139 injuries/1000 player-hours; backs, 93 injuries/1000 player-hours19). Greater contact and collision demands placed on forwards compared with backs20 and the significantly greater body mass of forwards, which allows them to develop greater momentum,21,22 have been suggested as possible explanations for the higher incidence of injury in forwards. Conversely, at the international level,4 the incidence of injury was reported to be lower for forwards (194) than for backs (246), although the differences were not significant.
The lowest incidence of injury was observed in the first quarter, and the highest in the final quarter of matches, which is a similar result to that observed in soccer.8 These results implicate fatigue as an injury risk factor, although it is difficult to identify specific central or peripheral causes. The lower incidence of injuries observed during the preseason period probably reflected the lower competitive nature of the matches (friendlies) played at this time of the season.
Most injuries recorded in this study were new injuries (82%), with a similar proportion of recurrent injuries (18%) to that reported previously (15%) by Targett1 and Brooks et al.4 The significantly greater severity of recurrent injuries compared with new injuries highlights the importance of ensuring complete and effective rehabilitation of injured players. Compared with international players,4 the average severity of injuries sustained in this study by forwards was similar (18 v 17 days), but for backs it was higher (18 v 12 days). The average severity of new injuries was higher (16 v 12 days) and for recurrent injuries it was similar (27 v 28 days) when compared with international players.4
The lower limb was the most common injury location, which is similar to the patterns observed in previous studies.1,3,4 Thigh haematomas were the most common injury for forwards and backs, although their low severity meant that these injuries did not generally cause players to miss a match. Hamstring injuries were the second most common injury, but their incidence was significantly higher for backs than forwards; this may be due to the greater acceleration, deceleration, and high speed running demands placed on backs compared with forwards,20 although it may also indicate suboptimal hamstring conditioning.23 Concussive injuries are considered to be difficult to diagnose24 and they are often under-reported.25 Nonetheless, they were still the third (equal) most common injury reported in this study. The incidences of most neck and spinal injuries were significantly higher for forwards than for backs and this may result from scrummaging and the higher exposures to contact activities, such as tackling, rucking, and mauling,20 experienced by forwards compared with backs. Anterior cruciate ligament, medial collateral ligament, and knee meniscal/articular cartilage injuries were particularly severe for both forwards and backs, a finding that was similar to previous studies.1–3,26 Knee injuries also resulted in the highest total numbers of days absence for forwards and backs. Shoulder dislocation/instability was responsible for the second highest number of days absence, with acromioclavicular and rotator cuff injuries noticeable in forwards.
In previous studies, the number 8 and lock among the forwards and the full back and fly half among the backs were reported to be the most commonly injured players in professional teams.1,3 In the current study, the hooker and the fly half were the most commonly injured players, and the right lock and open side flanker received the most severe injuries. Overall, however, hookers and outside centres were the playing positions at greatest risk from injury. Front row players are subjected to the absorption and transmission of greater forces in scrummaging27 than other forwards, and this may contribute to the higher risk of absence from shoulder, cervical nerve root, knee meniscal/articular cartilage, calf muscle, and Achilles tendon injuries experienced by hookers. Midfield backs (centres) tend to experience more collisions than the other back line players, and this may explain the higher level of absence from shoulder dislocation/instability, wrist and hand fractures, cervical nerve root injuries, and thigh haematomas experienced by outside centres.
In terms of injury mechanisms, foul play was responsible for only a small proportion (6%) of the injuries reported in this study; this was similar to the value reported previously (4%) by Bathgate et al.3 Unlike soccer therefore, where foul tackles were implicated in 44% of injuries,28 non-compliance with the laws of the game does not represent a major risk factor in rugby union. Most contact injuries occurred in the tackle situation, which is similar to reports in previous studies of rugby union1–4,15 and rugby league.19,29 Tackles made in open play involve a greater element of open skill and are therefore less predictable than actions such as scrummaging and mauling, which involve a greater element of closed skill. The incidence of injury from being tackled was significantly higher for backs than forwards; the higher kinetic energy generated by running backs in open play and the dissipation of this energy during the tackle may be a contributory factor. Head on tackles caused most injuries to players when tackling, and the most common injuries were cervical nerve root injuries and concussion, although dislocation/instability of the shoulder caused the greatest number of days absence. Appropriate conditioning and the recognition by players that they should optimise their tackling technique during aggressive head on tackles are therefore important injury preventive issues.30 Side on tackles caused most injuries sustained while being tackled, and the most common injuries were haematomas of the thigh, although medial collateral ligament injuries for backs and anterior cruciate ligament injuries for forwards caused the greatest number of days absence. There was a significantly higher incidence of injury to forwards than backs in ruck and maul situations, and this reflects the greater involvement by forwards in this aspect of the game.20
What is already known on this topic
-
The incidence and severity of match injuries in professional rugby union are among the highest of mainstream team sports
-
The tackle is the main mechanism of injury for forwards and backs
This large scale epidemiological study has defined in detail the injury profile of match injuries in elite rugby union. The tackle, which represents the highest risk injury mechanism, requires further study using for example video analysis, in order to define and understand the specific characteristics of this aspect of the game. On the basis of the incidence and severity of injuries reported in this study, if a professional club played one first team match a week and one second team match every other week, the club would have, on average, seven players unavailable to play each week because of match injuries; this is equivalent to 18% of an average club’s squad. As 5% of players will also be unavailable to play as a consequence of training injuries,5 the total impact of injury is that 23% of an average club’s squad will be unavailable for selection at any time.
What this study adds
-
The study provides a detailed analysis of injury incidence and severity as functions of individual playing positions together with the identification of those injuries causing the greatest loss of time
-
The incidence and severity of injuries are also presented as a function of mechanism for forwards and backs
Acknowledgments
We acknowledge the collaboration and work of the doctors and physiotherapists from the following clubs who have recorded injury information throughout the project: Bath Rugby (C Mallac); Bristol Shoguns (D Sanderson); England (B Kenny, M Snelling, T Weighmann); Gloucester RFC (N Allen, W Diesel, K Owen); Leeds Tykes (M Blenkinsop, I Horsley, M Jones); Leicester Tigers (C Brookes, R Cross, M Geeson); London Irish (A Leaver, R Mack); London Wasps (R Knibbs); NEC Harlequins (S Scott, C Steele); Northampton Saints (C Eaton, D Lewindon, J Moore, P Pask); Rotherham Titans (C Bynie); Sale Sharks (M Sinclair); Saracens (R Naish, N Roe). We also thank Dr Richard Hawkins (The Football Association) for his advice, R Lowe (Optaindex) for technical data, and The Rugby Football Union for their financial support.
REFERENCES
Footnotes
-
Competing interests: none declared