Article Text

Abstract
Emerging evidence supports a link between neighbourhood built environment and physical activity. Systematic methodologies for characterising neighbourhood built environment are needed that take advantage of available population information such as census-level demographics. Based on transportation and urban planning literatures, an integrated index for operationalising walkability using parcel-level information is proposed. Validity of the walkability index is examined through travel surveys among areas examined in the Neighborhood Quality of Life Study (NQLS), a study investigating built environment correlates of adults' physical activity.
Statistics from Altmetric.com
Urban planners and transportation professionals studied how urban form is related to walking and cycling for transport, transit use, traffic congestion, air quality and open space conservation.1,–,5 Active transportation is consistently positively associated with urban form variables of greater mixed land use, street connectivity, residential density and combinations of these variables.6,–,8 Urban form is related to the total amount of physical activity for recreational and transportation purposes.9,–,13 People living in more “walkable” and “bikeable” neighbourhoods with homes in proximity to non-residential destinations are less likely to be overweight or obese than people living in more suburban neighbourhoods that require motorised transportation.11 13,–,15 Improving the built environment to make it easier for people to be physically active, in part through more active transportation, is an essential component of increasing physical activity.16,–,19
However, some investigators have either not found such an association or have found weak relations between built environment factors and active transportation.20 These investigators posit that it is not clear which urban form factors are the most influential on active versus non-active transport. This necessitates further research and better specification of the urban form variables most influential on active transport.
Ways of measuring urban form in physical activity studies
This paper focuses on the systematic measurement of urban form to enhance the study of active transportation and physical activity. To date, measurement of walkability variables has included expert opinion about community typology,5 census data, systematic observations,12 21 land-use databases using Geographic Information Systems (GIS),22 and a regional “sprawl index”.1 The urban form variables evaluated have been numerous, including land use mix, street connectivity, sidewalk availability, building setbacks and dozens of others.
Given the large number of potential built environment factors that may influence transportation mode choice, there has been interest in deriving composite factors that combine multiple aspects of community design. Cervero and Kockelman developed such measures through factor analysis in an attempt to operationalise the larger constructs of density, diversity and design (the 3 Ds) from a variety of built environment variables within 50 San Francisco Bay area neighbourhoods (single or clustered census tracts).23 Using a different geographic unit of 150m grid cells, Krizek operationalised neighbourhood accessibility through factor analysis of housing density, retail employee density and street design.24 Levine and colleagues further developed a composite measure of walkability through the use of cluster analysis in their work on neighbourhood preference.25 Variable reduction tools and use of resulting factors help address colinearity problems. However, using data reduction techniques such as factor analysis for survey design purposes and resulting neighbourhood selection based on walkability can rule out important vectors of the built environment that explain travel choice and physical activity. For example, Cervero and Kockelman23 found that certain built environment variables that did not load on their intensity and walking quality factors (eg, land use mix) were related to mode choice. In addition, factor analysis is designed to examine unique effects of one derived environmental factor or variable, not the collective effects of multiple land use variables. Some would argue that synergy for environmental factors already naturally exists (eg, land use mix is usually found in high residential dense areas), but Krizek24 highlights many instances to the contrary. In the present study, we propose a new composite index of built environment factors.
In addition to the need to examine the influence of a combination of built environment factors on active transport and physical activity, health research necessitates sampling at a geographic level at which other critical data sources are available. For instance, to examine influences of neighbourhood-level sociodemographic factors on health behaviours such as physical activity, geographic units with known sociodemographics must be selected. For example, Krizek's 150m grid cell provides excellent pedestrian scale resolution, but existing sociodemographic information is not available at this scale (eg, census data). The Transportation Research Board – Institute of Medicine8 report identified the limitation that built environment-health associations in specific population subgroups are essentially unstudied.
Therefore, the primary aim of the present paper was to develop, test and apply an integrated method of identifying and sampling diverse built environments and populations to optimise the power and relevance of studies of the built environment and health. The current study builds on the work performed to date by establishing a systematic and “orthogonal” approach for neighbourhood level sampling that can help to isolate urban form or “walkability” from sociodemographic characteristics that also impact travel and activity patterns. The methods presented can be applied to test a variety of policy-related outcomes that encompass issues of equity, health and environmental sustainability. It was hypothesised the GIS-based walkability index would be related to household travel patterns such as levels of walking and driving.
The composite index was used to select neighbourhoods for investigation in the Neighborhood Quality of Life Study (NQLS). Most studies in the health field examine only demographic, psychological and social variables, and these variables explain a limited amount of variance in physical activity.26 Unlike prior studies, the NQLS is based on an ecological model that emphasises multiple levels of influence on behaviours, including the physical environment,27 28 and integrates concepts and methods from urban planning, public health and behavioural science disciplines. The primary aim of the NQLS is to explore the association of physical environment characteristics with physical activity. It is hypothesised that physical environment variables are independently associated with adults' physical activity above and beyond the variance explained by psychosocial and sociodemographic variables. Further, it is hypothesised that individuals who live in higher “walkable” neighbourhoods (defined in this study as an adjacent cluster of census block groups) will engage in more physical activity than those living in lower “walkable” neighbourhoods. The generalisability of findings will be assessed by examining associations in high income and low income participants.
Methods
Possible land use variables to include in the walkability index were chosen a priori based on extensive conceptual2 21 and empirical literature5 data that point to residential density, mixed used and connectivity as key components of walkability. Because building setbacks are also important predictors of walking and pedestrian-oriented design,23 28 29 retail floor area ratio was added as a novel component. Rather than requiring all these variables to co-vary, as in factor analysis, the individual variables are summed, based on the rationale that the combination of these theory-based and empirically-based variables represents walkability and will explain travel behaviour and other outcomes. Although many other variables have been hypothesised, and in some cases shown to be related to active transport4 7 23 such as sidewalks, traffic calming and intersection characteristics, those variables are not widely available in existing datasets, so the present four-component index represents a practical starting point and improved versions can be developed as conceptualisation and data availability improve.
Creating a “walkability surface”
Census block group-level data were chosen as the most appropriate geographical scale, to take advantage of available socioeconomic data at this geographic level such as median household income, race and ethnic distribution, the number of households, median age and education. For each block group, the “walkability” index was derived as a function of net residential density, retail floor area ratio (FAR), land use mix and intersection density. The measures were computed from parcel-based land use data, street centreline files (supplied by King County, Maryland Property View and Baltimore City) and census data in the two study areas (King County, Washington, and Maryland). Retail floor area ratio was introduced to increase the sensitivity to retail use believed to stimulate pedestrian activity. Since the measures relied on values such as structure floor area footprint and parcel land area, the accuracy of the parcel-based land use data was critical. Multiple steps were taken to evaluate and improve accuracy and completeness of the data. In some cases, regression was used to populate missing building floor area footprint values, based on assessed improvement (structure) value, parcel land area and year-built data fields.
The four components of the walkability index include:
▶. Net residential density; the ratio of residential units to the land area devoted to residential use per block group.
▶. Retail floor area ratio; the retail building floor area footprint divided by retail land floor area footprint. The rationale was that a low ratio indicated a retail development likely to have substantial parking, while a high ratio indicated smaller setbacks and less surface parking; two factors thought to facilitate pedestrian access.
▶. Intersection density measured the connectivity of the street network, represented by the ratio between the number of true intersections (three or more legs) to the land area of the block group in acres. A higher density of intersections corresponds with a more direct path between destinations.
▶. Land use mix, or entropy score, indicated the degree to which a diversity of land use types were present in a block group. For this project, the mix measure considered five land use types: residential, retail (excluding region-serving or “big box” uses of approximately 91 440 m2 (300 000 square feet) or larger), entertainment (including restaurants), office and institutional (including schools and community institutions). Values were normalised between 0 and 1, with 0 being single use and 1 indicating a completely even distribution of floor area across the five uses.
The four calculated values were normalised using a z score. For example, a normalised net residential density score of “1” would indicate that the raw value was 1 standard deviation above the mean value for the category. z Scores were computed in the two regions separately, so block groups were normalised for the distribution in each region. The walkability index was the sum of the z scores of the four urban form measures, as stated in the following expression:
Walkability = [(2×z−intersection density)+(z−net residential density)+(z−retail floor area ratio)+(z−land use mix)]
The street connectivity z score was weighted by a factor of two within the walkability index. This was based on prior evidence regarding reported utilitarian walking distances7 and the resulting strong influence of street connectivity on non-motorised travel choice.5 Further input confirming this weighting scheme was obtained through iterations between alternative weighting schemes and resulting neighbourhood types that emerged. Census block groups and corresponding neighbourhoods selected with different weighting schemes were evaluated based on expert opinion and against primary data collection on pedestrian travel in King County.30 The resulting geographic distribution of walkability at the block group level for King County and the Baltimore–Washington region is shown in figs 1 and 2, respectively. Darker colours indicate census block groups that were the most walkable.

Distribution of Seattle–King County walkability measures.
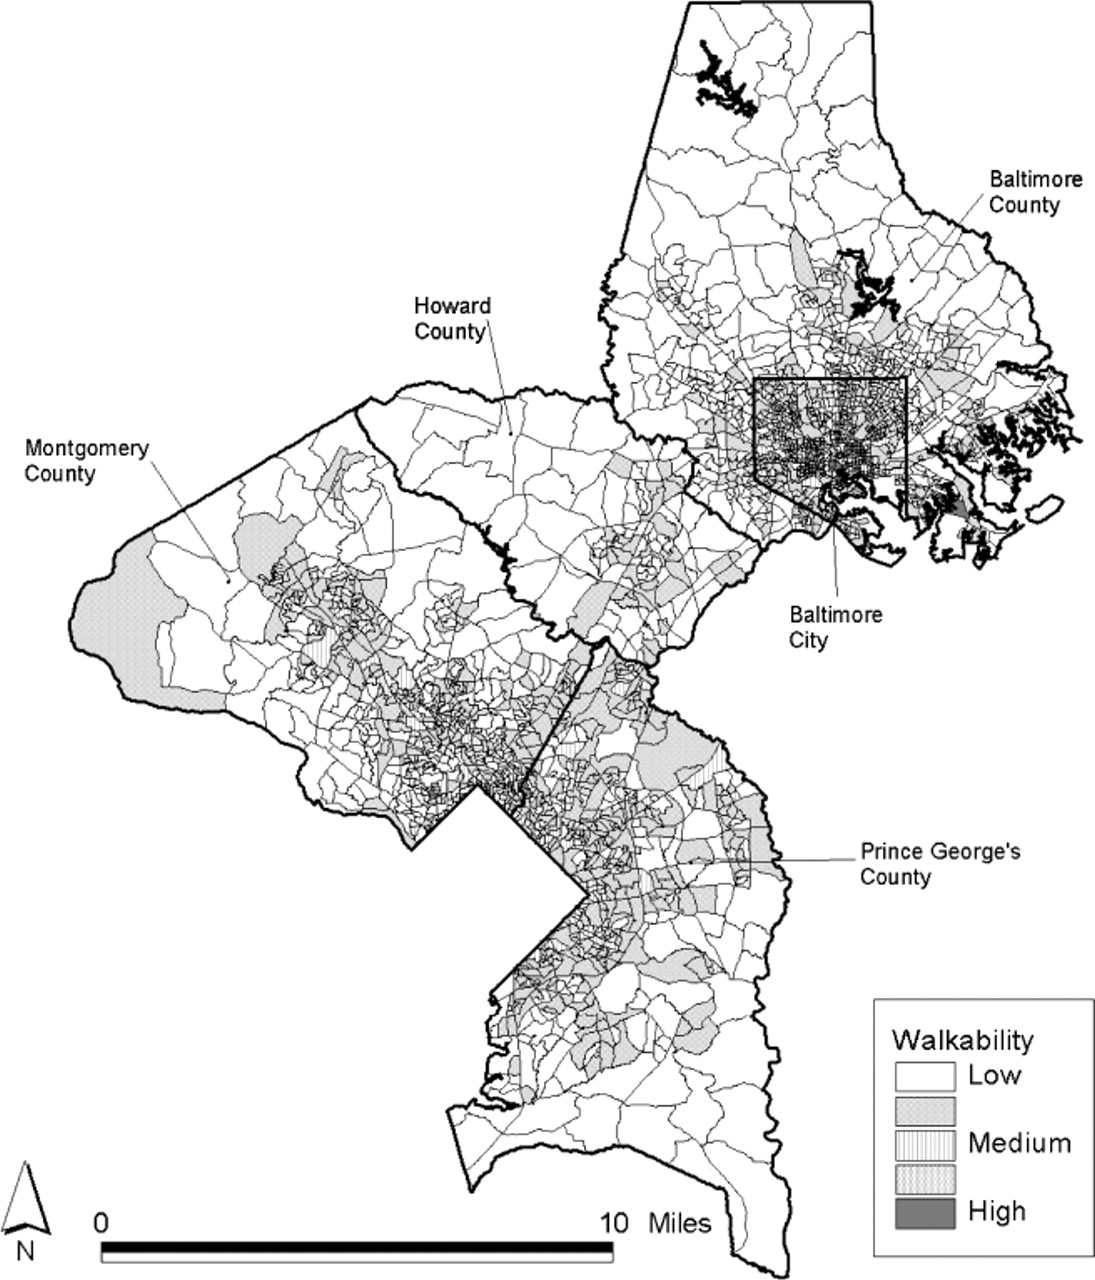
Distribution of Baltimore–Washington walkability measures.
The walkability index values ranged from −1.29 to 8.28 in the Seattle region and from −1.57 to 8.17 in the Baltimore–Washington region. The fact that the two regions with completely different sources of data produced similar walkability values supports the face validity of the index. It further suggests comparability of the land use and street network data that were used in the neighbourhood selection process.
Testing the walkability index
Our tests of the construct validity employ travel data from the census journey to work for King County–Seattle and Baltimore–Washington, DC regions and the Household Travel Survey Data available in the King County–Seattle region. Census journey to work data examines whether the walkability index predicts work-related travel in two regions, but it was a limited test. Household travel survey data provide better measures of overall travel patterns, because approximately 83% of trips taken in the US are for non-work purposes.7 31
Data from the 1999 Puget Sound Transportation Survey collected by the Puget Sound Regional Council include 2581 King County households who reported travel patterns over a 2-day period. Households in the Puget Sound Transportation Survey were geocoded to the census block groups in which they resided. Each of the census block groups within King County were arrayed and grouped into deciles according to their walkability index scores, as shown in figs 1 and 2. The distribution of households from the lowest to highest decile of walkability was: 181, 210, 259, 266, 265, 304, 243, 278, 268, 307 and 307, respectively. Walking trips were examined according to walkability decile. While number of walk trips is an important predictor of physical activity, the number of miles travelled per day in private vehicles or vehicle miles of travel (VMT) is widely used in transportation research as overall measure of vehicle travel demand. Distances for each of the vehicle trips taken were derived through a shortest time-path modelling assignment for the reported trips in the 1999 Puget Sound Transportation Survey. Trips were assigned to routes in the transportation network to minimise travel time between destinations when taking into account levels of congestion for the time of day and direction of travel for each trip. Miles of travel were subsequently divided by the number of passengers in the vehicle to avoid overcounting for trips reported by multiple household members. We were unable to find an available similar household travel survey across the Baltimore–Washington DC area that had adequate sample sizes within census block groups and contained non-work travel information.
Applying the walkability index
The walkability index and census-based demographic data were applied to select neighbourhoods to study within the NQLS. The intent was to maximise variation in walkability and income of selected neighbourhoods so the separate and combined associations of these variables with physical activity and other outcomes could be evaluated as accurately as possible. In the first step, block groups in King County, Washington and five counties in the Baltimore—Washington, DC region were ranked and divided into deciles based on the normalised walkability index within each region. The top four and bottom four deciles, and corresponding ranges in walkability (represented as “high walkability” and “low walkability” areas), are shown for both regions in table 1. The fifth and sixth deciles were omitted from the analysis to create a separation between low and higher walk environments. Deciles are presented from lowest to highest.
King County and Baltimore–Washington walkability deciles based on z-scores
Similarly, the median household income data for each block group were deciled and categorised into “high income” and “low income”. Household income values less than $15 000 and greater than $150 000 were not included in this process in order to avoid income outliers. The second, third and fourth deciles constituted the “low income” category, and the seventh, eighth and ninth deciles made up the “high income” category. Again, the fifth and sixth deciles were omitted to create a separation between low income and high income neighbourhoods. Table 2 shows the corresponding range in income associated with each decile for King County and Baltimore–Washington. Deciles are presented from lowest to highest.
King County and Baltimore–Washington income deciles
The “walkability” and income characteristics of each block group were crossed with each other to produce a list of block groups that fit into one of four quadrants (high walkability and high income, high walkability and low income, low walkability and high income, low walkability and low income). Numerous block groups were included in each of the 4 categories, which meant that additional factors needed to be considered in choosing the 16 neighbourhoods, 4 in each quadrant, in each region. For example, out of 2366 block groups in the Baltimore–Washington dataset, there were 127 in the low walk, low income quadrant, 401 in the low walk, high income quadrant, 339 in the high walk, low income quadrant and 113 in the high walk, high income quadrant. Thus, to select possible candidates for inclusion in the study, the highest of the high walkability block groups and the lowest of the low walkability block groups were screened. These areas were mapped to determine if there were clusters of adjacent block groups that could reasonably be defined as a neighbourhood with a sufficient population size for recruitment. Additionally, a geographic distribution of neighbourhoods was desired to enhance diversity of racial and ethnic composition, access to transit, school systems, housing stock and regional accessibility to employment. When several clusters were identified that met the above characteristics, these block groups were flagged as the first choice targets for site visits.
Field verification
Site visits were made to both regions to field verify the data due to the novelty of the methodology and the critical nature of the neighbourhood selection to the design of the study. Site visits were made by informal windshield observations by the NQLS investigative team. Characteristics of urban form such as the presence of sidewalks, types of retail (strip or main street), housing stock, construction and mix of single family and multifamily housing, to name a few, were inspected for each area. Personal inspections were critical because an area could have a connected road network and be classified as high walk, but generate little foot traffic due to a lack of sidewalks, heavy congestion, truck traffic, poor lighting, vacant parcels, incivilities such as trash and graffiti, or other factors. Site visits were generally conducted to find the optimal representatives within the high walkable and low walkable communities, rather than to distinguish between high and low walkable communities.
An example of the importance of site visits was seen in Baltimore–Washington, DC Region concerning the size and type of retail parcels. Since the original parcel data used in this region for community selection was largely comprised of centroids, or points to mark the middle of the parcel, it was difficult to determine whether the centroid represented a few larger stores or several smaller stores colocated on a single parcel (such as a strip commercial centre). This distinction could affect calculations of the distances to destinations and the relative utility of active versus sedentary forms of transport.31
Enhancing demographic diversity
Census block group information such as race and ethnicity, median age and education was a very important consideration in the neighbourhood selection process. Race and ethnicity data were used to ensure that diversity was achieved among neighbourhoods in the same quadrant. For example, the four King County neighbourhoods in the high walk, low income group included Auburn, which was comprised of 84.5% White, 1.9% Black and 3.0% Asian residents. Beacon Hill, by contrast, had 27.9% White, 8.5% Black and 48.2% Asian residents. Census median age and education were used to select neighbourhoods within the high and low walkability quadrants that were comparable on these demographic variables known to be related to physical activity.
Final neighbourhood selection
During the field verification process some block groups were added to or deleted from neighbourhoods to improve their adherence to actual boundaries of a community, and based on their adherence with the quadrant definition (eg, walkability and income level). After the site visits, spreadsheets were created with the most relevant urban form and demographic data for each candidate neighbourhood.
Defining “neighbourhoods” based on census block group boundaries, which often follow major roadways or “main streets” and tend to divide rather than capture entire neighbourhoods, presented a challenge. Therefore, block group combinations were selected that approximated real neighbourhoods; otherwise variations in urban form within neighbourhoods can affect travel behaviour and activity choices. Neighbourhood definition was especially problematic in low walk, high income areas that were typified by large residential parcels and unconnected roads, and often did not have a commercial core. Parcel data used for the study also presented some challenges that impacted neighbourhood selection. For example, if the parcel data did not include different codes for large and neighbourhood retail, it was impossible to determine, without visual inspection, whether a parcel represented one large store or a collection of smaller stores under the same ownership. These two types of retail arrangements often have different parking and access features that may affect a person's ability to walk instead of drive.
Results
Census journey to work
The percentage of residents from the higher income neighbourhoods who walked to work was 4% higher in the high walkability neighbourhoods in King County and 6% higher in the high walkability neighbourhoods in Baltimore when compared with low walkability, high income neighbourhoods in each region. The corresponding analyses from lower income communities were similar. The percentage of residents from the lower income communities who walked to work was 7% higher in the high walkability neighbourhoods in King County and 4% higher in the high walkability neighbourhoods in Baltimore compared with low walkability, low income neighbourhoods.
Seattle–King County household Travel Survey Validation
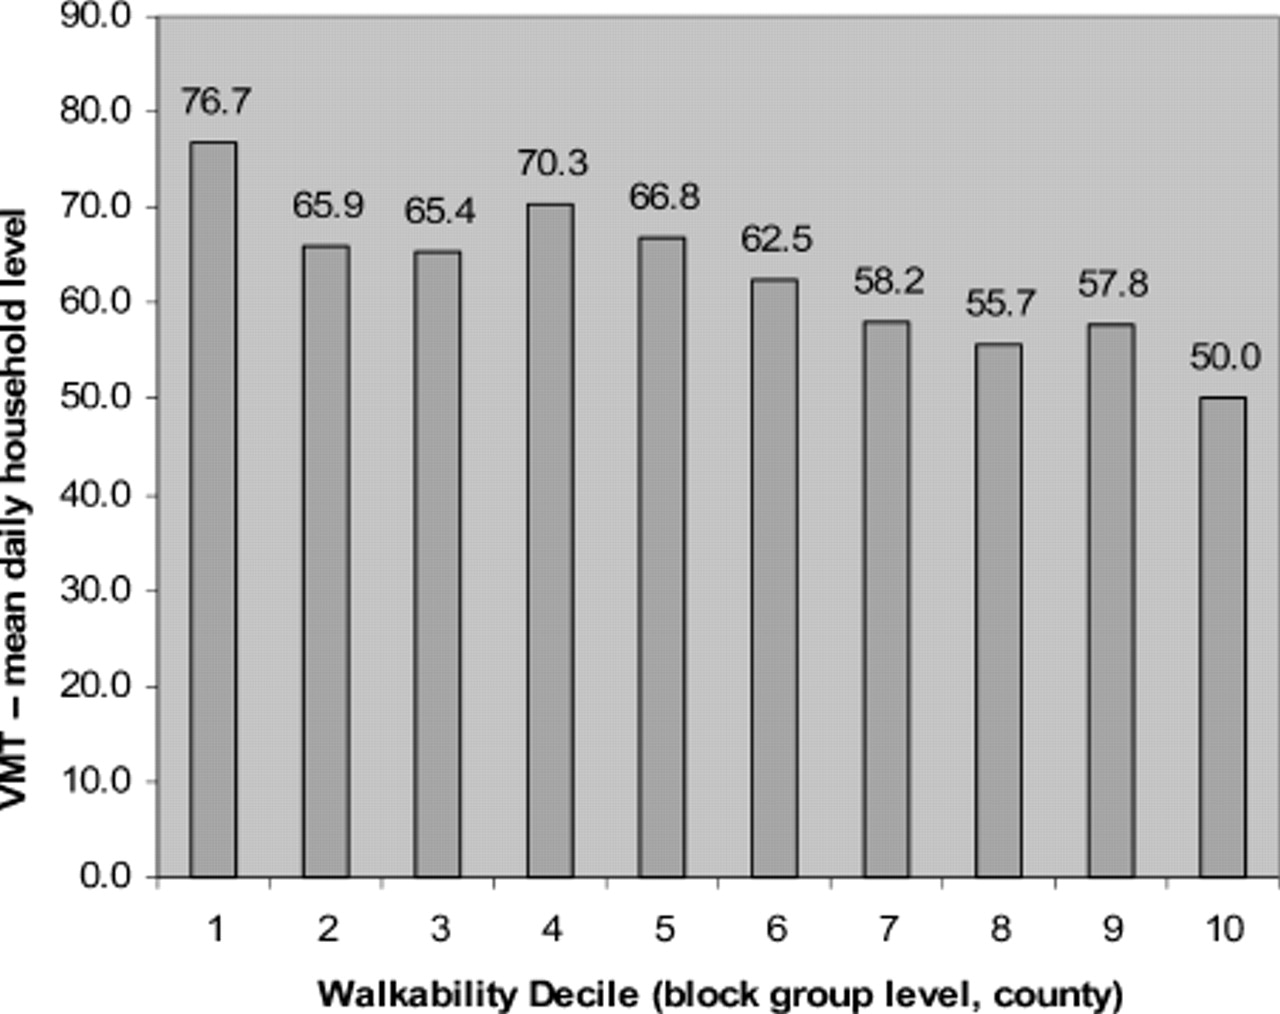
The number of walking trips and vehicle miles travelled reported per household per day were associated with the mean value of walkability that corresponded with the walkability index decile in which their census block group was located. A one-way analysis of covariance (ANCOVA) controlling for household size, total number of vehicles and income found statistically significant differences for walking trips (F = 18.02; p<0.01) and vehicle miles travelled (F = 6.67; p<0.01). Figure 3 demonstrates the incremental increases in self-reported walking trips per day for all trip purposes with associated increases in walkability. Trip distances for each of the trips taken by each household member were summed to the household level and the results by walkability decile are shown in fig 4.

Household no. of walking trips by walkability deciles.

Household vehicle miles travelled by walkability deciles.
A total of 16 neighbourhoods were selected in the King County, Washington and 16 in the Baltimore–Washington, DC regions for the NQLS and their associated block groups and relative locations are shown in figs 5 and 6.
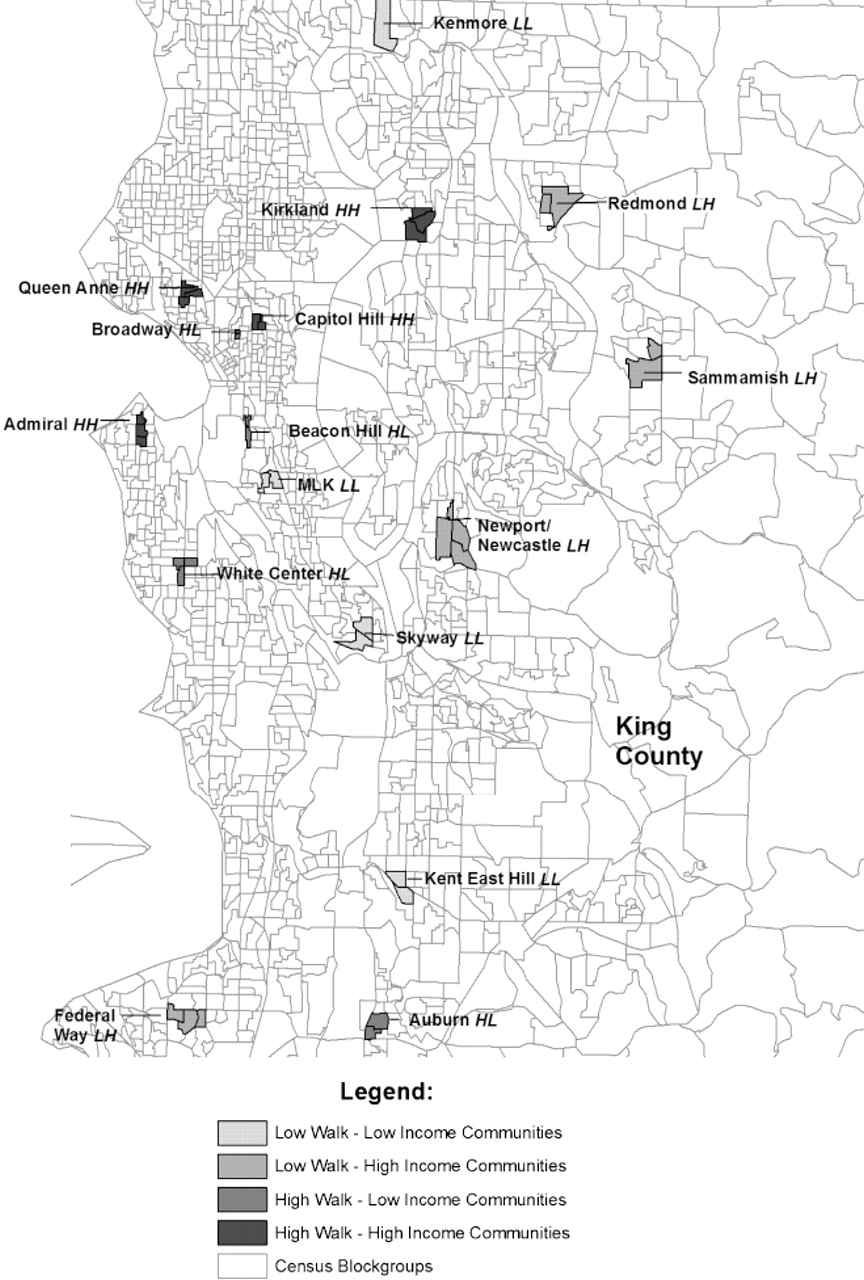
Map of the 16 King County neighbourhoods.

Map of the 16 Baltimore–Washington metropolitan region selected neighbourhoods and walk and income deciles.
Individual component values for the variables that constituted the walkability index of the selected neighbourhoods are provided for the King County and Baltimore–Washington regions in tables 3 and 4.
Descriptive statistics of King County neighbourhoods selected for the NQLS
Descriptive statistics of Baltimore–Washington region neighbourhoods selected for the NQLS
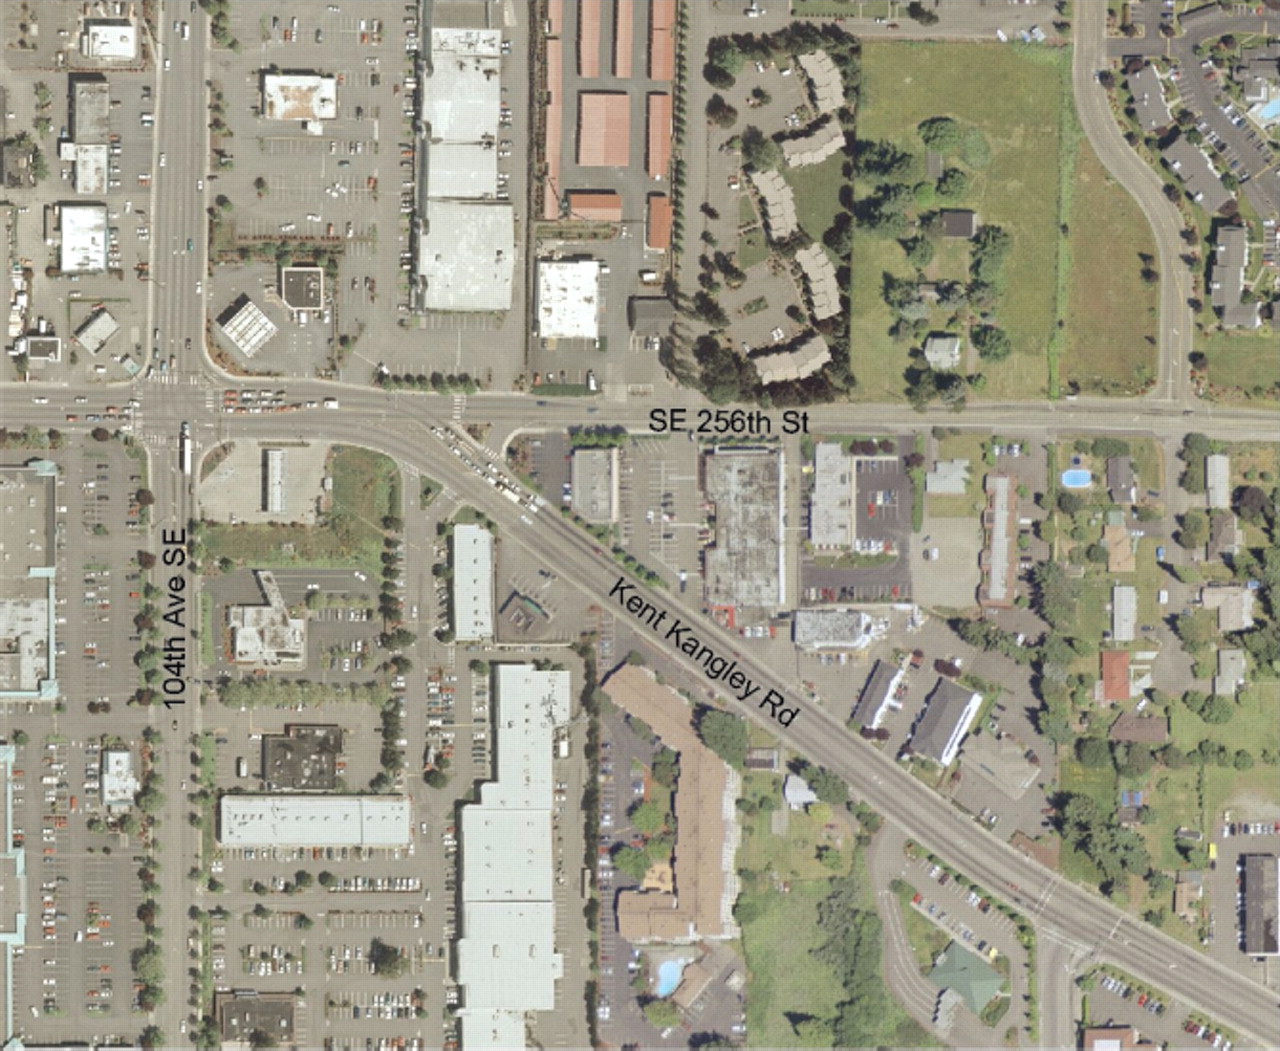
Table 3 highlights some variation in the walkability scores within each quadrant. For example, Kent East Hill was a low walk, low income neighbourhood; however it had a relatively high walkability score (walkability = 0.33) compared with Kenmore (walkability = −1.74). Kent has a strong commercial core in close proximity to multi family housing, which increased its walkability score. However, the area has a super-block road network (ie, relatively low intersection density) and vast areas of surface parking, which was shown by the low FAR retail value (z = −0.03). The Kent East Hill community, shown in fig 7 has several state routes passing through its core designed to accommodate the through movement of vehicles and has large building setbacks. Thus, Kent was judged to be a good example of a low walkable neighbourhood.

Kent East Hill.
Capitol Hill/Broadway, a high walk, low income neighbourhood, had the highest walkability score (walkability score = 9.2), due to strong values for all of the four walkability factors, a particularly high intersection density value (z = 2.24) that was weighted more heavily, and residential density (z = 1.6). On average, there are nearly 160 dwelling units per residential acre in this community. The most walkable high income neighbourhood in the King County region was the Admiral District (walkability score = 4.27) with fairly high values for each of the four walkability variables and in particular a good score for mixed use (z = 1.44) and the FAR for retail (z = 1.30).
Descriptive statistics are presented for the Baltimore neighbourhoods in table 4. The walkability scores within the Baltimore–Washington region convey less variability within and between quadrants than was found in the Seattle region. The most walkable community was Federal Hill, located just north of the city centre with a walkability score of 3.41. Waverly, a high walk, low income community, is shown in fig 8 with ground level retail, residential above and on-street parking.

Greenmount Avenue in Waverly.
There are some similarities in the spatial distribution of communities by quadrant for the two study regions. The high walk, high income communities were older urban core areas, often to the north or west, and upwind of the nearest central business district. The high walk, low income communities were somewhat less central, more randomly scattered and also found in older urban core areas, and often adjacent to highways or rail yards and industrial land uses. Low walk, high income communities were towards the periphery of both regions. Low walk, low income areas were the most randomly scattered in each region and were found near industrial, manufacturing and warehousing districts.
Discussion
Patterns of land use have been linked with a wide variety of health and environmental consequences. In particular, low density development with separate uses has been associated with traffic congestion, air pollution, physical inactivity, and risk of hypertension and overweight.3 17 Improvements in the measurement of land use could contribute to advances in research in health, transportation, and behavioural and social science disciplines. Because there are socioeconomic and racial/ethnic disparities in most health outcomes related to land use,31,–,33 it is important to understand the health effects of environmental variables in diverse populations. The purpose of the present article was to develop, test and apply a method of neighbourhood selection for environment and health studies combining walkability and sociodemographic factors.
The walkability index presented here was designed to be related to travel choice. Using census data from two regions of the US, people in high walkability, high income and high walkability, low income neighbourhoods walked to work more often than those in low walkability neighbourhoods. In a second test using 2-day travel diaries from King County, Washington, the number of reported walking trips was found to be 6.45 times greater and household vehicle miles travelled was 52% lower in the highest compared to lowest decile of walkability. Thus, the construct validity of the four-component walkability index was strongly supported. The pattern of more walking in high-walkability neighbourhoods provides initial support for the validity of the walkability index. The replication of very similar patterns across two regions of the country increases confidence in applicability of the walkability index to other regions.
The walkability index was used in the selection of neighbourhoods for a study of built environment and physical activity, and the diversity of the selected neighbourhoods was documented in two regions of the US. Building a walkability surface at the census block group scale across a given region or study area can then be used for multiple applications. The index can be used to investigate associations between urban form and a wide range of outcomes, to identify priority areas for transportation enhancements and redevelopment and to monitor changes in urban form over time. Although the utility and validity of the walkability index was supported, and it appears to be applicable to a broad range of research and policy applications, further development and evaluation is warranted.
This paper provides an overview of the NQLS. The NQLS was jointly designed by planners and health researchers to examine associations between the built environment and physical activity. Increased collaboration between planners and public health professionals is needed to devise methods to increase population levels of physical activity.4 12 Low levels of physical activity increase the risk of a variety of adverse health conditions and are responsible for at least 200 000 deaths per year in the USA34 so this is an important public health priority. It is widely believed that major societal trends, in particular the dominance of automobile-oriented land development patterns over the past several decades and the associated decline in walking for transportation, contribute to the low levels of physical activity.3 17 18 Though there is substantial evidence to support a conclusion that people walk and cycle less for transportation in low-density, single-use suburban neighbourhoods,8 13 17 few studies to date have examined total physical activity, investigated sociodemographically diverse samples, or measured variables with the quality and detail needed to provide guidance to urban planners, urban designers, landscape architects and developers about how to build more activity-friendly communities. The NQLS fills these and other important gaps in the literature and it investigates the relation of urban form to a variety of other health-related outcomes that have been proposed but seldom investigated.16 19 28
There are many opportunities to build on the current NQLS study. One priority is the assessment of older adults in the same NQLS neighbourhoods. Because international trends in land development, physical activity and obesity prevalence apparently are becoming more similar to the US.35 it is important to conduct parallel studies in other countries. In collaboration with the NQLS team, researchers from the University of Queensland in Australia are employing the methods presented in this paper with funding from the National Health Medical Research Council. A total of 32 neighbourhoods in Adelaide, South Australia were selected using these methods as part of the Physical Activity in Localities and Community Environments (PLACE) and comparative analyses with the current study (NQLS) are underway. The Australian study provides the first basis for cross-cultural validating of the approach to community selection presented in this paper.
The NQLS demonstrates the importance of transdisciplinary teams who by working together have a unique capability to conceptualise innovative research questions, methods and interpretation of outcomes.4 12 36 The study required input from urban planning, behavioural science and public health professionals. This project could not have been conceived or implemented within any single field, yet may contribute to advancements in science and practice in several fields. By working across disciplines, it is possible for transportation, health and environmental sectors to leverage each other's fiscal and political resources. This synergy across disciplines can lead to a greater understanding of the health, environmental and quality of life impacts of transportation investments and land use decisions.
References
Footnotes
-
Funding This work was funded in part by National Institutes of Health grant HL67350.
-
Competing interests None declared.
Surveys and related documentation on the NQLS study are available for download from http://www.nqls.org.
-
Provenance and Peer review Not commissioned; not externally peer reviewed.