Article Text

Abstract
Objective It is purported that exercise-induced dehydration (EID), especially if ≥ 2% bodyweight, impairs endurance performance (EP). Field research shows that athletes can achieve outstanding EP while dehydrated > 2% bodyweight. Using the meta-analytic procedure, this study compared the findings of laboratory-based studies that examined the impact of EID upon EP using either ecologically valid (EV) (time-trial exercise) or non-ecologically valid (NEV) (clamped-intensity exercise) exercise protocols.
Methods EP outcomes were put on the same scale and represent % changes in power output between euhydrated and dehydrated exercise tests. Random-effects model meta-regressions and weighted mean effect summaries, mixed-effects model analogue to the ANOVAs and magnitude-based effect statistics were used to delineate treatment effects.
Main results Fifteen research articles were included, producing 28 effect estimates, representing 122 subjects. Compared with euhydration, EID increased (0.09±2.60%, (p=0.9)) EP under time-trial exercise conditions, whereas it reduced it (1.91±1.53%, (p<0.05)) with NEV exercise protocols. Only with NEV exercise protocols did EID ≥ 2% body weight impair EP (p=0.03).
Conclusions Evidence indicates that (1) EID ≤ 4% bodyweight is very unlikely to impair EP under real-world exercise conditions (time-trial type exercise) and; (2) under situations of fixed-exercise intensity, which may have some relevance for military and occupational settings, EID ≥ 2% bodyweight is associated with a reduction in endurance capacity. The 2% bodyweight loss rule has been established from findings of studies using NEV exercise protocols and does not apply to out-of-doors exercise conditions. Athletes are therefore encouraged to drink according to thirst during exercise.
Statistics from Altmetric.com
Introduction
Today's well-accepted notion that exercise-induced dehydration (EID) ≥ 2% bodyweight impairs endurance performance (EP) has been developed in 2003 by Cheuvront et al1 from the United State Army Research Institute of Environmental Medicine and is endorsed by the American College of Sports Medicine,2 the International Olympic Committee,3 the American Dietetic Association4 and the Dietitians of Canada.4 Cheuvront et al's1 conclusion has been reached using the traditional narrative review method with a vote counting procedure, a scientifically invalid method to determine intervention effect.5 Moreover, the narrative review has no rigorous mechanism to determine whether a treatment effect is consistent across studies.6
The recommendation to limit dehydration to 2% bodyweight during exercise is based from results of studies that used exercise protocols where athletes were forced to exercise at fixed-work rates until exhaustion or at least during part of the exercise protocols.7 These research designs have a poor reliability8 or possess a very low ecological validity,9 thereby suggesting that they should not be used in the establishment of fluid intake guidelines, especially those designed for athletes.
In fact, several studies have shown that athletes' exercise intensity during racing conditions never remains constant but rather constantly varies throughout either on a macro- or micro-scale.10,–,13 There is no sporting event where athletes are required to exercise until exhaustion. Finally, optimal endurance performance can only be achieved when the knowledge of the distance or time to be completed during an exercise bout is known.14
Using a meta-analytic approach, Goulet7 has recently demonstrated that EID of up to 4% bodyweight improves, albeit non-significantly, EP during cycling time-trial type exercise. Moreover, this study demonstrated that drinking to thirst significantly improves EP, compared with drinking below thirst sensation. Interestingly, drinking ahead of thirst did not provide any significant performance advantage, compared with drinking to the dictates of thirst. These findings, deriving from laboratory-based studies, are in line with those observed in several field studies demonstrating that EID correlates with superior EP in marathon runners,15 ultra-marathon runners16 and long-distance triathletes.17 Since Goulet's7 findings derive from ecologically valid exercise protocols, they therefore represent the best available evidence yet regarding the impact of EID upon EP.
Whether or not the 2% bodyweight loss rule is real or an artefact has never been tested using rigorous statistical procedures. Moreover, unlike that observed during time-trial exercise conditions, the magnitude of the effect of EID during non-ecologically valid (NEV) exercise protocols (clamped-intensity conditions) has never been established. Finally, there is a need to resolve the question of whether or not the impact of EID upon EP differs between ecologically valid (EV) (time-trial exercise) and NEV exercise protocols.
Using a meta-analytical approach, this study determined and contrasted the magnitude of the effect of EID upon EP for studies that used EV and NEV exercise protocols. Findings clearly highlight that only under NEV exercise scenarios does EID impair EP.
Methods
Search strategy
A thorough search of the literature using the PubMed and SPORTDiscus databases was performed. The MeSH headings used, alone or in combination, were: ‘dehydration and exercise’, ‘dehydration and endurance performance’, ‘dehydration and exercise performance’, ‘dehydration and exercise-endurance capacity’, ‘hypohydration and exercise’, ‘hypohydration and endurance performance’, ‘hypohydration and exercise performance’, ‘hypohydration and exercise-endurance capacity’, ‘hydration and exercise capacity’, ‘hydration and endurance performance’, ‘exercise-induced dehydration and endurance performance’ or ‘exercise and fluid balance’. The literature search was limited to English language citations. A manual search of the reference section of all articles found during the electronic search was performed. Three key published narrative reviews were manually searched.1 ,2 ,18 Case studies, published abstracts, conference proceedings, dissertations or manuscripts published in non-peer reviewed journals were not admissible. The last literature day search was performed on 10 December 2011.
Inclusion criteria
To be included, studies had to meet all of the following criteria: 1) laboratory-controlled; 2) EID induced during, not before exercise; 3) fluid replacement during exercise given orally; 4) data needed to calculate % change in power outputs, effect estimates, variances and EID levels reported; 5) if perfect euhydration maintained during exercise (ie, 0% bodyweight loss): minimum dehydration level set at ≥ 1% bodyweight loss; 6) if perfect euhydration not achieved during exercise (ie, different from 0% bodyweight loss): A) euhydration considered when end-of-exercise bodyweight loss within ± 1% of starting exercise bodyweight; B) minimum EID level set at > 1% bodyweight loss and; C) difference in EID level between the dehydrated and euhydrated group ≥ 0.45% bodyweight; 7) same quantity of carbohydrate provided between exercise trials and; 8) EP assessed in compensable exercise-heat stress.
Data extraction
When necessary, authors were contacted to resolve ambiguities and issues with methodology or findings. Coded variables included: 1) study characteristics; 2) subject physical and fitness characteristics; 3) exercise protocol characteristics; 4) environmental condition characteristics; 5) pre and postexercise bodyweights and; 6) % changes in power output between experimental conditions.
Measurement of exercise duration
Exercise duration represents the mean total exercise time (min) completed in the euhydrated and dehydrated group.
Measurement of exercise intensity
Exercise intensity represents the mean relative maximal oxygen consumption ˙O2Max, at which the exercise protocols were conducted. A weighted average technique was used to determine exercise intensity of studies that combined multiple bouts of exercise conducted at different intensities.19,–,24
Measurement of dehydration level
Dehydration level is taken as the % change in bodyweight from pre to postexercise. It is acknowledged that the assessment of EID using changes in bodyweight lacks precision.25 However, under field conditions, it is the most practical and reliable method that can be used to estimate EID level.
Measurement of endurance performance
Time-trial type exercise protocol
Eighteen studies19 ,26,–,31 used time-trials to test EP, with all reporting mean maintained power output. Hence, in these studies, the % changes in EP were measured using the following formula:
% change in power output
Dehydrated group mean power output – euhydrated group mean power output/euhydrated group mean power output ×100.
Fixed-power output and incremental to exhaustion type of test
Seven studies used fixed-power output tests to exhaustion,20 ,22 ,24 ,32,–,34 whereas 3 utilised incremental tests to exhaustion21 ,23 to evaluate the impact of EID on EP. With respect to the study of Edwards et al,21 the accumulated number of meters ran during the YO-YO tests (running test to exhaustion) was converted to a running time to exhaustion. In this particular study, it was estimated that subjects started the incremental test to exhaustion at 89% ˙O2Max.35 For the study of Van Schuylenbergh et al,23 the change in peak power output was used to measure EP, which yields similar result to when using time to exhaustion. A negative % change in power output represents a negative effect of EID on EP, whereas a positive % change in power output represents a positive effect of EID on EP. According to Hopkins,36 a 1% change in power output equals a change of: (1) 1% in running time-trial speed or time and; (2) 0.4% in road cycling time-trial time. The % changes in power output were calculated using the following formulas:37 (1) Fixed-power output to exhaustion test: mean dehydrated group time to exhaustion – mean euhydrated group time to exhaustion/mean euhydrated group time to exhaustion ×100/(% ˙O2Max, at which the test was performed/6.4). (2) Incremental to exhaustion test: mean dehydrated group time to exhaustion – mean euhydrated group time to exhaustion/mean euhydrated group time to exhaustion ×100 (1- (% ˙O2Max, or peak power output at which the test started/100)).
Statistical analyses
Statistical analyses were performed with SPSS version 12.0.0. (Chicago, Illinois, USA), SPSS macros found in38 and with Comprehensive Meta-Analysis (CMA) version 2.2.048. (Englewood, NewJersey, USA). Unless otherwise noted, all data are reported as mean ± SD with statistical significance set at p≤0.05. The weight of each study consisted of the inverse variance for the net % change in power output.6 Variance was directly calculated from the reported Δ SE or SD of the net % change in power output. Missing variances were calculated from exact p values, or when not exactly reported, from p values equal to X, where X is any p value ≤0.05.39 When only p>0.05 was reported, individual variances for net % changes in power output were estimated as recommended by Higgins and Green.40 CI not including 0 was considered statistically significant.
Weighted mean effect summary
Weighted mean effect summary for EV and NEV exercise protocols was measured using random-effects model. For research articles that included more than one % change in power output, each outcome was treated independently. However, a separate statistical analysis was performed with only one effect estimate and weighting factor per research article to determine whether it would change outcomes. For EV research protocols,26,–,29 ,31 the qualitative interpretation of the effect of EID on EP under real-world conditions was determined using the spreadsheet developed by Hopkins et al.41 As those studies exclusively used cycling time-trials, the smallest worthwhile % change in power output was determined for cycling and set at 1.6% based on an average typical variation in competition time of 1.3%.42 The smallest worthwhile % change in power output was obtained by multiplying the variation in cycling competition time by 0.5,43 and then by transforming the threshold competition time to a threshold for cycling power output.37
Meta-regression and subgroup analysis
To determine the influence of moderating variables on the % changes in EP, mixed-effects analogue to the ANOVAS and random-effects meta-regressions were performed using a priori identified variables.
Evaluation of heterogeneity and publication bias
Between-study heterogeneity was assessed using the I2 statistic44 and the Cochran Q test, with p≤0.01 indicating significance.6 Publication bias was explored using funnel plot visual inspection and statistically tested with the Begg test, the Egger test and the classical fail and safe procedure.6
Results
Search result
A total of 19 manuscripts19,–,24 ,26,–,34 ,45,–,48 were first identified. Of these, 15 met the inclusion criteria.19,–,24 ,26,–,34 The investigation of Daries et al46 was excluded because a different amount of carbohydrate was administered between exercise trials, those of Barr et al45 and Mudambo et al48 because they were not specifically designed to measure EP and that of Fritzsche et al47 because it measured the effect of EID on maximal cycling power output, not EP.
Among the included research manuscripts, two individual studies were performed in Edwards et al,21 McConell et al,22 Below et al19 and Kay and Marino29 and 3,4 and 5 in McConnel et al,30 Backx et al27 and Dugas et al,28 respectively. Thus, the research yielded a total of 28 studies. Among those, 13 used EV exercise protocols,26,–,29 ,31 whereas 15 used NEV exercise protocols.19,–,24 ,30 ,32,–,34 A concise description of each study is presented in table 1.
Characteristics of the included research investigations
The 28 studies were published between 1989 and 2009, from 10 different peer-reviewed journals. One research investigation was published in the 1980s,34 seven between the years 1990 and 199919 ,22 ,24 ,30,–,33 and seven between the years 2000 and 2009.20 ,21 ,23 ,26,–,29 Four research investigations were performed in the United Kingdom,27 ,32,–,34 four in Australia,20 ,22 ,29 ,30 three in South Africa,24 ,28 ,31 two in the USA,19 ,26 one in New Zealand21 and one in Belgium.23
Description of subjects
A total of 122 subjects were represented in the 15 research manuscripts included in the current analysis. Mean sample size was 8.1±1.8 subjects, with men and women representing 91% and 9% of all subjects, respectively. Mean age, weight, height (N=27 studies) and relative ˙O2peak, (N=26 studies) of subjects was 25±3 years, 72±4 kg, 178±4 cm and 64±9 ml ⋅ kg−1 ⋅ min−1, respectively. There were no significant differences between EV and NEV exercise protocols for any of the aforementioned variables.
Exercise and endurance performance protocol characteristics
Non-ecologically valid exercise protocols
Three studies used a continuous, fixed-power output test to exhaustion conducted at the same relative exercise intensity throughout.32,–,34 A continuous exercise protocol where a first fixed-power output bout of exercise was followed by another one of higher intensity to evaluate the effect of EID upon EP was used by 4 studies.20 ,22 ,24 Five studies19 ,30 used a continuous exercise protocol where a first fixed-power output exercise period was followed by a second one where subjects performed the greatest amount of work possible in a given amount of time to determine the effect of EID on EP. Edwards et al21 used a discontinuous exercise protocol consisting of 1) a 45-min period of cycling at 90% ventilatory threshold; 2) a 45-min outdoor soccer game and; 3) a YO-YO test to evaluate the impact of the accumulated EID level upon EP. Van Schuylenbergh et al23 used a discontinuous exercise protocol consisting of 1) a 20-min warm-up period; 2) an ∼25-min long incremental test to exhaustion; 3) a 5-min recovery period; 4) a 120-min long exercise period; 4) a 5-min recovery period and; 5) an ∼25-min long incremental test to exhaustion to measure the impact of EID upon EP. Among the aforementioned studies, all used cycling exercise, with the exception of Fallowfield et al,32 who used running exercise and Edwards et al21 who combined cycling and running exercises.
Ecologically valid exercise protocols
Thirteen studies resorted to the use of cycling time-trial type exercise protocol to measure the effect of EID on EP. Dugas et al28 used an 80 km time-trial, whereas the remaining studies26 ,27 ,29 ,31 utilised a time-trial protocol where subjects had to cover the greatest possible distance in 60 min. The latter racing format is often used during ultra-marathon races and cycling criteriums. The most prestigious cycling record to hold, the hour-record, is the best example of such a racing format.
Environmental conditions, exercise intensity and exercise duration
The mean ambient temperature, relative humidity, exercise intensity and exercise duration observed during NEV exercise protocols was 24±4°C, 46±10%, 74±5% of ˙O2Max, and 91±34 min, respectively, whereas during EV exercise protocols it was 26±7°C, 61±9%, 68±14% of ˙O2peak, and 86±34 min, respectively. With the exception of relative humidity (p=0.001), there were no significant differences in any parameter between research designs.
Dehydration level
For NEV exercise protocols, the mean EID level of the dehydrated group was 2.14±0.62% bodyweight, whereas that of the euhydrated group was 0.48±0.32% bodyweight, for a mean difference in hydration level between groups of 1.65±0.64% (95% CI: 1.30 to 2.00%) bodyweight. Eight studies were completed with an EID level < 2% bodyweight, whereas 7 were terminated with an EID level ≥ 2% bodyweight. For EV exercise protocols, the mean EID level of the dehydrated group was 2.19±1.0% bodyweight, whereas that of the euhydrated group was 0.44±0.48% bodyweight, for a mean difference in hydration level of 1.74±1.01% (95% CI: 1.13 to 2.36%) bodyweight. Seven studies were completed with an EID level < 2% bodyweight, whereas 6 were terminated with an EID level ≥ 2% bodyweight. There was no statistically significant difference in the extent of EID between research designs.
Endurance performance
Weighted mean effect summary
Figure 1 presents the effect of EID on EP for EV exercise protocols, NEV exercise protocols and when all results are combined together. Mixing results of NEV and EV exercise protocols resulted in an EID-associated reduction in power output of 1.45±1.83% (95% CI: 0.77 to 2.13). It is nevertheless clear that the ‘deleterious’ effect of EID upon EP is driven by studies using NEV exercise protocols. In fact, with these research designs, EID reduced mean power output by 1.91±1.53% (95% CI: 1.14 to 2.67%), whereas with EV exercise protocols power output increased by 0.09±2.60% (95% CI: −1.33 to 1.50%), which is very unlikely to confer a performance advantage under real-world exercise conditions. When one mean effect estimate per research article was used, the decline in EP with EID reached 2.02±1.07% (95% CI: 1.35 to 2.68%) for NEV exercise protocols, whereas for EV exercise protocols EID increased EP by 1.41±2.46% (95% CI: −0.77 to 3.59).

Forest plot showing the effect of exercise-induced dehydration on the % changes in power output for ecologically valid and non-ecologically valid exercise protocols. ◊ represents the weighted mean effect summary. The overall weighted mean effect summary represents the magnitude of effect observed when all effect estimates are combined together. *Represents results of studies where subjects were dehydrated ≥ 2% bodyweight. Results are means ± 95% CI. References are provided on the right side of the figure and studies description can be found in table 1.
Meta-regression analysis
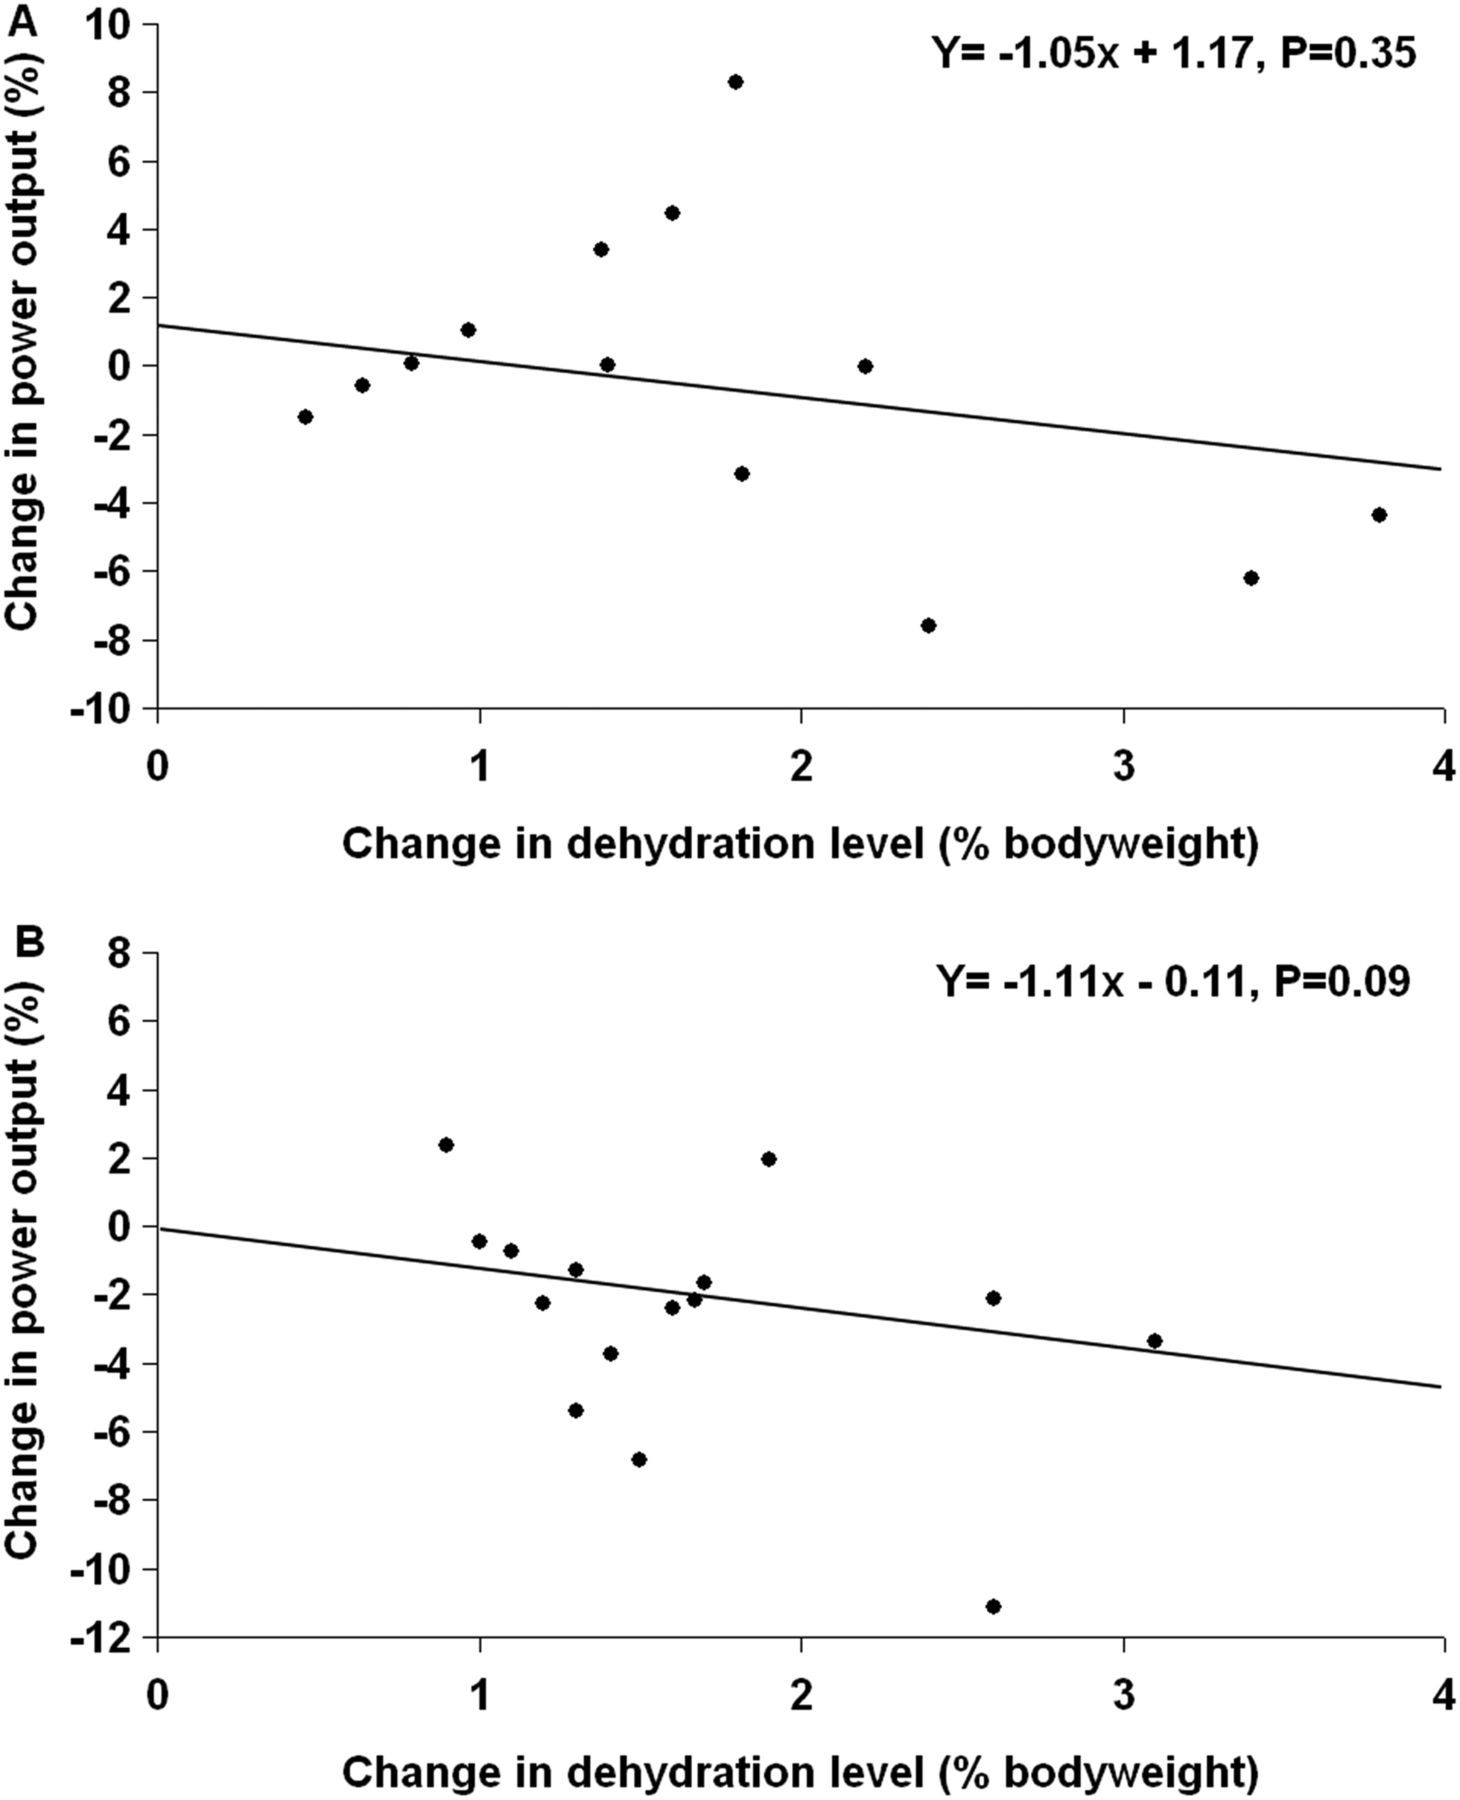
As can be observed in figure 2, there was no correlation between the changes in power output and the changes in EID level for both research designs (NEV exercise protocols: p=0.09; EV exercise protocols: p=0.35). Correlating the changes in power output with the end-of-exercise EID levels only decreased the strength of the relationship, as shown in figure 3. These non-significant relationships persisted even after controlling for the independent effect of exercise intensity, exercise duration, ambient temperature and relative humidity.

Correlation between the % changes in dehydration level and the % changes in power output for ecologically valid (A) and non-ecologically valid (B) exercise protocols.

Correlation between the end-of-exercise dehydration levels and the % changes in power output for ecologically valid (A) and non-ecologically valid (B) exercise protocols.
For NEV exercise protocols, there was no significant relationship between the changes in power output and exercise duration, exercise intensity, ambient temperature and relative humidity, whereas for EV exercise protocols the changes in EP correlated significantly with exercise intensity and exercise duration, but not with ambient temperature and relative humidity. When controlling for the independent effect of EID, the significant relationship between EP and exercise intensity and exercise duration still persisted.
Subgroup analysis
Impact of studies with EID level < 2% or ≥ 2% on EP
With EV exercise protocols, there was no significant (p=0.72) difference in EP between studies with EID level < 2% or ≥ 2% bodyweight (−0.13±2.43% (p=0.89), mean end-of-exercise dehydration level of 1.53±0.31% bodyweight vs 0.50±3.67% (p=0.74), mean end-of-exercise dehydration level of 2.95±0.94% bodyweight). However, this was not the case for NEV exercise protocols, where the decrease in EP was significantly (p=0.03) greater in studies with EID level ≥ 2% bodyweight than in studies with EID < 2% bodyweight (−1.07±1.53% (p=0.05), mean end-of-exercise dehydration level of 1.74±0.30% bodyweight vs −2.73±1.43% (p<0.01), mean end-of-exercise dehydration level of 2.60±0.59% bodyweight).
Sensitivity analysis
Sensitivity analysis demonstrated that the weighted mean effect summary for NEV and EV exercise protocols was consistent across studies and did not depend on any single effect estimate.
Heterogeneity
With respect to NEV exercise protocols, significant heterogeneity was observed across studies (Q=30.76, p<0.01), with an I2 value of 55% (moderate heterogeneity). With EV exercise protocols, results were homogenous (p=0.24), with an I2 value of 21% (low heterogeneity).
Publication bias
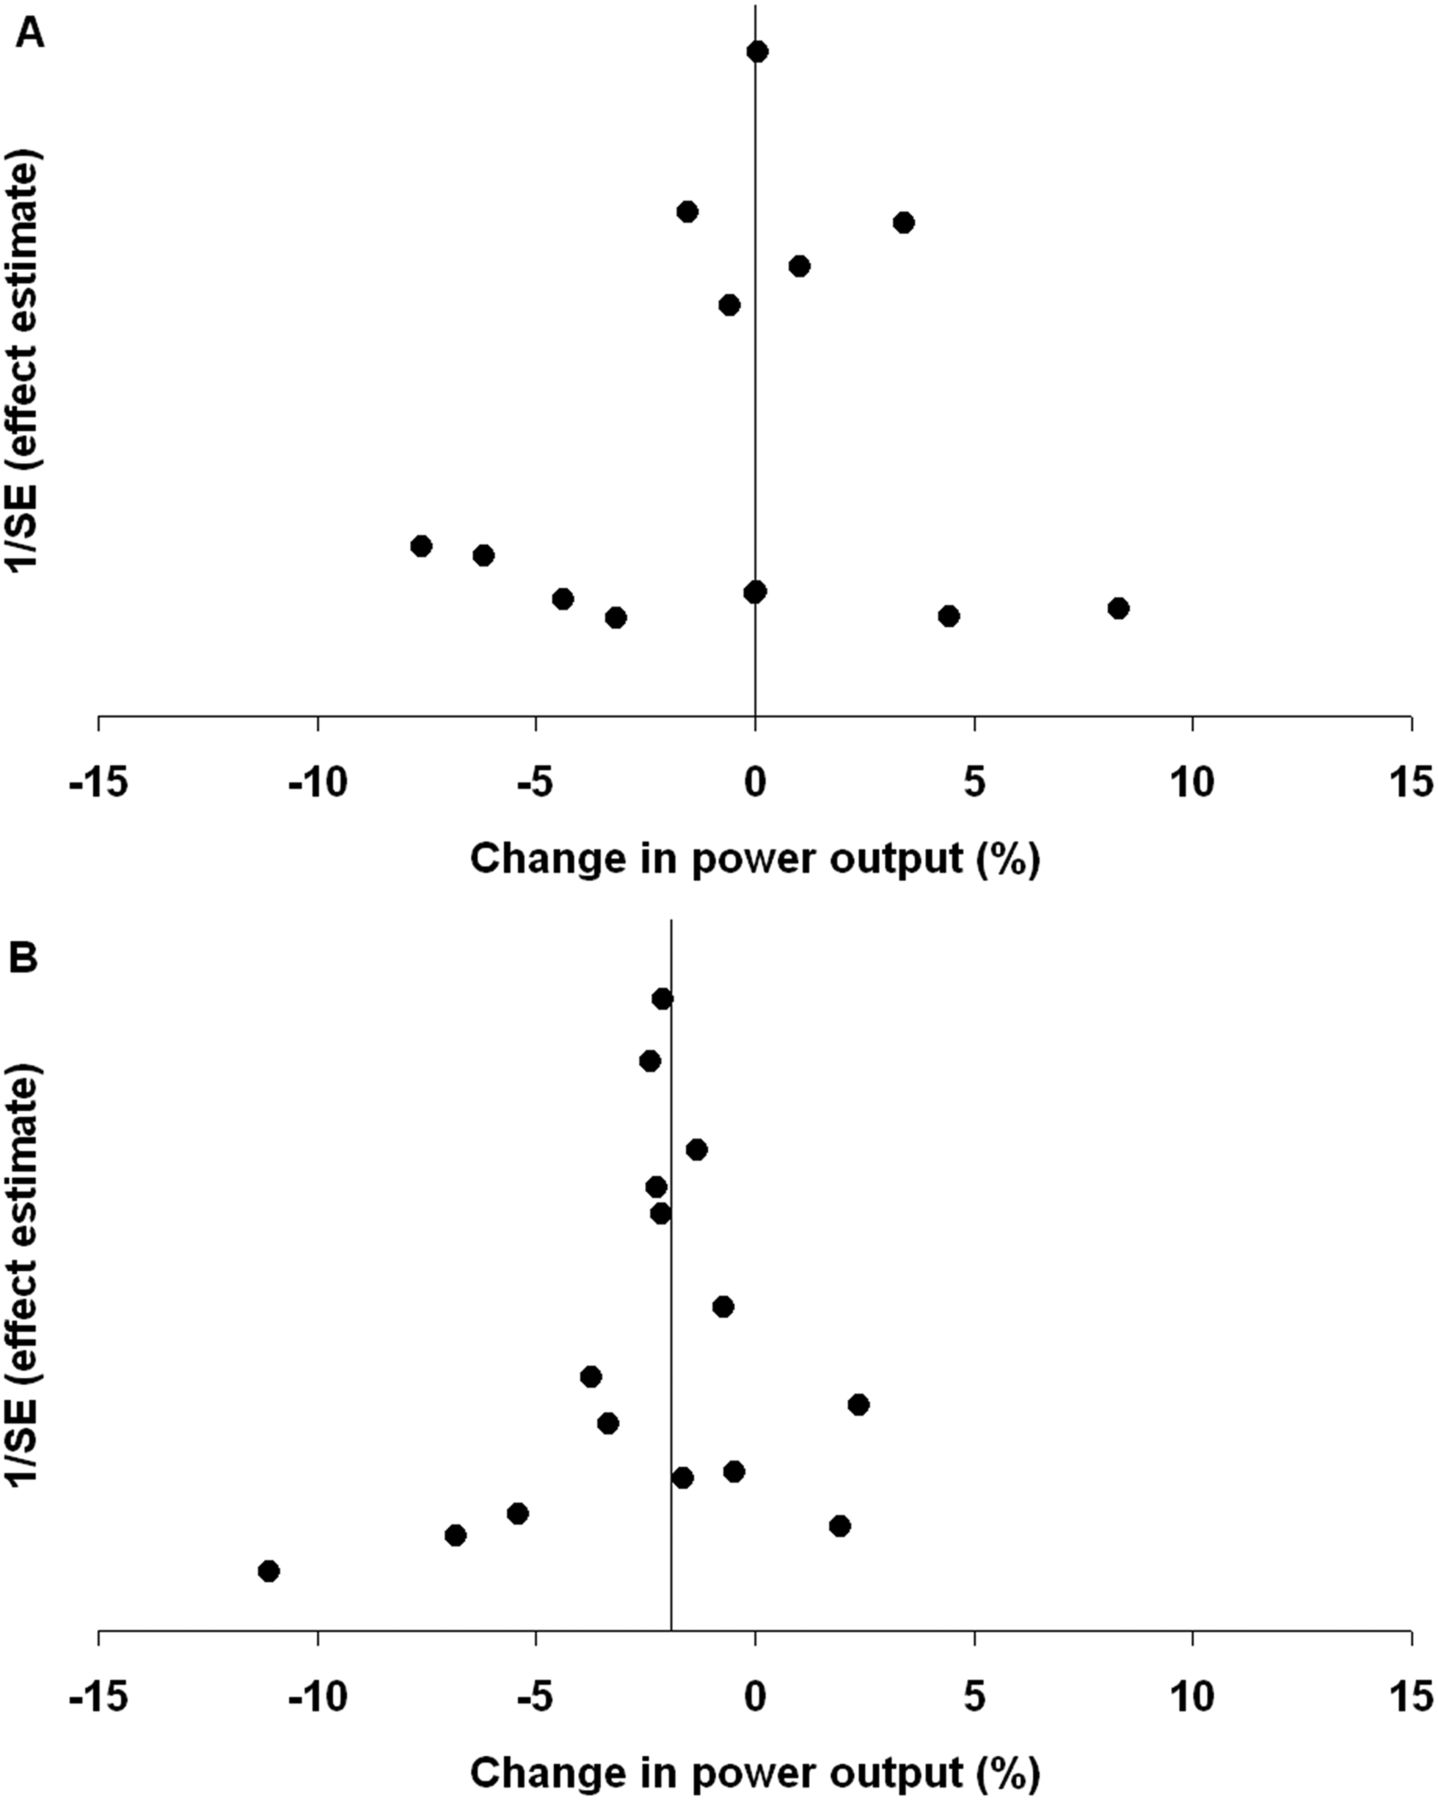
As observed in figure 4,visual inspection of the funnel plots suggests no publication bias for both NEV and EV exercise protocols. Additionally, rank-correlation test of Begg and Mazumbar as well as the Egger's test of the intercept were not significant. For NEV exercise protocols, 224 ‘null’ studies would need to be located in order for the combined 2-tailed p value to exceed 0.05.

Funnel plot of the relationship between the % changes in power output and the precision of the effect estimates (1/SE (standard error)) for ecologically valid (A) and non-ecologically valid (B) exercise protocols. The black lines represent the weighted mean effects.
Discussion
This meta-analysis demonstrated that: 1) EID ≤ 4% bodyweight does not impair EP during exercise emulating real-world exercise conditions; 2) during unrealistic exercise conditions, EID as low as 1.75% bodyweight is associated with a decrease in EP and; 3) during time-trial exercises, EID ≥ 2% bodyweight does not further degrade EP, compared with EID < 2% bodyweight. It is hoped that these findings will help improve athletes' racing and training hydration strategies in addition to contribute to the establishment of more refine, evidence-based, fluid intake guidelines.
It is clear from the present results that the effect of EID upon EP is research design-dependent, with dehydration of up to 4% bodyweight reducing EP only under exercise circumstances where intensity is clamped, but not during exercises where athletes can freely adjust intensity based on afferent physiological signals. In a recent editorial paper, Mündel9 pointed out that, although fixed-intensity exercise models are well-suited for understanding the physiological impact of EID, there is one area where they fall out of favour, and this is exercise performance. Moreover, he suggested that results deriving from fixed-intensity exercise models cannot be assumed to apply to the more realistic setting of self-paced competition. Findings from this meta-analysis support Mundel's9 assertions and demonstrate that the longstanding belief that EID impairs EP apparently does not apply to real-world, out-of-doors exercise conditions. Sadly, they also highlight the fact that athletes, coaches and health practitioners have for a long time been wrongly informed and educated about the real impact that EID has on EP.
Taken within the context that thirst represents the best means to gauge the need for fluid replacement during exercise,7 the fact that athletes have been misinformed about the true effect of EID on EP under real-world circumstances is not trivial and has important implication. More specifically, Goulet7 showed that the probability that drinking to thirst confers a real and meaningful advantage on EP compared with a rate of drinking above thirst sensation is of the order of 60%. Given that only few seconds often separate the first from the second and third place finishers, it is quite likely that the promotion of forced drinking has prevented some athletes under particular circumstances from achieving their optimal performance and winning races.
Data collected in the field are accumulating to suggest that the 2% bodyweight loss rule does not apply to real-world exercise circumstances, thereby supporting the present meta-analysis's findings. In marathon runners, Zouhal et al15 recently demonstrated a significant inverse relationship between the degree of bodyweight loss and race finishing time. Sharwood et al17 also observed a significant inverse relationship between Ironman-triathlon race finishing time and bodyweight loss. During a 24-h ultra-marathon race, Kao et al16 observed that runners with the highest loss of bodyweight ran the greatest distances. The top three finishers of the 1970 Commonwealth Games marathon completed the race with times below 2 h and 13 min, yet were dehydrated by 4% to 5% of their bodyweight.49 Very recently, Beis et al50 observed that the winner of the 2009 Dubai Marathon, Haile Gebrselassie, past marathon time world record holder, terminated the race with an amazing bodyweight loss of 9.8%. Although these observations cannot be interpreted to suggest that EID helps performance, they nevertheless cast doubts about the validity of the 2% bodyweight loss rule, while fortifying the idea that drinking to thirst is all that may be necessary to maximise EP.
Why EID degrades EP during NEV but not during EV exercise protocols is unclear? It is believed that during field exercises, where work rates can freely be manipulated by athletes, the brain must process enormous quantities of data from the environment and different physiological systems of the body. These data are used to calculate whether power output is appropriate for the distance still to be covered in the current environmental conditions, given the athlete's available fuel reserves, EID level and current rate of heat production. All of those computations are necessary to avoid catastrophic failure in any peripheral physiological system.14 Based on this line of reasoning, it is postulated that during fixed-intensity exercise conditions, where the body has no means to adjust to physiological insults, EID-associated impairment of EP could simply reflect the conscious perception of the body to prematurely stop exercising before a ‘’catastrophic'' failure develops. On the other hand, Atkinson et al51 suggested that during field-conditions the ‘selection’ of work rate is regulated specifically to ensure that factors that are classically implicated as causing fatigue during fixed-intensity conditions are instead regulated so that they do not adversely affect physiological variables before the end of exercise is reached.
Results from EV exercise protocols are associated with substantially wider CIs than those from studies using time-to-exhaustion type exercise protocols.20 ,22 ,24 ,32,–,34 This may appear paradoxical, since time-trial type exercise protocols are much more reliable than fixed-intensity exercise protocols,8 suggesting that the reverse should have been observed. I take this observation to raise the following question: for those who still doubt that the type of exercise protocol can influence the relationship between EID and EP outcome, then why unreliable, but not reliable exercise protocols, were capable of detecting an EID effect on EP? Notwithstanding the correct answer, one thing clearly emerges from the present findings; if EID has not been able to hinder EP during reliable exercise protocols emulating real-world exercise conditions under highly-controlled laboratory conditions, then the chances for it impairing EP under field conditions should be nearly non-existent. Moreover, it has been demonstrated by Zouhal et al15 and Sharwood et al17 that the changes in bodyweight during exercise explain only 4 to 5% of the variability in EP, thereby indicating that factors such as physical training, nutrition, pacing strategy and psychological preparation likely have more influence on performance than hydration.
Results of the present meta-analysis should be interpreted within the context of the following limitations of our knowledge. They apply only to male cyclists and strictly for exercise duration ≤ 150 min, ambient temperatures between 19.8 and 22.5°C and 29.3 to 33.2°C and for exercises incurring EID ≤ 4.3% bodyweight. Although EID does not appear to interact with ambient temperature to decrease EP under real-world exercise conditions,29 whether it interacts with relative humidity, exercise intensity and exercise duration is unknown.
This meta-analysis has some technical limitations that must be considered. First, the literature search was limited to English citations. Therefore, it is not impossible that studies published in other languages were missed. However, since no publication bias was observed for both NEV- and EV-derived studies, it is reasonable to indicate and believe that the present findings likely represent the entire literature on the topic. Second, due to the lack of information provided by some studies, in some instances individual variances for the net % changes in power output between trials could not be directly computed, but rather were estimated. However, this is unlikely to have had a significant impact on findings, since a key variable needed for the calculation of the variance estimations, the correlation coefficient, was imputed from the raw experimental results of 14 individual studies provided by 4 researchers.19 ,27 ,28 ,30 Finally, for studies that used NEV research designs, the changes in time-to-exhaustion during fixed-power output and incremental tests to exhaustion were converted to equivalent changes in power outputs during a time-trial, which may have introduced a small measurement error. However, the present author is unaware of any other techniques that could have been used to compare and combine findings of studies reporting such disparate and incompatible data as changes in power output and changes in time-to-exhaustion.
Conclusions
From the results of the present meta-analysis, the following conclusions are drawn: 1) the 2% bodyweight loss rule does not apply to real-world exercise events; 2) under real-world exercise conditions, EID of up to 4% bodyweight does not degrade EP; 3) during fixed-exercise intensity conditions, which may have some industrial and military relevance, EID as low as 1.75% is associated with a decrease in endurance capacity. Endurance athletes are encouraged to follow thirst-associated cues during exercise to determine the need for drinking. Future studies looking at the relationship between EP and EID should include a control group drinking to thirst and use research designs simulating as best as possible out-of-doors exercise conditions.
What this study adds
-
Results of the present investigation clearly show that only under exercise conditions comprising fixed-power output work does EID impairs EP
-
Because under real-life exercise conditions athletes can constantly adjust their speed according to body cues, drinking to thirst-associated EID of up to 4% is very unlikely to hinder EP.
Acknowledgments
The author reports no conflict of interest with any organizations and wishes to thank Drs. Karianne Backx, Edward Coyle, Jonathan Dugas and Glenn McConell for having shared raw experimental data.
References
Supplementary materials
Supplementary Data
This web only file has been produced by the BMJ Publishing Group from an electronic file supplied by the author(s) and has not been edited for content.
Files in this Data Supplement:
- Web Only Data - This web only file has been produced by the BMJ Publishing Group from an electronic file supplied by the author(s) and has not been edited for content.
- Web Only Data - This web only file has been produced by the BMJ Publishing Group from an electronic file supplied by the author(s) and has not been edited for content.
- Web Only Data - This web only file has been produced by the BMJ Publishing Group from an electronic file supplied by the author(s) and has not been edited for content.
Footnotes
-
Competing interests None.
-
Provenance and peer review Not commissioned; externally peer reviewed.
-
▸ References to this paper are available online at http://bjsm.bmj.com