Article Text

Abstract
Congenital long QT syndrome (LQTS) affects an estimated 1 in 2500 people and typically presents with syncope, seizures or sudden death. Whereas someone exhibiting marked prolongation of the QT interval with QTc exceeding 500 ms who was just externally defibrillated from torsades de pointes while swimming poses negligible diagnostic challenge as to the unequivocal probability of LQTS, the certainty is considerably less for the otherwise asymptomatic person who happens to host a QTc value coined “borderline” (QTc ⩾440 ms). Although a normal QT interval imparts a much lower risk of life-threatening events, it does not preclude a patient from nevertheless harbouring a potentially lethal LQTS-causing genetic mutation. Indeed, genetic testing exerts significant diagnostic, prognostic and therapeutic implications. However, the 12-lead ECG remains the universal initial diagnostic test in the evaluation of LQTS and is subject to miscalculation, misinterpretation and mishandling. This review discusses the components of accurate QTc measurement and diagnosis, re-examines what is known about factors affecting QT interval measurement, and clarifies current recommendations regarding diagnosis of so-called “borderline” QT interval prolongation. The current guideline recommendations for the athlete with LQTS are also summarised.
Statistics from Altmetric.com
Congenital long QT syndrome (LQTS) was first described clinically as Jervell and Lange-Nielsen syndrome and Romano Ward syndrome in the late 1950s and early 1960s.1 2 3 The trademark event for the symptomatic LQTS patient is the potentially lethal ventricular dysrhythmia called torsades de pointes.4 Torsades de pointes can precipitate syncope, seizures or sudden death, depending on whether the heart rhythm spontaneously reverts to normal rhythm or if the patient is defibrillated to normal rhythm before death occurs.5 6
LQTS affects an estimated 1 in 2500 people4 and is understood to be a collection of genetically distinct arrhythmogenic disorders resulting from genetic mutations in (primarily) cardiac potassium and sodium ion channels, termed “cardiac channelopathies”.7 Mutations in proteins associated with ion channels but not part of the channels themselves can also cause LQTS.8 9 Overall, 12 LQTS-susceptibility genes have been discovered thus far. Mutations in the potassium channel genes KCNQ1 (LQT1) and KCNH2 (LQT2) as well as the sodium channel gene SCN5A (LQT3) account for ∼75% of all cases of clinically definite LQTS and comprise over 95% of genetically identifiable LQTS.10 11 12 13
Diagnosing LQTS: the challenge
The diagnosis of LQTS continues to be difficult. Some physicians continue to use a published clinical diagnostic assessment score (table 1) that incorporates personal and family history as well as ECG findings to compute “low”, “intermediate” and “high” probabilities for the diagnosis of LQTS.14 Here, points are given for specific history components and findings on a 12-lead ECG, with a total score ⩾4 conveying a high probability of LQTS diagnosis. Points are awarded for QTc values exceeding 450 ms in males and 460 ms in females. A QTc value greater than 480 ms is worth 3 points.14
LQTS Clinical Probability Score (Schwartz Score)
Unfortunately, this simple tool conceals the inherent difficulties with diagnosing this disease where, for example, the clinical presentation can masquerade as epilepsy. Further, a significant component of the score, namely the ECG index of cardiac repolarisation known as the QTc, can be computed erroneously by the ECG system or miscalculated by the physician performing his/her independent calculation. In fact, Viskin et al15 demonstrated that the QTc was calculated incorrectly (when compared with LQTS experts) by one-third of heart rhythm specialists and by nearly three-quarters of cardiologists.
Even when the correct QTc value has been obtained, its diagnostic significance can be misinterpreted, particularly when the value triggers the infamous designation of “borderline QT prolongation” (ie, QTc ⩾440 ms). At present, nearly half of the patients seen at our institution for a second opinion of a previously rendered diagnosis of LQTS are departing without such a diagnosis.16 Here, the majority of diagnostic reversals stem from miscalculated QTc values or the premature assignment of an LQTS diagnosis in the setting of low clinical probability scenarios (negative personal and family history) but with a “borderline” QTc.16 17
Although the diagnosis may be relatively simple and readily apparent in a patient with a QTc persistently greater than 500 ms (especially if accompanied by typical LQTS-triggered cardiac events), primary care physicians and cardiologists are often confronted with patients diagnosed with “borderline” LQTS. These patients may or may not have an LQTS-specific history or complaint and have received an ECG for a variety of indications including screening pre-participation ECGs. The diagnosis of “borderline” QT prolongation or even “borderline LQTS” is commonly given when a patient has a QTc value between 440 and 470 ms.18 Within this range, however, there exists a significant “overlap zone”, an area in which it is not possible to decipher whether or not a patient truly has LQTS simply on the basis of an ECG (fig 1). Indeed, fully 15% of the general population may have a QTc in the “borderline range”.16 On the other hand, however, 25–35% of patients harbouring an LQTS-causing mutation have a QTc <440 ms and have been termed “silent carriers” or “concealed LQTS”.19 20 21 From this significant overlap, it is easy to appreciate why LQTS can be both overdiagnosed and underdiagnosed.

Distribution of QTc values for patients with and without long QT syndrome (LQTS). The “borderline” QTc level of 440 ms is shown with a solid line. Note the significant overlap between “normal” and QTc values of mutation-positive patients from Mayo’s LQTS Clinic. Also note that the average QTc value in normal postpubertal females is on average 10 ms longer than that of normal postpubertal males. Modified from Taggart et al16 with permission from the American Heart Association, copyright 2007.
Measurement of QTc: pitfalls and pointers
As mentioned above, central to the assessment of a 12-lead ECG is the ability to accurately measure the QTc. Computer-derived measurements are fraught with errors, particularly in patients with complex T-wave and U-wave arrangements.16 22 As such, physicians-in-training should be taught that the computer’s QTc cannot be relied upon when a diagnosis of LQTS is in question and, must be verified manually. Complicating this recommendation, however, is the sobering observation from Viskin et al15 on the ability of cardiologists to accurately conduct this independent verification.
The QT interval is defined as the time duration between the onset of the QRS complex and the end of the T wave as it returns to baseline (fig 2), ideally measured using either lead II or lead V5 of the 12-lead ECG. There are no standards for interpreting prolonged QT intervals from Holter or 24/48 h ambulatory monitoring records; the “normal” QTc distribution at 2:30 am, for example, is not known, and thus QTc assessment by ambulatory monitoring is not recommended at present to invoke a diagnosis of LQTS.16 Regarding the 12-lead ECG, “normal” QTc values are generally considered to be between 350 and 440 ms,18 23 but, as will be discussed in the next section, this consideration of QTc >440 ms as indicative of “borderline QT prolongation” has probably been responsible for the greatest number of premature LQTS diagnostic renderings than the intrinsic fragility in the computation of the QTc in the first place.
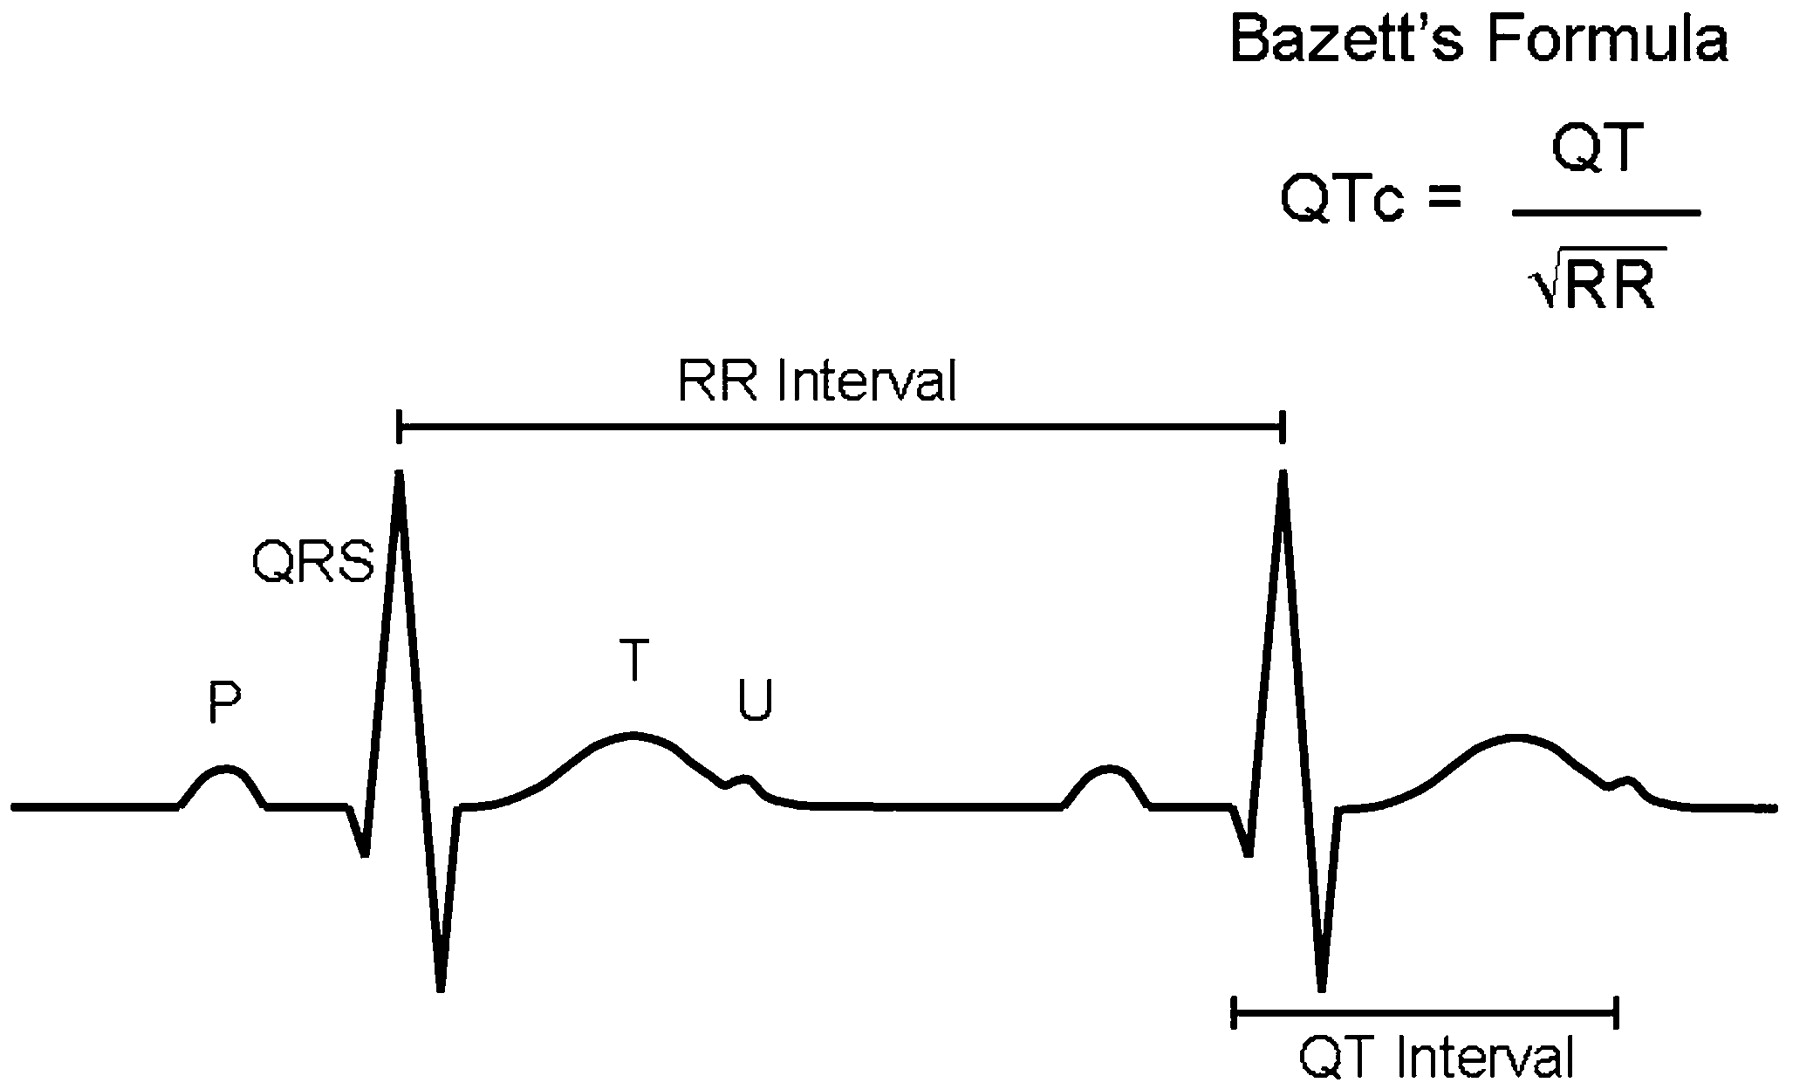
A diagrammatic representation of two cardiac cycles as recorded on an ECG. The RR and QT intervals are identified, along with a typical U wave that should not be included in the QTc calculation.
Numerous methodologies for correcting QT intervals for heart rate have been proposed,24 25 26 but the most universally utilised method is that described by Bazett in 1920.27 Bazett calculated the QTc as the QT interval divided by the square root of the preceding RR interval. At normal heart rates, this formula is clinically useful, but begins to underestimate and overestimate the duration of cardiac repolarisation at extreme low and high heart rates, respectively.17 In the presence of sinus arrhythmia, the interpreting physician should calculate an average QTc from analysis of the entire 12-lead ECG rhythm strip.28 Although Martin et al29 have proposed an alternative method in which the interpreter would apply Bazett’s formula to the QT interval following the shortest available RR interval, this is strongly discouraged as it will result in a marked inflation/overestimation of the QTc and lead to overdiagnosis. In contrast, using only the longest RR interval may underestimate the repolarisation index.
The U wave is a common ECG finding, especially among adolescents, that is often a source of consternation for physicians reading ECGs. Most LQTS specialists recommend that a U wave distinctly separate from and much smaller than the preceding T wave must be excluded from the QT interval measurement.23 Inclusion of such U waves can easily “inflate” the QTc by 80–200 ms and unnecessarily precipitate a diagnosis of LQTS.16
To avoid mistakes in measurement of atypical T waves, many specialists recommend a method where the end of the T wave is considered to be the intersection of the tangent to the steepest slope of the last limb of the T wave and the baseline (fig 3).22 30 This “teach-the-tangent”, or as we refer to it “avoid-the-tail” method, was taught to a cohort of 151 medical students, who achieved higher accuracy of diagnosis (77%) than previously described cohorts of non-cardiologists (21%), cardiologists (22%) and even electrophysiologists (62%).15 22 Importantly, the accuracy of diagnosis was 96% for cardiologists specialising in LQTS.15 22
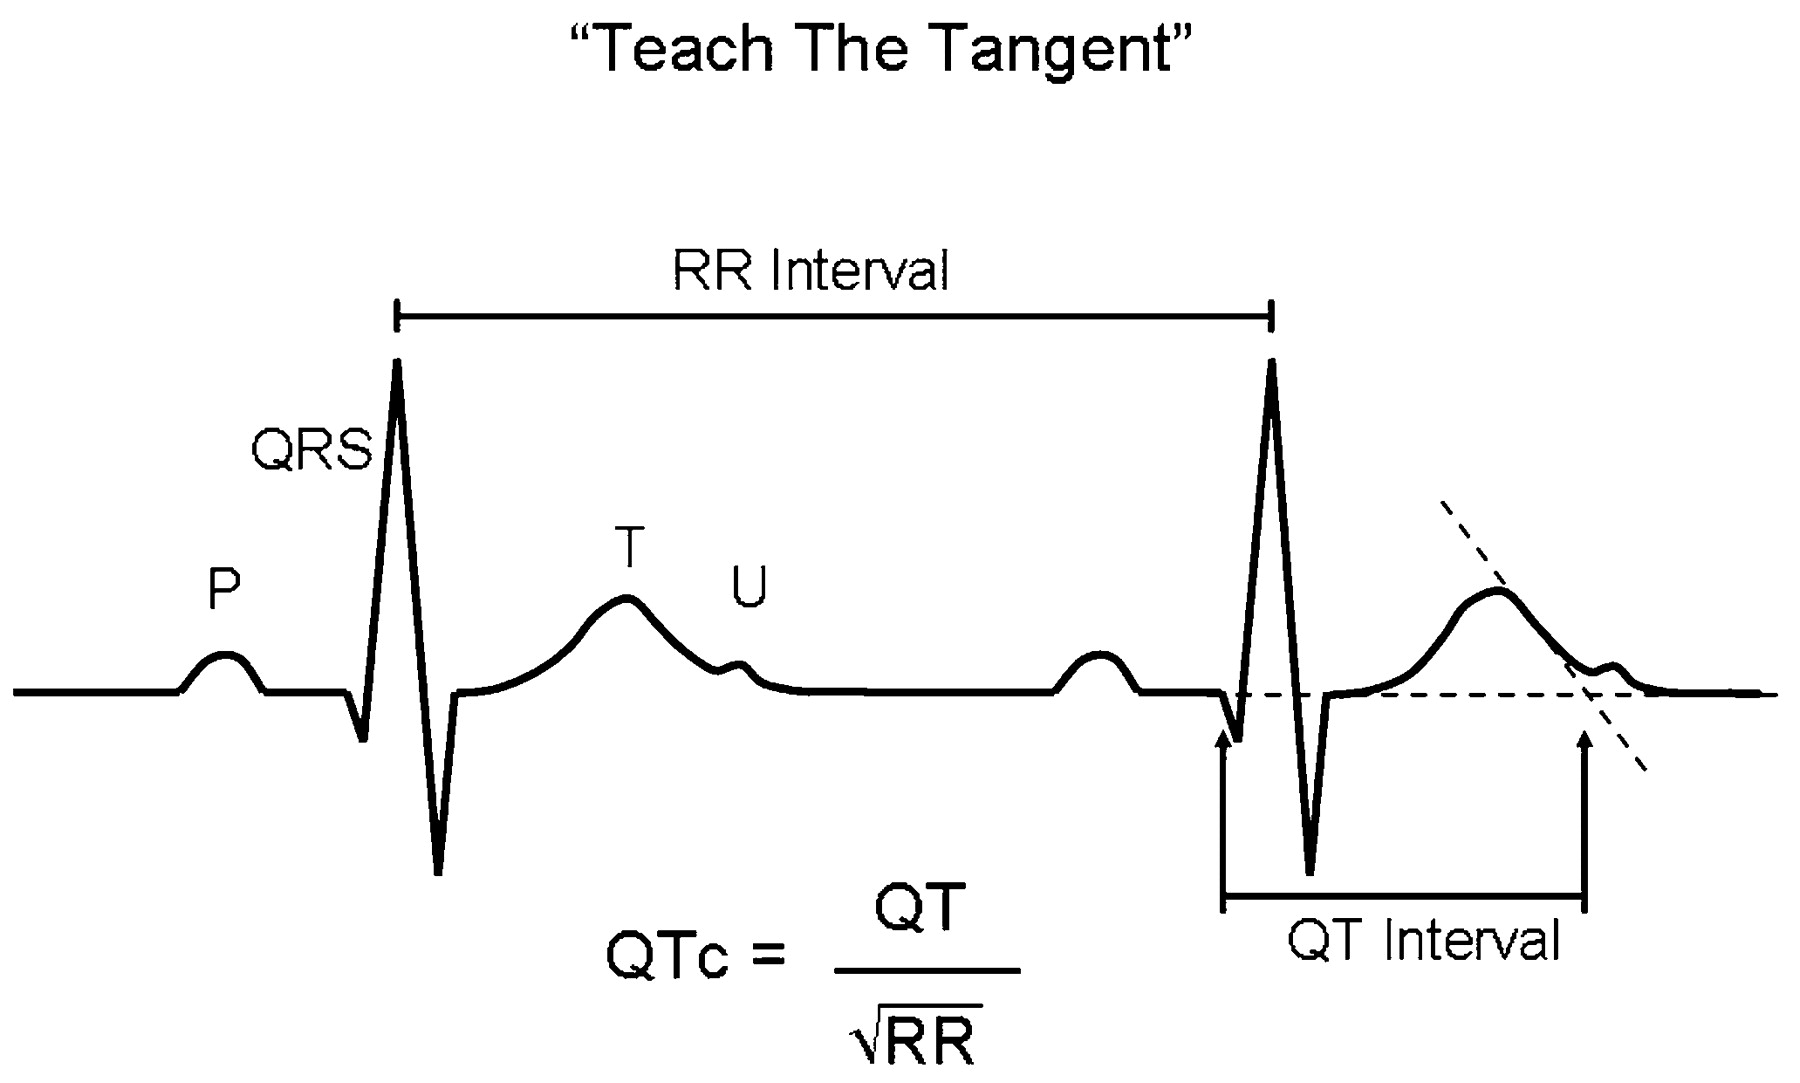
A repeat diagrammatic representation of two cardiac cycles as recorded on an ECG, with demonstration of the “teach-the-tangent” method of QTc measurement as described by Postema et al.22
Finally, one must keep in mind that the QTc is not the only finding available on the 12-lead ECG. Specific T-wave and ST-segment findings can give clues to the astute clinician as to the presence of pathological disease, particularly the presence of T-wave alternans or diffuse T-wave notching (fig 4).31 As such, the ECG must be examined critically for not only the length of the QT interval but also the look of the T-wave and T/U-wave morphologies.
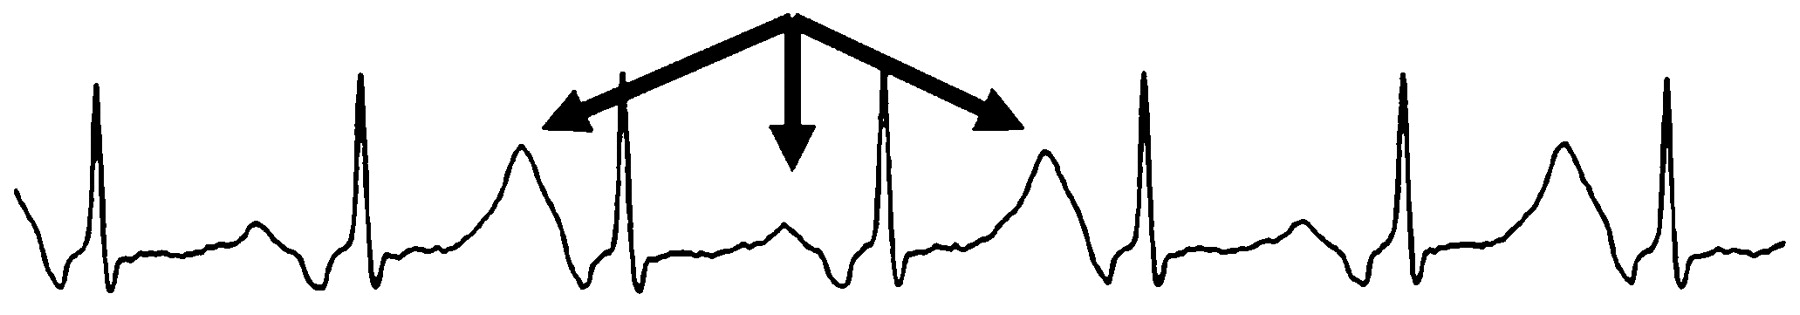
An ECG rhythm strip demonstrating significant macroscopic T-wave alternans. Note the alternating T-wave morphology and vector.
Confounders
The QT interval is a fluid measurement that is influenced by the physiological and metabolic state of the patient at the time of the ECG. Owing to multiple variables interacting at any given time, patients may have different QT intervals during subsequent ECG examinations. The full extent of personal variability of the QT interval is currently unknown. For these reasons, use of specific QT interval cut-off values must be interpreted in the context of specific clinical information. For example, among the diagnostic reversals that we have encountered to date, 10% involved patients who had been referred after presenting to an emergency department with an episode of pre-syncope or syncope (typically vasovagal in description) where their first ever ECG demonstrated a “borderline” QT interval.
In addition, structural heart disease can play a significant role in altering the QT interval.18 Obtaining an exact measurement is particularly difficult in patients with left or right bundle branch block, found commonly in patients with a surgical history of congenital heart disease.32 Left ventricular hypertrophy may prolong the QT interval in the absence of known ion channel disease.33 The presence of infarction or ischaemia in adults may also prolong the QT interval independently.34 Electrolyte abnormalities such as hypokalaemia, hypomagnesaemia and hypocalcaemia can lengthen the QT interval, whereas hypercalcaemia may shorten the QT interval.35 Prolonged QT intervals have been found in patients with diabetic ketoacidosis and are associated with the level of ketosis, even in the absence of electrolyte abnormalities.36 Patients with anorexia nervosa have longer QT intervals than controls with normal body weight.37 Finally, the QTc of normal subjects has been shown to demonstrate diurnal variation (longer during sleep and during REM sleep in particular),38 39 and the QTc in otherwise healthy men is significantly longer in winter months than summer months.40
Numerous drugs have been well documented to prolong the QT interval as an unwanted side effect.41 The presence of these drugs must be ruled out during the workup for LQTS, and they should be avoided as a rule when a diagnosis of LQTS is considered. An up-to-date list of these drugs is available at http://www.qtdrugs.org.
QT intervals in athletes
The prevalence of QT interval prolongation in asymptomatic elite athletes was recently reported as 0.4%, or 1 in 286 patients.30 Of the positive patients in this study, only the three with QT intervals over 500 ms had either a positive provocation test or positive genetic test, and were thus excluded from participating in their sport. Four other patients with QTc values between 460 and 500 ms were studied further, but not disqualified from their sport because of negative family histories and negative provocative testing. A 2006 publication on the Italian pre-participation screening programme reported disqualification of 2% of all athletes on the basis of screening, with only five athletes out of 42 386 ultimately diagnosed with LQTS.42 The majority of disqualifications in the Italian cohort were for cardiomyopathy, hypertension, valvular disease and non-LQTS rhythm abnormalities.42 In each of these studies, the European guideline cut-off values for diagnosing prolonged QT were used: 440 ms for males and 460 ms for females.43
The 36th Bethesda Conference guidelines were published in 2005 and established recommendations for athletic activity restrictions in patients with LQTS.44 A near-all-encompassing competitive sports disqualification was advised for any patient with a history of out-of-hospital cardiac arrest or LQTS-related syncopal episode, regardless of underlying genotype or QTc. For asymptomatic patients, a QTc of ⩾470 ms in males or ⩾480 ms in females was the recommended limitation to only class IA sports of billiards, bowling, cricket, curling, golf and riflery, with further liberalisation possible if the asymptomatic patient had the LQT3 genotype. A loosening of the competitive sports disqualifications was deemed reasonable for asymptomatic genotype-positive LQTS patients with QTc values in the overlapping/borderline range, except for competitive swimming in athletes with concealed LQT1.44
The European Society of Cardiology (ESC) in 2006 also published a set of athletic activity guidelines for patients with LQTS.45 Patients were recommended to be completely restricted from participating in competitive sports if they were symptomatic, had a prolonged QT interval (over 440–470 ms in men, over 460–480 ms in women), or were carriers of a known genetic mutation (regardless of their QTc). Patients considered at low risk of sudden death were allowed to participate in light to moderate leisure activity. Any sports involving sudden bursts of activity or genotype-specific triggers were absolutely contraindicated in patients with LQTS. Again, in contrast with the Bethesda guidelines, the recommendation for competitive sports restriction was unchanged for genotype-positive patients with normal or borderline QT values.45
As is evident, there are profound implications of hosting QTc values that are awarded 1, 2 or 3 points in the LQTS diagnostic score card and consequently convey “intermediate” probability for LQTS (table 1). However, what truly is the predictive utility of say a QTc of 450 ms in an otherwise healthy man or a QTc of 470 ms, or dare we say, 480 ms or even 490 ms, in a healthy woman? As we shall see, clinical context and pretest probability mean everything.
How long is too long?
As seen in fig 1, there is substantial overlap in the distribution of QTc between otherwise healthy subjects and patients with genetically confirmed LQTS. Among patients seen with genetically proven LQTS at the Mayo Clinic, the mean (SD) QTc is 482 (50) ms and, at present, ranges from 365 ms as the lowest value in a patient with genetically definite LQT1 to a high of 800 ms. Consistent with the published literature, 40% of our genotyped LQTS population exhibit QTc values <460 ms. However, this prevalence of concealed or normal QT interval-LQTS must be juxtaposed carefully with the normal distribution of QTc values, including the prevalence of normal people who simply exhibit “upper limit of normal” QTc values. In other words, there are a lot more normal people with high normal, upper limit of normal, borderline QT prolongation than there are people with a 1 in 2500 condition known as LQTS where half of them have a QTc <480 ms. This important subtlety appears to have been overlooked given the current mini-epidemic of overdiagnosed LQTS.16 In fact, when the original LQTS diagnostic criteria were published in 1985, a diagnostic cut-off QTc value of 440 ms was used, regardless of patient age or gender.46 The criteria were updated in 1993 to now award 1 point to a male with a QTc of 450 ms and 2 points to both males and females when a QTc of 460 ms is reached.14 This gender differentiation was added after adult women were found to have longer QTc values than men by ∼10 ms.47 Nevertheless, any person with a QTc ⩾460 ms receives 2 points in the LQTS diagnostic score card, which is translated as “intermediate probability” for LQTS. As we will see, this clinical assignment of “intermediate probability” is only valid if one accepts a 2% chance of LQTS as indicative of “intermediate probability”.
Several recent reviews have proposed an “upper limit” of 460 ms in patients <15 years of age, 470 ms for adult females, and 450 ms for adult males.17 23 In this algorithm, any QTc value within 20 ms of these designated upper limits is considered “borderline”.23 Consequently, an adult male with a QTc of 431 ms is considered by these criteria to exhibit “borderline” QT prolongation. Others have proposed that any patient with a QTc between 440 and 470 ms be labelled “borderline.”18 A 2005 European protocol proposed the use of a QTc value greater than 440 ms in males and 460 ms in females as a definition of a “prolonged” QTc.30 43 Even the latest 2009 AHA/ACCF/HRS Recommendations for the Standardization and Interpretation of the Electrocardiogram states that a QTc ⩾450 ms (males) and ⩾460 ms (females) “be considered a prolonged QT interval”.48
With respect to “borderline”, although the literature cites the “normal range” as being 350–440 ms, it is often not recognised that 10–20% of otherwise healthy postpubertal individuals have QTc values beyond this so-called “normal range” (fig 1). In other words, 10–20% of the human population has “borderline QT prolongation” per any of the aforementioned definitions, guidelines or cut-offs. As shown in fig 1, 0.5–1% of men and women in the adult human population receive at least 2 points and a clinical diagnostic score indicative of “intermediate probability” LQTS.
Figure 5 depicts the critical importance of context in the determination of when “long is too long”. There would be little debate as to the near-100% pretest probability of LQTS for someone with documented torsades de pointes while swimming and a QTc of 500 ms. On the other hand, there would be tremendous debate as to the probability of LQTS in an asymptomatic, postpubertal female with a QTc of 481 ms. By the LQTS diagnostic score card, 3 points and “intermediate probability” would be assigned. By the ESC 2006 position statement, she would be disqualified from all sports regardless of symptomatic state. However, if such a QTc value represents the 99–99.5th centile among women, this stand-alone value confers a positive predictive value for LQTS of <5%. If such a QTc cut-off value (480 ms) were adopted as part of a universal screen for females (470 ms for males), 20–25 people could be prematurely and incorrectly diagnosed with LQTS for every single person where this screening ECG exposed LQTS in an otherwise asymptomatic host. Again, everything is context dependent, as these same cut-off values applied to universal screening of infants instead of postpubertal adults might have positive predictive values approaching 50%.49 50

Effect of clinical setting on the relative probability of having long QT syndrome (LQTS). Note the relatively low predictive value of a QTc >440 ms in any asymptomatic patient compared with the patient with personal symptoms or a family history suggestive of LQTS. TdP, torsades de pointes.
Now consider the 440 ms threshold that is still held in some circles as worthy of receiving “borderline QT prolongation”, which unfortunately is almost always incorrectly and quickly translated as “borderline LQTS”. As shown in figs 1 and 5, this value is achieved or exceeded by 2.5% of 4-day-old infants51 and by 10–20% of postpubertal adults. Accordingly, an adult woman with no personal or family history suggestive of LQTS has <0.1% probability of LQTS simply because her screening ECG registered a QTc of 443 ms. In sharp contrast, an equally asymptomatic teenage athlete with the same QTc who is the offspring of a mother with A341V-KCNQ1-mediated LQT1 has a 50% chance (not <0.1% chance) of inheriting her mother’s LQT1-susceptibility mutation and may have LQTS.
Authors’ recommendations
If an ECG is ordered to “rule out” LQTS, the computer-derived QTc must be manually verified. If the manually derived QT interval is within 10 ms of the computer’s QT interval by either the “tangential” or “avoid-the-tail” method, one can be confident that the computer knows how to compute the average RR interval, use the heart rate correction formula, and generate an accurate QTc.
All manually measured QTc values must be interpreted in the context of the patient’s personal and family history.
A “borderline” QTc value is not sufficient evidence for a diagnosis of LQTS or even borderline/possible LQTS.
In a patient with a personal or family history suspicious for LQTS (exercise-induced syncope/seizures for example), further work-up for LQTS including treadmill exercise stress testing and/or epinephrine QT stress testing, and genetic testing should be considered even if the QTc is “borderline” or possibly even normal. In other words, the story should drive the depth and aggressiveness of the evaluation not the 12-lead ECG. However, exercise-induced syncope in the context of a QTc <460 ms is far more likely to stem from catecholaminergic polymorphic ventricular tachycardia than from concealed type 1 LQTS.
As a potentially lethal, highly treatable condition affecting 1 in 2500 people, LQTS certainly warrants consideration of not only pre-participation athlete screening but also universal screening. From a screening perspective, a QTc value ⩾470 ms for a 2–4-week-old infant screening programme or a QTc ⩾500 ms in adolescents/adults may represent far more optimal “penalty box” screening values with an estimated positive predictive value >50%. Such a screen would produce far fewer subsequent evaluations needed to distinguish the true positives from the false positives while capturing the subpopulation of LQTS most at risk of a future LQTS-precipitated cardiac event. Furthermore, subsequent genetic testing of these positively screened index cases would identify their LQTS-susceptibility mutation over 75% of the time, thereby permitting genetic testing of appropriate family members, which would enable a large proportion of the subpopulation of lower risk, normal QT interval/borderline QT interval/concealed LQTS to be essentially “back-filled.”
Conclusions
Primary care physicians and cardiologists are often confronted with patients who exhibit “upper limit of normal” or “borderline QT prolongation” and then give the diagnosis of “possible/borderline” LQTS. The extreme overlap in this index of cardiac repolarisation between patients with genetically established LQTS and otherwise healthy subjects emphasises the critical importance of considering the whole clinical picture and the various diagnostic modalities besides the 12-lead ECG to distinguish the person who has a highly treatable, potentially life-threatening condition known as LQTS from the one whose QTc is just “borderline” just because.
What is already known on this topic
Long QT syndrome (LQTS) is a potentially lethal yet highly treatable genetic heart rhythm disorder (“cardiac channelopathy”) that affects an estimated 1 in 2500 people.
Investigators have searched for simple non-invasive methods to aid in the diagnostic elucidation and risk stratification of patients with suspected LQTS.
Despite significant advances in our understanding of its pathogenic underpinnings, genotype–phenotype relationships and therapeutic strategies, LQTS still remains both underdiagnosed and overdiagnosed.
What this study adds
Whereas many authors have attempted to pick a specific “cut-off” QTc value for athletic disqualification and risk stratification, this study emphasises that all QTc measurements should be interpreted in the context of the patient’s personal and family history.
More importantly, the age-dependent and sex-dependent normal distribution of this particular index of repolarisation (QTc) in both health and disease must be kept in sharp focus.
Acknowledgments
MA’s research programme was supported by the Mayo Clinic Windland Smith Rice Comprehensive Sudden Cardiac Death Program, the Dr Scholl Foundation, the CJ Foundation for SIDS, the Hannah Wernke Memorial Foundation, an Established Investigator Award from the American Heart Association, and the National Institutes of Health (HD42569).
REFERENCES
Footnotes
Competing interests MA is a consultant for PGxHealth, Medtronic, Pfizer, Mayo Clinic Health Solutions, the Mayo Clinic Windland Smith Rice Sudden Death Genomics Laboratory and receives royalties from LQTS and CPVT genetic testing (FAMILION) by PGxHealth.
Provenance and peer review Commissioned; not externally peer reviewed.