Article Text

Abstract
It has been argued that the physical sensations induced by exercise, measured as the ratings of perceived exertion (RPE), are distinct from the sense of effort. This study aimed to determine whether a new measure of task effort – the Task Effort and Awareness (TEA) score – is able to measure sensations distinct from those included in the conventional RPE scale. Seven well-trained cyclists completed a maximal effort 100 km time trial (TT) and a submaximal trial at 70% of the power sustained during the TT (70% TT). Five maximal 1 km sprints were included in both trials. Both the RPE related solely to physical sensation (P-RPE) and the TEA score increased during the TT and were linearly related. During the 70% TT, both P-RPE and TEA scores increased, but TEA increased significantly less than P-RPE (p<0.001). TEA scores reached maximal values in all 1 km sprints in both the maximal TT and 70% TT, whereas the RPE increased progressively, reaching a maximal value only in the final 1 km sprints in both the TT and the 70% TT. These results indicate that the physical sensations of effort measured as the P-RPE act as the template regulating performance during exercise and that deviation from that template produces an increase in the sense of effort measured by the TEA score. Together, these controls ensure that the chosen exercise intensity does not threaten bodily homeostasis. Our findings also explain why submaximal exercise conducted within the constraints of the template P-RPE does not produce any conscious awareness of effort.
Statistics from Altmetric.com
Introduction
We and others have provided evidence that a complex, intelligent, central nervous system (CNS) mechanism is responsible for the regulation of exercise performance during endurance exercise of maximal effort.1,–,5 A number of studies have now established that the rate at which perceived exertion increases is a key variable regulating performance during prolonged endurance exercise.6,–,11 Accordingly, Tucker and Noakes have proposed a model in which the ratings of perceived exertion (RPE) are compared with the ‘template’ of a desired or ideal RPE progression.12 13 This template is based on experience and planned in anticipation based on the expected exercise duration. We have recently advanced this concept by showing that certainty about the exercise duration and precise knowledge of the end point of exercise determines the characteristics of this response.5
Thus, the rate at which the RPE increases during exercise becomes increasingly linear with both experience and greater certainty about the end point. This finding has been independently confirmed.14 The model by Tucker and Noakes proposes that a mismatch between the expected and actual RPE produces an alteration in the workload to correct this mismatch. However, their model does not include a mechanism to explain how the CNS corrects the workload to ensure that the RPE is maintained within the constraints imposed by the predetermined template. Specifically, the model by Tucker and Noakes leaves unanswered the question of whether the decision to modify the workload is determined consciously or subconsciously. This is relevant because the current debate of how the CNS regulates exercise performance focuses on the contrasting views that this controller acts subconsciously15 or consciously,16 or as a combination of both.17 18 De Koning et al19 have recently proposed that an index of momentary RPE predicts the subsequent pace chosen and have named this the ‘hazard score’. The end point of the event is a key anchor against which the index is measured. However, those authors do not speculate on how the hazard score is perceived within those brain areas responsible for the pacing strategy.
In addition, the exact meaning of the term ‘perceived exertion’ has recently been questioned20 on the grounds that the term incorporates both the physical sensations of exercise and the psychological/psychic effort required to perform the task. Borg21 acknowledged this in his earlier description of the RPE, “being an expression of the individual's total physical and psychic reaction to exertion.” Thus, it has recently been proposed that the physical symptoms induced by exercise are distinct from the sense of effort.17 20 We suggest that the sense of effort is a subjective sensation, not based on any (known) physical changes induced by exercise, but which is generated by the brain in response to some as yet unidentified specific component of the exercise bout.
We hypothesise that the mechanisms responsible for the sense of effort – in our terms, the conscious mental (psychic) effort required to sustain or increase the current exercise intensity (work rate) – will be absent when the exercise does not pose a threat to homeostatic control or if the threat is of so small a magnitude that the subject becomes aware of a sense of effort only when specifically questioned by another. Conversely, when the exercise intensity threatens homeostatic control, either imminently or at some time in the future, before the completion of the task, this sense of effort will increase in proportion to the magnitude of the imposed threat. This would produce a progressively greater sense of effort, the goal of which is to force the exerciser to reduce the current exercise intensity to ensure that a catastrophic biological failure does not occur during the exercise bout.22 23
To investigate the possible independent effects of the physical (RPE) and psychic sensations generated during exercise, we developed a novel perceptual scale to quantify the (psychic) sense of effort, including the individual's conscious awareness of that specific sensation. We have termed this scale the Task Effort and Awareness (TEA) scale.
In addition, the traditional Borg 15 point RPE scale was modified to include only the physical sensations experienced by the subject. We have termed this the physical-RPE (P-RPE) scale. We hypothesised that the rate of progression of the P-RPE would be a key regulator of task effort because, as previously established for the traditional Borg RPE scale, the P-RPE should increase as a generally linear function of exercise duration. Any deviation in the moment-to-moment P-RPE above the brain prescribed RPE template would generate an increased sense of effort measured by an increased TEA score. Ultimately, the increasing sense of effort would generate a conscious signal that would ultimately force the subject to reduce the exercise intensity. In contrast, a P-RPE that increased at a rate slower than that prescribed by the anticipatory RPE template would generate a low TEA score or none at all.
This model therefore attempts to determine why the conscious awareness of the sense of effort occurs.24 We hypothesise that the sense of effort plays a role in modifying exercise behaviour specifically to ensure that the P-RPE follows the predetermined template reaching its maximum value only at the point of exercise termination. In particular, we hypothesised that the P-RPE would increase as a linear function of the exercise duration but would not reach maximum values during bouts of intermittent all-out exercise that were interspersed regularly during a more prolonged exercise bout. In contrast, the sense of effort measured as the TEA score would reach maximum values during each maximal effort, indicating that the sense of effort impinges into the subject's consciousness whenever the P-RPE increases above the predetermined anticipatory RPE template for a specific exercise bout.
Methods
Ethical approval
Before participation, subjects completed the Physical Activity Readiness Questionnaire and were informed of the risks associated with the study. Informed consent was obtained in writing before the initiation of the study. All procedures conformed to the declaration of Helsinki.25 The study was approved by the Research and Ethics Committee of the Faculty of Health Sciences of the University of Cape Town Medical School.
Study design
Seven trained competitive male cyclists were recruited for the study. Subjects reported to the laboratory on four occasions. During the first visit, subjects underwent anthropometric assessment and preliminary testing for measurement of peak oxygen consumption (VO2peak).
Each cyclist subsequently completed three 100 km time trials (TTs) that incorporated 5×1 km sprints at 11, 32, 52, 72 and 99 km. These trials were completed at weekly intervals. The first trial acted as a familiarisation TT. Subjects then completed a self-paced maximal 100 km stochastic TT followed by a submaximal 100 km TT (70% TT) trial, which was conducted at 70% of the average power output achieved during the TT. However, subjects were asked to produce a maximal effort during the 1 km sprints during both trials. Therefore, in the 70% TT, the baseline power output was 70% of the average power sustained during the TT, whereas the sprints were maximal effort in both trials. Each trial was conducted on a simulated flat 100 km course created on the Computrainer Ergometer (RacerMate, Seattle, USA). Subjects were blinded to all feedback except completed distance during all trials.
During the trials, subjects consumed a commercially available sports drink (8% carbohydrate content) at a rate of 600 ml/h (150 ml every 15 min) because this ingestion rate prevents the development of hypoglycaemia during prolonged exercise.26 Additional water was available ad libitum during the trials.
General procedure
All subjects reported to the cycling laboratory, in which all testing was conducted under stable climatic conditions (21.4 ± 0.8°C, 46 ± 3% relative humidity, 102.2 ± 0.6 kPa).
Measurement of body composition, including height, body mass and seven skinfolds (triceps, biceps, suprailiac, subscapular, calf, thigh and abdomen27), was performed before the start of the initial test (VO2peak). Each subject's height (cm) and mass (kg) were measured using a precision stadiometer and balance (Model 770; Seca, Bonn, Germany), accurate to 1 mm and 100 g, respectively.
Body fat content was measured as the sum of seven skinfolds and as a percentage of body mass (%BF).28 Each subject was asked to refrain from consuming any caffeine or other stimulants on the day of each performance test. Before each testing session, subjects were questioned to confirm that they had adhered to these instructions.
All tests were performed on an electronically braked cycle ergometer (Computrainer Pro 3D; RacerMate, Seattle, Washington, USA), which allows subjects to use their own bicycles in the laboratory. The rear wheel tire of each subject's bicycle was inflated to 800 kPa, and the bicycle was mounted with a rear axle quick release mechanism. Before the start of the warm-up protocol, the contact pressure of the load generator against the rear wheel was calibrated to 0.88–0.93 kg. After a 15 min self-paced warm-up protocol, the load generator was recalibrated to 0.88-0.93 kg as recommended.29 30
Perceptual scores
To measure only the physical sensations experienced during exercise, the traditional Borg 15 point RPE scale was modified to exclude any psychological/psychic contribution to effort perception. We have termed this the physical-RPE (P-RPE) scale because it includes only the physical sensations experienced by the subject.
Before the progressive exercise test, subjects were familiarised with the P-RPE scale according to a standard set of instructions (Appendix B). As described, subjects were asked to consider only the physical sensations of effort and to specifically exclude any psychological/psychic contributions to those sensations.
In addition, subjects were instructed according to a novel scale, which was designed specifically to incorporate two components: (1) the magnitude of the psychological/psychic sensations of effort and (2) the extent to which the subject was consciously aware of those sensations (TEA scale) (Appendix B). We hypothesised that this sense of effort would increase linearly at a similar rate as the P-RPE during all-out exercise and therefore developed an equivalent 15 point scale. The scale includes negative values to indicate the absence of any sense of effort. The position of the verbal anchors was based on pilot trials.
To confirm that subjects understood the difference between these two scales, each subject completed a 10 point questionnaire after the initial familiarisation with both scales. Subjects were allowed to continue with the trial only if they answered at least nine of the questions correctly.
During each trial, subjects were asked to report their P-RPE and TEA scores verbally and by pointing at a chart after every 5 km interval and at the end of each 1 km sprint. During the progressive exercise test, subjects were asked to report their P-RPE and TEA scores at 2 min intervals until exhaustion. Subjects were reminded repeatedly to include only physical sensations for the P-RPE score, whereas for the TEA score, they were asked to consider only the ratings of psychological/psychic effort.
Progressive exercise test
Testing for VO2peak was performed at a starting work rate of 100 W. The load was increased incrementally at a rate of 20 W every 60 s until the subject was unable to sustain a cadence greater than 70 revolutions/min. During the progressive exercise test, ventilation volume (VE), oxygen uptake (VO2) and CO2 production (VCO2) were averaged every 15 s using an online breath-by-breath gas analyser and pneumotach (Oxycon; Viasis, Hoechberg, Germany). Calibration of this device was performed before testing according to the manufacturer's instructions. VO2peak was recorded as the highest VO2 measurement recorded for any 30 s period. Peak power output (PPO) was calculated by averaging the power output for the final minute of the VO2peak test.31 Subjects were not allowed to stand on the pedals at any time during the test.
Data collection and analysis
Power output, speed, cadence and elapsed time were measured during all trials and stored by the Computrainer software at a rate of 34 Hz. Heart rate data were captured with Suunto T6 heart rate monitors (Suunto Oy, Vantaa, Finland) and stored every 2 s. Performance and heart rate data from the PPO test and the 100 km TTs (TT and 70%TT) were analysed for the full period of the data capture and for each 1 km sprint. Analysis of performance data was performed using CyclingPeaks analysis software (WKO+ edition, Version 2.1, 2006; Lafayette, Colorado, USA). Heart rate data were analysed with the Suunto Training Manager (Version 2.1.0.3; Suunto Oy, Vantaa, Finland).
Statistical analysis
Data were analysed for statistical significance using STATISTICA version 8.0 (Stat-soft, Tulsa, Oklahoma, USA). A two-way analysis of variance with repeated measures was used to examine differences between trials. Sphericity of the data was tested using the Mauchley test.32 When the sphericity condition was violated, a Greenhouse-Geisser adjustment was made to the degrees of freedom to counter the increased risk of a type I error. Where a significant difference was found for either main effect (trial or time), a Tukey post-hoc analysis was performed. Regression analyses for the relationship between P-RPE and TEA scores were performed for the progressive exercise, both trials (baseline values) and the values recorded during sprints. Differences between the TT and 70% TT for TEA scores were determined using an unpaired t test.
Statistical significance was accepted when p<0.05. All data are expressed as means ± SD (X ± s).
Results
Subject characteristics
The descriptive characteristics of the subjects and results for the VO2peak testing are listed in table 1.
Subject characteristics (N=7)
Power
Sustained and sprint power output are shown in figure 1. A significant time × trial interaction was observed for power output (F9,108=3.76; p=0.0003). Sustained power output during the 70% TT was significantly lower than during the TT in accordance with the experimental design (main effect of trial: F1,12=4.61; p=0.05). Power output during the 1 km sprints was significantly greater in the 70% TT than in the TT (main effect of trial: F1,12=5.11; p=0.043).
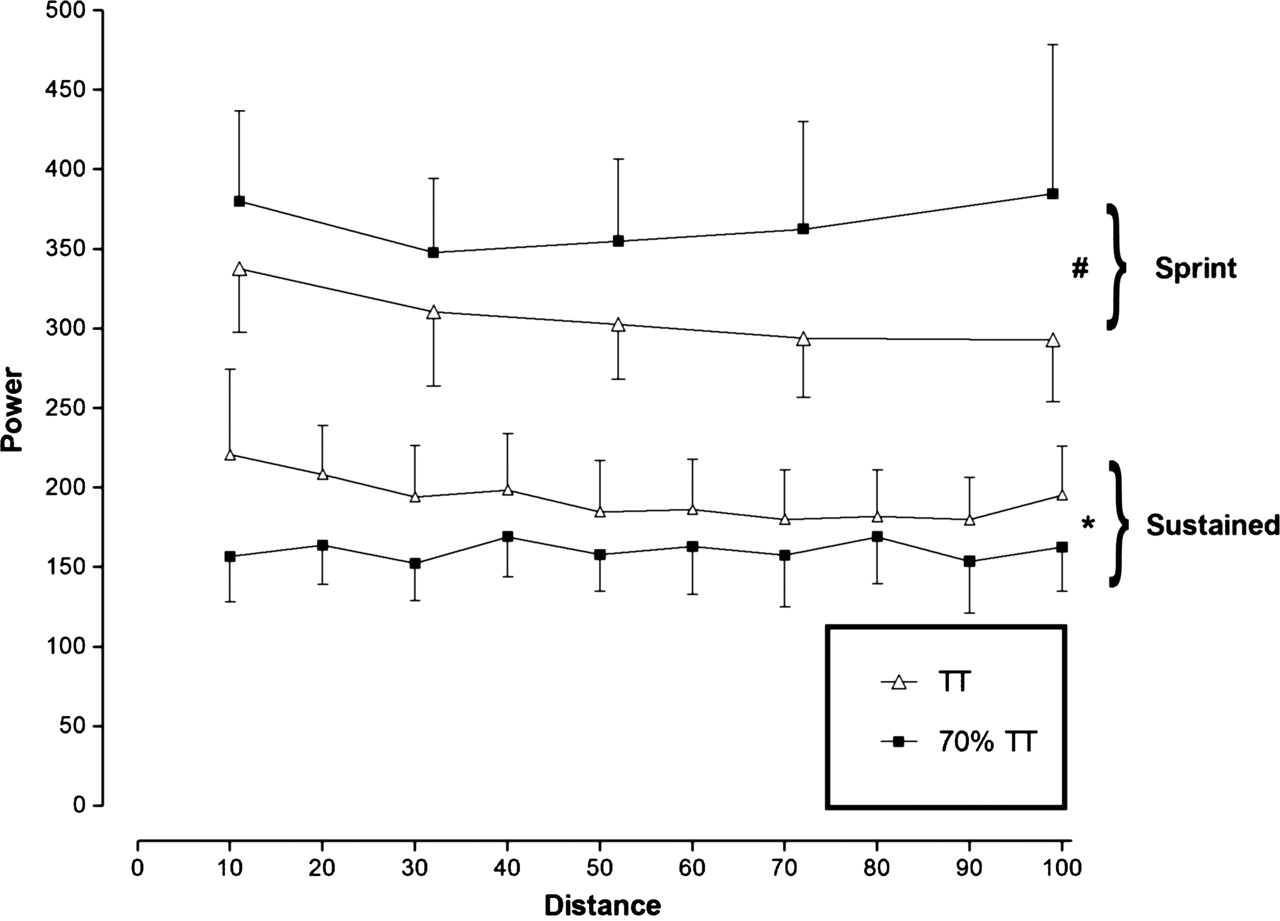
Sustained and sprint power output. *Significant difference between trials for sustained power output (p=0.05). #Significant difference between trials for sprint power output (p=0.043).
P-RPE
P-RPE scores during the continuous section of the trials increased progressively with time in both TT and 70% TT (main effect of time: F18,216=49.5; p<0.001) (figure 2A) and were significantly greater in the TT (mean = 14.4 ± 0.7) than in the 70% TT (mean = 12.1 ± 1.2) (main effect of trial: F1,12=18.6; p<0.001). Sprint P-RPE scores (figure 2B) also increased progressively with time in both trials (main effect of time: F4,48=33.8; p<0.001) and were significantly greater in the TT (mean = 19.1 ± 0.5) than in the 70% TT (mean = 18.3 ± 0.7) (main effect of trial: F1,12=5.7; p=0.03).
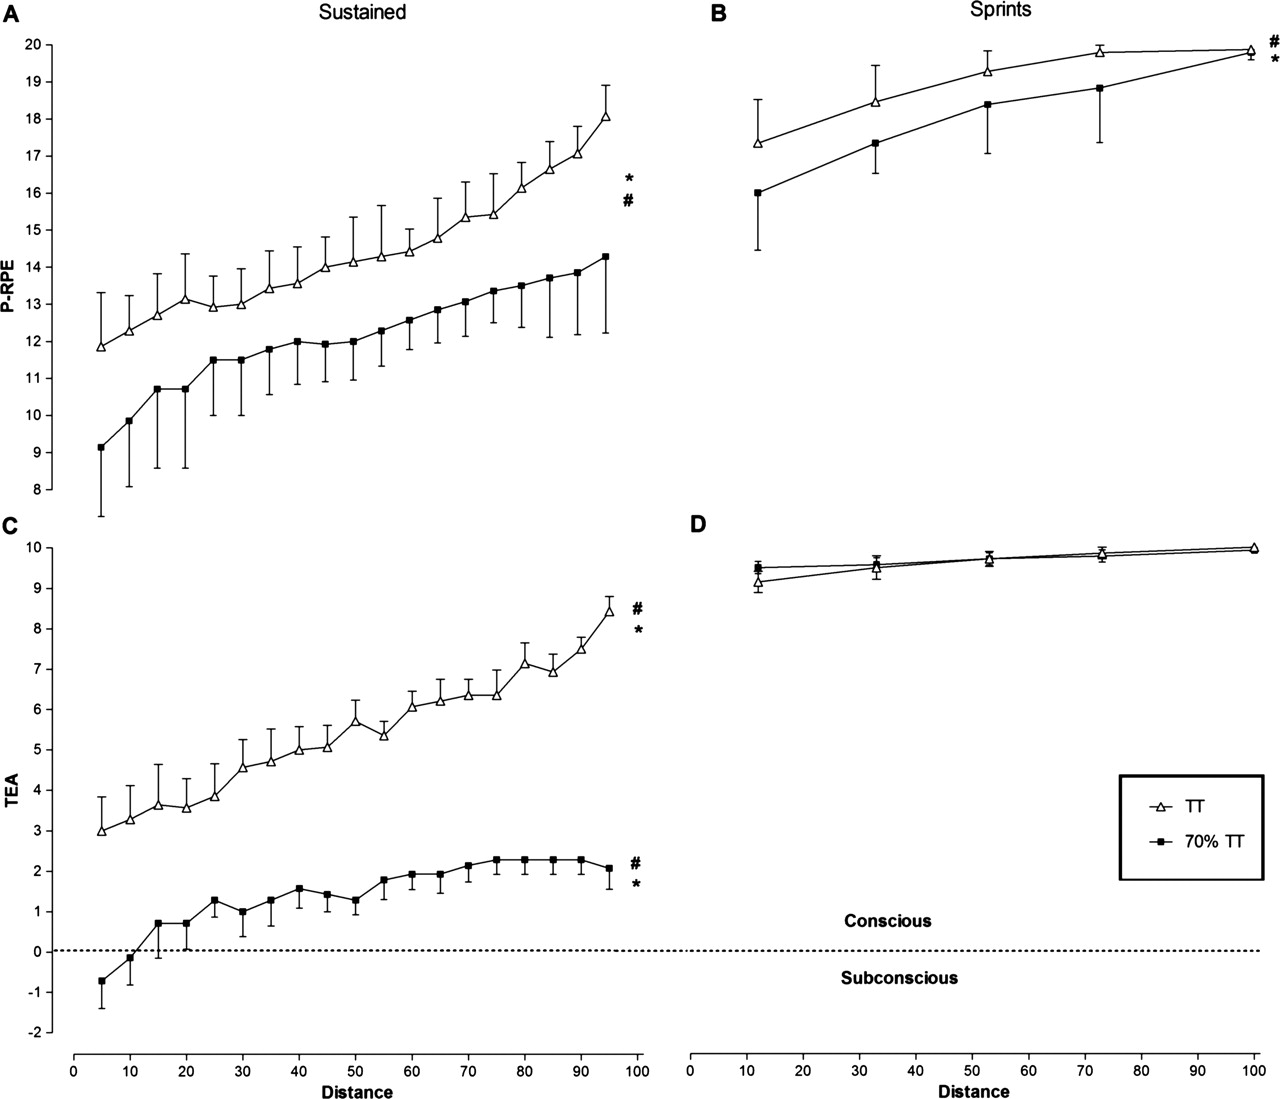
Perceptual scores. (A) RPE scores during continuous exercise. *Significant difference between trials (p=0.01). #Time main effect, increase over time in RPE in both trials (p<0.001). (B) Sprint RPE scores. *Significant difference between trials (p=0.02). #Time main effect, increase over time in RPE in both trials (p<0.001). (C) TEA scores during continuous exercise. *Significant difference between trials (p<0.001). #Time main effect, increase over time in TEA in both trials (p<0.001). (D) Sprint TEA scores. RPE, ratings of perceived exertion; TEA, Task Effort and Awareness.
TEA
A significant time × trial interaction was observed for non-sprint TEA scores (F18,216=3.62; p<0.001). TEA scores during the continuous section of the trials increased over time in both the TT and 70% TT (main effect of time: F18,216=23.9; p<0.001) (figure 2C) and were significantly greater in the TT (mean = 5.4 ± 1.4) than in the 70% TT (mean = 1.4 ± 1.1) (main effect of trial: F1,12=35.2; p<0.001). However, TEA scores during the sprint component of the trials were not different between TT (mean = 9.6 ± 0.3) and 70% TT (mean = 9.7 ± 0.3), nor did they change over time in either group (figure 2D). In both cases, values approached the maximum value of 10.0 at the termination of each individual sprint.
Relationship between P-RPE and TEA scores
During the progressive exercise test, both P-RPE and TEA scores increased linearly (r=0.93 for both variables) over time (figure 3). The slope values for P-RPE (slope = 0.84) and TEA (slope = 0.81) did not differ significantly, whereas the Y-intercept values (P-RPE = 5.05 and TEA = −4.35) were similar to the lowest values for both scales.

Perceptual scores during a progressive exercise test. Regression lines for TEA and P-RPE do not differ significantly. RPE, ratings of perceived exertion; TEA, Task Effort and Awareness.
The relationships between P-RPE and TEA were similar for both the progressive exercise test (slope = 0.94; Y-intercept = −8.8; r = 0.96) and the TT trial (slope = 0.90; Y-intercept = −7.6; r = 0.80) (figure 4A,B). However, during the 70% TT, this relationship changed with lower TEA scores relative to P-RPE (slope = 0.56; Y-intercept = −6.4; r=0.81) (figure 4C). This was significantly different to the progressive exercise test and TT (p<0.001). The relationship between P-RPE and TEA scores also changed during the 1 km sprints (slope= 0.11; Y-intercept = 6.5; r = 0.50) (figure 4D) and was significantly different from the values measured during the continuous exercise sections in the TT (p<0.001).

Regression analyses for TEA vs RPE. (A) The progressive exercise test, (B) the time trial (TT), (C) the 70% TT and (D) sprints from both trials. *Slope and intercepts significantly different from both A and B (p<0.001). **Slope and intercepts significantly different from A and B (p<0.001). RPE, ratings of perceived exertion; TEA, Task Effort and Awareness.
Heart rate
Mean heart rates were significantly greater during the TT (142 ± 7 BPM than during the 70% TT (130 ± 5 BPM) (p=0.004).
Discussion
The first important finding of this study was that subjects were able to differentiate clearly between the physical sensations of exercise and psychological/psychic effort required to produce the required workload, measured by the TEA score. This is clearly seen by the dissociation of these two values when subjects exercised at either a lower exercise intensity in the 70% TT or during the all-out sprints in both trials.
During progressive exercise to exhaustion for measurement of the VO2max, the TEA score increased as a linear function of both the exercise intensity (figure 3) and the physical sensations experienced during exercise (P-RPE) (figure 4A). The regression lines for these two scales were virtually superimposable. This indicates that the range of the TEA scale is correct; that it has a linear growth function; and that the verbal anchors are correctly positioned.
In addition, we showed that the perceived exertion scores (P-RPE), modified to include only physical sensations and specifically to exclude sensations relating to psychological/psychic effort, increase progressively and linearly with time during a maximal effort 100 km cycling TT (figure 2A). Furthermore, the P-RPE values reached near maximal values at or near the end of the exercise bout. This finding supports similar findings in a number of other studies that used the traditional Borg RPE scale.6,–,10 33,–,35
This finding supports the interpretation that afferent sensory feedback is a key factor regulating exercise performance to ensure that exercise terminates before a catastrophic homeostatic derangement occurs22 as opposed to being based purely on feed forward efferent command from the motor cortex, so called ‘efference copies’.16
To our knowledge, the third important finding is entirely novel. For we have shown that the psychological/psychic effort of exercise, measured by the TEA score, can be dissociated from the physical sensations induced by exercise and are measured by the P-RPE score. On the basis of this finding, we propose that the TEA score measures the psychic effort of maintaining the physical effort that is measured by the P-RPE score.
Thus, we found that both the P-RPE and TEA scores increased over time during exercise of a maximal effort (figure 2A). However, when the exercise was performed at a lower intensity, the P-RPE increased, albeit more slowly (figure 2A – bottom line), whereas the TEA score remained low and within the predominantly subconscious range of the scale (figure 2C – bottom line). In addition, the TEA scores were significantly lower (p<0.001) than their respective P-RPE values in comparison to maximal effort exercise (figure 4C). This shows that the TEA score is not a regulator of exercise performance when the workload is submaximal and that there is no threat to homeostatic control. Under these circumstances, the exercise workload can be maintained with little conscious effort.
In contrast, although P-RPE scores were submaximal (16.2–19.1) during the 1 km sprints of both trials (figure 2B), the TEA scores reached near maximal values for all sprints (9.1–9.9) (figure 2D). TEA scores during sprints were therefore significantly amplified (p<0.01) in relation to their respective P-RPE values compared with the same RPE values recorded during the baseline period of the TT. This finding is also, to our knowledge, completely novel. It appears to show that reaching a maximum sense of effort as measured with TEA scores, and not maximum P-RPE values, is the variable that reflects the CNS process regulating performance during sprints of maximal effort interspersed within a 100 km TT.
Interestingly, the power outputs achieved during the sprints in the 70% TT were significantly greater than those achieved during the TT; however, the peak TEA scores were identical. This may indicate that the lower power outputs during the continuous portions of the 70% TT were associated with a greater homeostatic reserve. As a result, significantly greater power outputs were required during the 1 km sprints to elicit similar homeostatic disturbances or ‘hazard19’ and hence equivalent TEA scores as those reached during the 1 km sprints during the TT.
These findings are therefore compatible with the following interpretation: the awareness of the sense of effort may therefore represent an emotion derived from a distinct cortical image of homeostatic afferent activity that reflects all aspects of the physiologic condition of all tissues of the body in the context of the remaining work that is required to complete the exercise task.36 37 Therefore, the conscious decision of whether to maintain, increase or decrease the current workload or indeed to terminate the exercise altogether may be the outcome of a balance between motivation and affect and the sensation that is defined as the sense of effort.
Conclusion
We have provided further evidence that exercise is controlled in a feed-forward and adaptive teleoanticipatory manner. In addition, we have shown perhaps for the first time that the sense of effort and the physical sensations of exercise are distinct but related perceptual cues that play a critical role in the regulation of exercise intensity. Thus, the sense of effort is low during low-intensity exercise, despite progressively increasing physical sensations (measured by P-RPE) as the exercise continues. In contrast, during short sprints of maximal intensity interspersed within the prolonged exercise bout, the sense of effort reaches maximal values, whereas P-RPE values remain submaximal.
These data therefore support the interpretation that exercise is regulated centrally in the brain.1 22 38 We propose that this is achieved by altering the rate of progression of perceived exertion via knowledge of the end point and the duration of the exercise bout.5 8 11 13 39 This study shows that if the exercise workload exceeds that required to maintain the predetermined RPE template, a increasing conscious sense of effort as measured by the TEA scale is generated. This may be a conscious representation of the ‘hazard score’ as hypothesised by de Koning et al.19 The direct consequence of the increasing sense of effort will be an altered behaviour, specifically a voluntary reduction in the exercise intensity. Conversely, exercise intensities that do not pose a threat to homeostatic control produce no or little sense of effort.
What this study adds
This study adds novel understanding of the pacing mechanisms which occur in the central nervous system during maximal exercise of prolonged duration. A new scale is presented that differentiates task effort from perceived exertion.
References
Supplementary materials
Supplementary Data
This web only file has been produced by the BMJ Publishing Group from an electronic file supplied by the author(s) and has not been edited for content.
Files in this Data Supplement:
- Web Only Data - This web only file has been produced by the BMJ Publishing Group from an electronic file supplied by the author(s) and has not been edited for content.
Footnotes
-
Funding This research was funded by the Medical Research Council of South Africa, the University of Cape Town Harry Crossley and Nellie Atkinson Staff Research Funds, Discovery Health and the National Research Foundation of South Africa through the THRIP initiative.
-
Competing interests None.
-
Ethics approval The study was approved by Research and Ethics Committee of the Faculty of Health Sciences of the University of Cape Town Medical School.
-
Provenance and peer review Not commissioned; externally peer reviewed.