Article Text

Abstract
Objectives To examine with a parallel group study design the performance and physiological responses to a 14-day off-season ‘live high-train low in the heat’ training camp in elite football players.
Methods Seventeen professional Australian Rules Football players participated in outdoor football-specific skills (32±1°C, 11.5 h) and indoor strength (23±1°C, 9.3 h) sessions and slept (12 nights) and cycled indoors (4.3 h) in either normal air (NORM, n=8) or normobaric hypoxia (14±1 h/day, FiO2 15.2–14.3%, corresponding to a simulated altitude of 2500–3000 m, hypoxic (HYP), n=9). They completed the Yo-Yo Intermittent Recovery level 2 (Yo-YoIR2) in temperate conditions (23±1°C, normal air) precamp (Pre) and postcamp (Post). Plasma volume (PV) and haemoglobin mass (Hbmass) were measured at similar times and 4 weeks postcamp (4WPost). Sweat sodium concentration ((Na+)sweat) was measured Pre and Post during a heat-response test (44°C).
Results Both groups showed very large improvements in Yo-YoIR2 at Post (+44%; 90% CL 38, 50), with no between-group differences in the changes (−1%; −9, 9). Postcamp, large changes in PV (+5.6%; −1.8, 5.6) and (Na+)sweat (−29%; −37, −19) were observed in both groups, while Hbmass only moderately increased in HYP (+2.6%; 0.5, 4.5). At 4WPost, there was a likely slightly greater increase in Hbmass (+4.6%; 0.0, 9.3) and PV (+6%; −5, 18, unclear) in HYP than in NORM.
Conclusions The combination of heat and hypoxic exposure during sleep/training might offer a promising ‘conditioning cocktail’ in team sports.
- Altitude
- Aerobic fitness/Vo2 Max
- Thermoregulation
- Training
- Dehydration
This is an Open Access article distributed in accordance with the Creative Commons Attribution Non Commercial (CC BY-NC 3.0) license, which permits others to distribute, remix, adapt, build upon this work non-commercially, and license their derivative works on different terms, provided the original work is properly cited and the use is non-commercial. See: http://creativecommons.org/licenses/by-nc/3.0/
Statistics from Altmetric.com
Introduction
Along with the technical and tactical aspects of the game, well-developed physical capacities such as sprinting speed, acceleration/deceleration, maximal aerobic power and repeated-sprint performance are desirable for successful participation in elite level team sports such as Australian Rules football (AF).1 However, because training schedules are often crowded in many professional team sports, coaches often seek training strategies that concurrently target players’ physical fitness, technical and tactical skills.2 Additionally, with sports that have international competition schedules, teams are often required to play in extreme environments, including altitude (eg, 2010 Soccer World Cup in South Africa)3 and/or high temperatures and humidity (eg, 2008 Olympics in China).4
For these reasons, the use of hypoxic exposure including living high-training low model5 or living high-train low and high, interspersed6 and/or heat training7–9 has gained popularity. Both these methods have the potential to (1) improve the ability to perform at high intensity in the environment of interest,3 ,10 (2) elicit physiological adaptations that might translate into increased physical performance even in ‘normal’ environmental conditions6 ,7 ,9 ,11 and (3) save time for technical training as many of the purported adaptations are deemed to occur without altering the tactical contents of the training sessions (ie, the players get the environmental stimuli during their sleep (sleep high-train low model (LHTL)5) and/or while simply playing in the heat.7 ,8
In team sports, relatively short periods (ie, 1−2 weeks) of hypoxic or heat exposure/training may provide effective acclimation strategies prior to competition3 ,6 ,10 ,12 or during training camps to acutely improve fitness.6–8 Hypoxic exposure (eg, sleeping) can result in an increase in red blood cell volume or haemoglobin mass (Hbmass)6 ,13 and improved exercise economy or buffering capacity; physical training under hypoxic conditions has been reported to promote adaptations at the muscle level.6 ,14 In contrast, heat acclimatisation generally increases PV.15 ,16 Thus, theoretically, it is possible that combining both stimuli (ie, hypoxic exposure and training in the heat) would provide an additional training stress and afford a substantial improvement in total blood volume and convective O2 delivery17 and, in turn, high-intensity exercise performance. However, the potential physiological and performance responses to a combination of hypoxic and heat exposure have not been investigated. It is therefore still unknown whether combining hypoxic and heat exposure will have an additive effect on physical performance.
Nevertheless, with the exception of one study,18 short-term (ie, ≤2 weeks) exposure to hypoxia as implemented in team sports19 has not been demonstrated to be sufficient to stimulate erythropoiesis.6 ,13 While these observations may raise questions over the efficacy of the short-term hypoxic training camps in endurance athletes, recent findings still suggest a possible beneficial effect in team sports athletes, under specific environmental conditions.19 For instance, the Hbmass responses to hypoxic exposure being inversely related to athletes’ baseline Hbmass,20 ,21 which is likely lower in team sport players than in endurance athletes, a possibly greater (and hence, substantial) increase in Hbmass could be observed in this specific population. It has also been suggested that the short hypoxic exposure time, which is common to team sport camps, could be compensated by an increased level of hypoxia (ie, simulated ≥3000 m,22 which may provide increased haematological responses). Finally, since the heat-acclimatisation effects on performance in team sport players may occur within a week,7 an ergogenic benefit may be likely, regardless of the possible hypoxic-related responses.
The aim of the present study was therefore to describe the haematological and performance adaptations to the combination of heat and hypoxic exposure in elite AF players over a 2-week training camp (ie, live high-train high and low in the heat, interspersed model) and their changes during the following month. It was expected that heat training would lead to a substantial increase in PV and high-intensity running performance in the majority of players7; however, the potential benefits of an additional hypoxic stimuli during sleep and some training sessions on Hbmass and in turn, total blood volume, was difficult to predict.
Methods
Participants
Nineteen professional AF players participated in this study, which was approved by the University of Technology, Sydney (UTS) Human Research Ethics Committee. All players provided written informed consent. The final sample of players from which the data were drawn for analysis is detailed in the results section. Prior to inclusion into the study, players were examined carefully by a sports physician and were deemed to be free from illness/injury. All players lived at low altitude and were not acclimatised prior to the study. To ensure adequate iron stores for accelerated erythropoiesis, all players (except for two whose serum ferritin levels exceeded normal range) were prescribed with a daily iron supplement (Ferrograd C: containing 325 mg dried ferrous sulphate, 562.4 mg sodium ascorbate, Abbott Australia, Botany Bay, Australia) for 2 weeks prior to and throughout the duration of the 2-week camp.
Experimental overview
A parallel two groups, randomised matched, longitudinal (pretest, midtest, post-test) design was used. Players between each group were matched according to their performance (Yo-Yo Intermittent Recovery test level 2 (Yo-YoIR2)), playing experience and playing position prior to allocation. The study was conducted immediately following the off-season period (4 weeks after the end of the previous competitive season) and consisted of an experimental 2-week training camp (Qatar—October 2011, usual off-season training plus heat (all players) and hypoxic (some players) exposure) followed by another 1-week training camp (Abu Dhabi—November 2011, unloaded training at sea level under temperate environmental conditions for all players) and then 2 weeks of unsupervised training (Melbourne, normal environmental conditions; figure 1). The temperature in Melbourne the week before the camp averaged 15°C (http://www.wunderground.com/history/airport/YMML/2011/10/17/WeeklyHistory.html). During the initial 2-week training camp (Qatar), all players participated in outdoor AF-specific skills and indoor strength sessions (figure 1). In addition, they slept (12 nights) and cycled indoors (‘interval cycling’ sessions: (10–15 maximal effort repetitions of 15–30 s)×3–5 sets14) in either normoxic air (NORM, n=9) or normobaric hypoxia (FiO2, 15.2–14.3%, corresponding to a simulated altitude of 2500–3000 m, HYP, n=10). The second phase of the camp (Abu Dhabi) included only skills and strength sessions, and all players slept in normoxia. The unsupervised training period (Melbourne) was composed of two resistance and three high-intensity running (10 reps of 100–300 m runs at 70–80% of maximal sprinting speed) sessions each week. Players could drink ad libitum during all training sessions, and were provided with a post-training nutrition plan developed by a nutritionist to ensure adequate fluid and nutrient intake between the sessions.

Study overview. Experimental schedule, training load and contents during the experimental camp (Camp) and the following weeks in players in the hypoxic (HYP) and normoxic (NORM) groups. T: travel. (1)Except for walking and skill sessions, which were performed in the heat for both groups (32±1°C), all training contents were performed under temperate environmental conditions (22±1°C). (2)Except for the cycling sessions, which were performed in normobaric hypoxia for the HYP group (equivalent to 2800 m), all training contents were performed in normoxia. In addition, players in HYP slept and had their social time in hypoxia (equivalent to 2500–3000 m). Haemoglobin mass (Hbmass) and blood volume (BV) were measured in Australia (AU) before and after the trip, and in Qatar (QA) at the start and end of the Camp with similar methods and materials (see methods). Blood: refers to haematological measures such as haematocrit levels and iron status. Yo-Yo IR2: Yo-Yo Intermittent recovery test level 2; CMJ: counter movement jump, 5 min: submaximal running test. There was no clear difference in training load between the two groups (see Results section).
To examine the effect of the off-season training camp on high-intensity intermittent running performance in temperate conditions, players performed the Yo-YoIR223 on an indoor field in the morning at the start (precamp (Pre), day 1), mid-camp (mid-camp (Mid), day 7), at the end (postcamp (Post), day 14) and 4 weeks after the start of the camp (4WPost, day 40; figure 1). The test was preceded by a standardised 5 min submaximal run on the indoor field, where heart rate (HR—Polar Team 2.1.4.1, Polar Electro Oy, Kempele, Finland) was monitored to assess submaximal running performance (submax HR).24 HR was also monitored during the Yo-YoIR2. To assess the heat acclimation responses to the off-season training camp, players performed a heat response test in the afternoon at the beginning (day 1) and at the end (day 14) of the camp (figure 1). Jumping performance was assessed Pre and Post. Haemoglobin mass (Hbmass) and blood volume (BV) were measured at Pre, Post and 4WPost. Finally, training load was estimated for all players as follows: training duration×session rating of perceived exertion (RPE).25
Heat exposure
Players were exposed to heat when walking from/to the training facilities (∼15 min), during all skill sessions and outdoor recreation time. Exposure time was carefully recorded (±1 min), and temperature and relative humidity (RH) were measured at the start of each training session with a Kestrel 4500 Pocket Weather Tracker (Nielsen-Kellerman, Boothwyn, Pennsylvania, USA). Skills sessions were performed on a natural grass training pitch (ie, 120×150 m).
Hypoxic exposure
The training, sleeping and recreational hypoxic facilities were normobaric rooms with O2 filtration (CAT system, Colorado Altitude Training, Louisville, Colorado, USA). Three days prior to the study start, all hypoxic rooms were calibrated by qualified engineers. During the Qatar camp, players were blinded towards the environmental condition to which they were exposed (both for sleeping and training times). However, they were informed about the treatment they received after the last testing session at the Qatar camp based on the coaches’ decision for motivational purposes. During sleeping/day times, players in the HYP group were exposed to a normobaric hypoxia equivalent to 2500 m (FiO2 15.2%) for the first 2 days/nights of the intervention period. Thereafter, the O2 fraction was decreased to the equivalent of 2800 m (FiO2 14.6%, 2 nights) and 3000 m (FiO2 14.3%, rest of the camp). Participants were confined to their rooms from 16:00 to 19:00, 20:00 to 06:00 and 08:00 to 10:00 during these 2 weeks. However, they were encouraged to spend more time in their rooms if desired (but this was not recorded). During all cycling sessions, the HYP group was exposed to normobaric hypoxia equivalent to 2800 m. Owing to logistic constrains, SaO2 was not measured.
High-intensity intermittent running performance
The Yo-YoIR2 test23 was used to assess high-intensity intermittent running performance. All players were familiar with this test, as it was part of the regular fitness testing battery implemented by the club. Briefly, the Yo-YoIR2 consists of repeating 20 m shuttle runs at increasing speeds (starting at 13 km/h) with 10 s of active recovery (consisting of 5 m of jogging) between runs until exhaustion. The highest HR reached during Yo-YoIR2 (5 s average) at Pre was retained as maximal HR (HRmax).
Submaximal running test
The 5 min running test was performed indoors under controlled environmental conditions before the Yo-YoIR2 during the experimental camp. For convenience, all players were tested together with the intensity of the 5 min submaximal exercise bout fixed at 13 km/h over 40 m shuttles (adapted from ref. 24). Mean HR during the last 30 s of the 5 min exercise period was calculated and termed exercise HR (HRex). The coefficient of variation (CV) for day-to-day variations in HRex is 3.4%.24
Heat-response test
Pre and Post heat-response tests were performed at the same time-of-day.8 Players rested in a seated position for 30 min before the test (laboratory temperature ∼21°C) during which time they were instrumented. Thereafter, they entered the climate chamber (44°C, 44% RH; Tescor, Warminster, Pennsylvania, USA) to perform 24 min of walking at 5 km/h (1.39 m/s, 1% grade) on a treadmill (Cosmed T170, Rome, Italy), followed by 24 min of seated rest. No fluids were consumed during the test. HR was also continuously recorded (Polar Team2 1.4.1, Polar Electro Oy, Kempele, Finland). Sweat loss was calculated as the difference in pretest and post-test body mass as measured using a calibrated electronic scale (weighed in underwear, body dried; Seca, Germany). Sweat samples were collected for the duration of the test through an absorbent pad with protective dressing (Tegaderm+Pad, 3M Health Care, Borken, Germany) positioned on the back (at the level of the right shoulder) of the participant. The skin was cleaned with deionised water prior to application of the pad. Samples were analysed for sodium concentration ([Na+]sweat; Dimension Xp and Plus, Siemens, Munich, Germany).
Jumping performance
Countermovement jumps (CMJ) were used to estimate explosive strength. The players had been familiarised with this test prior to the study. Prior to testing the players performed a standardised dynamic warm up followed by three submaximal practice jumps. The players then performed three maximal CMJs, with a 2 min rest between each. All CMJ's were performed with hands held firmly on the hips and participants were instructed to jump as high as possible. The jumps were performed with a self-selected countermovement depth and the jump with the highest score was used for further analysis. All CMJ's were performed on a commercially available force plate (400 Series Performance Plate—Fitness Technology, Adelaide, Australia) connected to a computer running software (Ballistic Measurement System—Fitness Technology, Adelaide, Australia) that recorded vertical ground reaction forces at a rate of 200 Hz. Jump height (cm) was calculated using custom-designed software (Mathworks, Natick, Massachusetts, USA).
Haematological measures
Transferrin and ferritin were measured prior to the camp using the Siemens Advia System (Siemens Ltd, Bayswater, Australia) in a commercial ISO accredited pathology laboratory (Healthscope Ltd, Clayton, Victoria, Australia). Serum iron levels were determined using ferrozine complex spectrophotometry (Siemens Advia 2400, Siemens Ltd, Erlangen, Germany). Ferritin levels were determined using chemiluminescent immunoassay (Siemens Advia Centaur XP, Siemens Ltd, Erlangen, Germany). Other haematological variables were collected using the same technique and similar equipment in Australia and Qatar. However, to ensure accurate comparisons, data were only compared from within the same laboratory (ie, Australia versus Australia and Qatar versus Qatar). Both measures were considered as baseline values, and data postcamp (Qatar) and 4 weeks later (Australia) were therefore expressed as relative changes from their original baseline. Hbmass was assessed using the optimised carbon monoxide (CO) rebreathing procedure first described by Schmidt and Prommer.26 This comprised inspiration of a bolus of 99.5% pure CO (BOC Gases, Sydney, Australia) in a dose of 1 mL/kg of body mass that was rebreathed for 2 min. A CO sensor (Draeger PAC7000, Draeger, Luebeck, Germany) was held in proximity to the mouth throughout the test to check for leaks. Fingertip capillary blood samples (200 μL) were analysed in triplicate for per cent carboxyhaemoglobin (%HbCO) using a spectrophotometer (ABL80 Hemoximeter, Radiometer, Denmark) before as well as 7 min after starting rebreathing. The CO rebreathing procedure provides an accurate and reliable method of measuring Hbmass with a low typical error of ∼2% in our laboratory (ie, 1.7% (90% CI 1.2% to 3.2%). From the Hbmass we calculated BV, red blood cell volume (RCV) and PV according to the following formulas. Haemoglobin concentration (Hb) and haematocrit (Hct) were determined from venous blood samples (Sysmex Corp, Kobe, Japan).

Statistical analyses
Data are presented as means (±SD) and correlations as means (90% confidence limits, CL). All data were log-transformed for analysis to reduce bias arising from non-uniformity error and then analysed for practical significance using magnitude-based inferences.27 We used this qualitative approach because traditional statistical approaches often do not indicate the magnitude of an effect, which is typically more relevant to athletic performance than any statistically significant effect. The chances that the changes in performance or physiological variables were greater for a group or a time point (ie, greater than the smallest worthwhile change, SWC (0.2 multiplied by the between-subject standard deviation, based on Cohen's d principle)), similar or smaller than the other group or another time point were calculated. Quantitative chances of greater or smaller changes in performance or physiological variable were assessed qualitatively as follows: >25–75%, possible; >75–95%, likely; >95–99%, very likely; >99%, almost certain. If the chance of having beneficial/better or detrimental/poorer performances were both >5%, the true difference was assessed as unclear. Since changes in high-intensity running performance might be influenced by baseline training status, changes in Yo-YoIR2 were systematically adjusted for baseline Yo-YoIR2 performance. In a separate analysis, changes in Yo-YoIR2 were also adjusted for changes in CMJ performance (which is likely important for high-intensity running performance including changes of direction). Pearson’s product–moment correlation analysis was also used to investigate the association between all variables. The following criteria were adopted to interpret the magnitude of the correlation (r) between the different measures: ≤0.1, trivial; 0.1–0.3, small; > 0.3–0.5, moderate; > 0.5–0.7, large; > 0.7–0.9, very large and >0.9–1.0, almost perfect. If the 90% CL overlapped positive and negative values, the magnitude were deemed unclear; otherwise that magnitude was deemed to be the observed magnitude.27 Finally, individual responses to the intervention were calculated from the square root of the variance in the differences in the change scores in the HYP and NORM groups.27 A positive value represents greater individual responses to the HYP treatment. A negative value indicates more within-subject variation in the NORM group than in the HYP group.
Results
Participants
Two players missed at least one training/testing session and were excluded from the final analysis. Therefore, 17 players (n=8 and 9 for NORM and HYP, respectively) were considered for analysis. There was no clear difference at baseline (ie, Pre) between the two groups for any anthropometric and performance measures (table 1).
Subjects characteristics at baseline
Training load
During the camp, players participated in 10 outdoor AF-specific skills (32±1°C (range 33−29°C), 39±5% RH (range 37−50%), total exposure time=11.5 h), 7 ‘interval cycling’ sessions (22±1°C, 58±2% RH, total=4.3 h) and 8 indoor strength (23±1°C, 57±2% RH, total=9.3 h) sessions. Additionally, all players received a total of 15 h of incidental heat exposure (7.5 h/week, walking from/to the training pitch and sightseeing). For HYP, total hypoxic exposure (sleep+cycling sessions) was 14±1 h/day. The unloaded training week included four skills (≈29°C, ≈55% RH) and seven strength (indoor) sessions for a total of 10.5 h for all players. During the unsupervised period all players reported that they completed each prescribed training session. As illustrated in figure 1, there was no clear difference in total training load between both groups during the experimental camp (9786±286 vs 9904±200 training units for HYP versus NORM, respectively, −1%, 90% CL (−3;1), ES=−0.45 90% CL (−1.25;0.35) and chances for greater/similar/lower values of 9/21/71) and the following week (3859±879 vs 4323±835 training units for HYP versus NORM, receptively, −11% (−27;8), ES=−0.49 (−1.30;0.31), 8/19/73).
Changes in performance measures
Both groups showed very large and almost certain improvement in Yo-YoIR2 at Mid (+25% (20;30), ES=+1.4, 100/0/0) and at Post (+44% (38;50), ES=+2.3, 100/0/0; figure 2), with unclear between-group differences in the changes (eg, Δ Pre vs Post: −1%(−9;9), 21/52/27 for HYP vs NORM, figure 3). At 4WPost however, there was a possible better maintenance of Yo-YoIR2 performance in HYP compared with NORM (+6%(−2;15), 67/31/2; figure 3). Individual responses for Yo-YoIR2 performance were ∼ +7% and −5% at Post and 4WPost, ∼1/6 of the mean change in both groups. Individual responses from Post to 4WPost were ∼+2%, approximately 1/3 of the mean change in the NORM group.
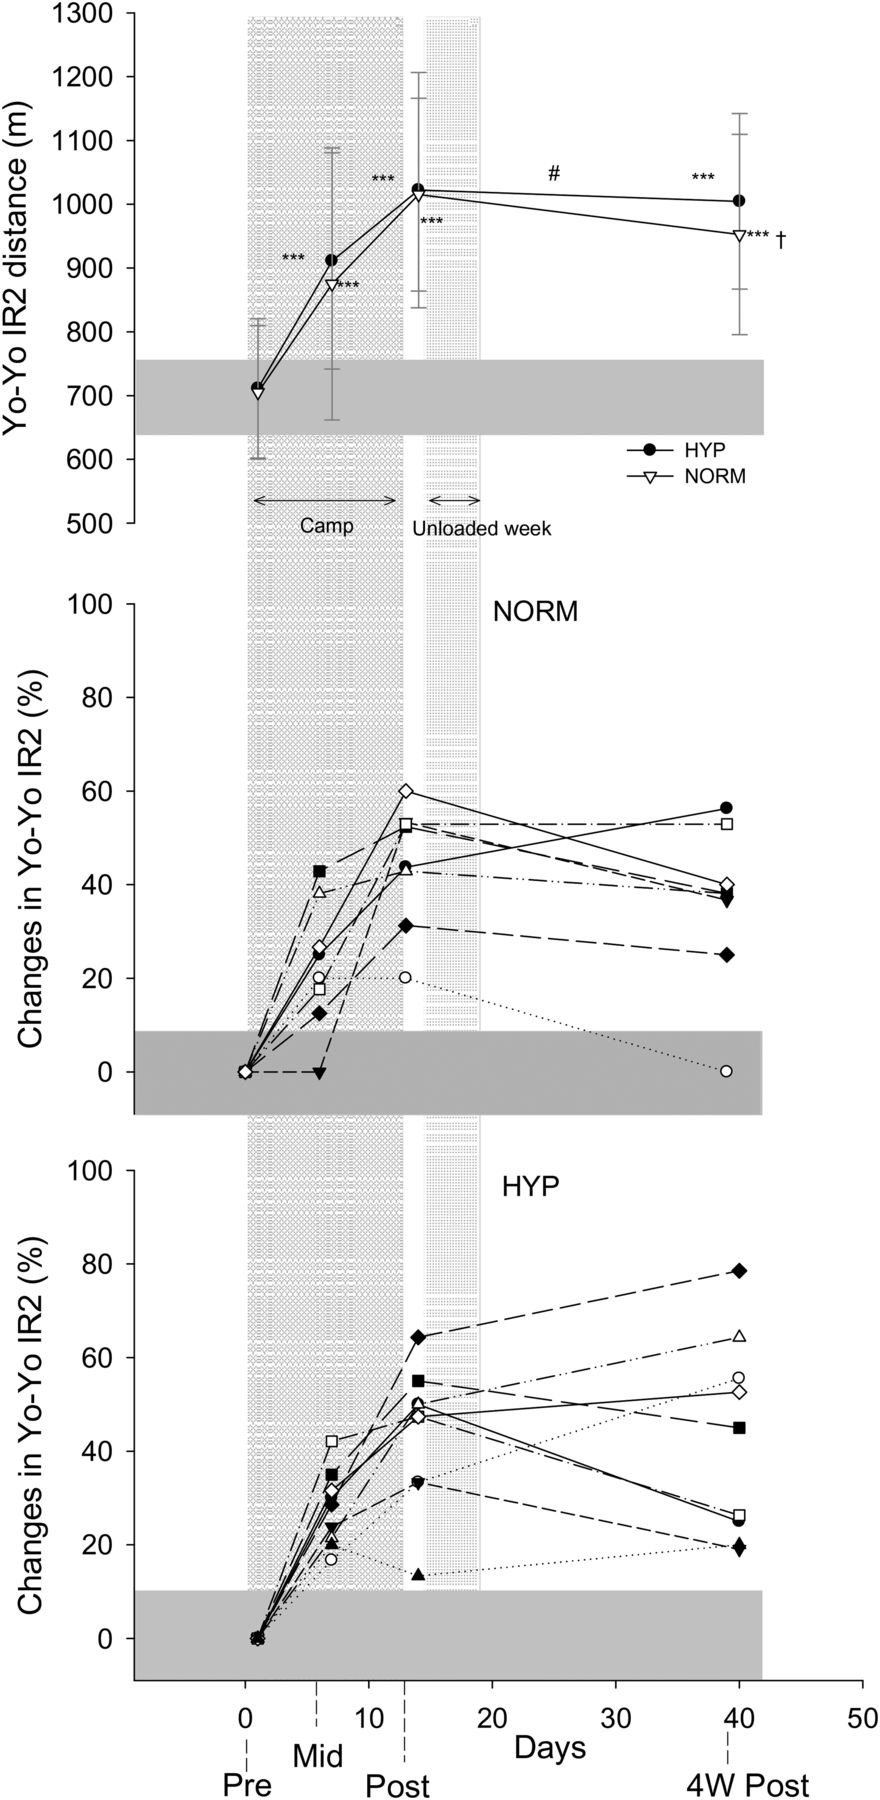
Performance responses to the camp. Mean (SD) values (upper panel) and individual relative changes (middle and lower panel) in Yo-YoIR2 during the camp and the following 4 weeks in players belonging to the normoxic (NORM) or hypoxic exposure (HYP) groups. ***, Almost certain within-group difference versus Pre (ie, day 0). †, Likely within-group difference versus Post (ie, day 13). #, Possible between-group difference in the change (4WPost vs Post). The grey horizontal area represents the typical error of measurement of the test (ie, 10%23).

Comparison of the performance and physiological responses to both interventions. Differences in the changes in Yo-Yo distance (Yo-YoIR2), counter movement jump (CMJ), submaximal heart rate during the 5 min run in normoxic conditions (HRex), average heart rate, sweat loss and sweat sodium concentration ([Na+]sweat) during the heat response test, plasma volume (PV), haemoglobin mass (Hbmass) and blood volume (BV) for hypoxic (HYP) versus normoxic (NORM) group. The shaded area represents trivial differences in the changes (see Methods section).
At Post, there was a possibly greater improvement in jumping height for HYP compared with NORM (+5%(−1;10), 83/13/3 for HYP vs NORM; figure 3). The between-group difference in the change in jumping height at 4WPost was unclear (+2%(−7;12), 54/22/24 for HYP vs NORM). Individual responses were 2% greater for the NORM group at Post, ∼1/2 the mean change in the NORM group. Individual responses from Post to 4WPost were ∼−5%, approximately twice the mean change in the NORM group.
When changes in Yo-YoIR2 were adjusted for changes in CMJ, the main results were unchanged at Post (changes in HYP vs NORM, adjusted ES=−0.3(−0.9;0.4), unclear). At 4WPost, the maintenance of Yo-YoIR2 performance was more apparent when adjusted for changes in CMJ: changes in HYP versus NORM, adjusted change=+11% (1;21), adjusted ES=+0.5(0.1;1.0), 88/11/1 rated as likely (as compared with ‘possibly’ without adjustment, see above).
HRex decreased almost certainly and very largely at Mid (ES=−5.5(−7.0;−3.9) and −1.90(−2.5;−1.4) for NORM and HYP, respectively), and further decreased almost certainly at Post (ES=−1.7(−2.6;−0.9) and −1.0(−1.5;−0.5) versus Mid for NORM and HYP, respectively). There was however no clear between-group difference in the changes, either at Mid or Post (figure 3). Individual responses for HRex were ∼−2% at Post, ∼1/4 the mean change in both the groups.
Heat response test
Both groups showed a large decrease in average HR during the heat response test after the camp (109±6 vs 99±7 bpm for Pre versus Post, respectively; −10% (−12;−2), ES=−0.9, 100/0/0), with unclear between-group differences in the changes (eg, Δ Pre vs Post: +4.0% (−2.2;10.6), 75/15/10 for HYP vs NORM; figure 3). Individual responses were ∼5% greater for the NORM group at Post, ∼1/2 the mean change in HR in the NORM groups.
Similarly, both groups showed a large decrease in [Na+]sweat Post (79.4±23.1 vs 57.9±20.2 mmol/L for Pre vs Post, respectively; −29% (−37;−19), ES=−1.0, 100/0/0), with unclear between-group differences in the changes (eg, Δ Pre vs Post: +18% (−12;58), 69/28/8 for HYP vs NORM; figure 3). Individual responses for [Na+]sweat were ∼28% greater for the NORM group at post, and corresponded to ∼2/3 of the mean change in [Na+]sweat in both groups.
However, there was no clear Post difference in sweat loss compared with Pre (0.66±0.02 vs 0.69±0.02 L for Pre vs Post, respectively; −1.5% (−16;−15), ES=−0.0, 24/44/33), with unclear between-group differences in the changes (eg, Δ Pre vs Post: +5.3%(−23;43), 50/22/28 for HYP vs NORM; figure 3). Individual responses for sweat loss were ∼38% greater for the HYP group at Post, and corresponded to eight times that of the mean change in sweat loss in both groups.
Changes in haematological variables
Both groups showed a likely (HYP, ES=+0.5 (−0.1;1.1), 79/17/4) and very likely (NORM, ES=+0.8 (0.3;1.2), 97/3/0) increase in PV at Post (figure 4), with unclear between-group difference in the change (figure 3). At 4WPost however, PV was very likely further increased in HYP (ES=+2.2 (0.4; 3.9) vs Pre, 96/2/2), while it tended to return to baseline in NORM (ES=+0.4 (−1.5; 2.4) vs Pre, 58/13/28; figure 4). The increase in PV in HYP was however not clearly greater than in NORM at 4WPost (+6% (−5;18); figure 3). Individual responses for PV were ∼1% and ∼10% greater for NORM than for HYP at Post and 4WPost, respectively, which corresponded to ∼¼ and ∼1.2 the mean change in the HYP group at the same time points.

Hematological responses to the camp. Individual and average (SD) relative changes in plasma volume (PV), haemoglobin mass (Hbmass) and blood volume (BV) during the camp and the following 4 weeks in players belonging to the normoxic (NORM) or hypoxic exposure (HYP) groups. *, Likely within-group difference versus Pre (ie, day 0). **, Very likely within-group difference versus Pre (ie, day 0). ##, Likely between-group difference in the change. The dashed horizontal lines represent the typical error of measurement in our laboratory (ie, ∼2% for Hbmass and 5% for PV and BV). Note that the values were doubled checked for the outlier for PV-BV in the NORM group (30–25% increase), so that it was not removed. However, if this individual was removed, the differences between the groups would be greater, which suggest that the already substantial between-group differences are unlikely the consequence of this extreme value.
Hbmass did not change in NORM (figure 4, all changes rated as unclear). Conversely in HYP, Hbmass was likely (ES=+0.3 (0.6;0.5), 77/23/0) and very likely (ES=+0.7 (0.3;1.1), 97/3/0) increased at Post and 4WPost, respectively (figure 4). Therefore, there was a likely greater increase in HYP than in NORM both at Post and 4WPost (eg, +4.6% (0.0;9.3) at 4WPost, 86/12/2; figure 3). Individual responses for Hbmass were ∼2.5% greater for the HYP group both at Post and 4WPost, ∼1/2 of the mean change in the HYP group at the same time points.
Regarding BV, both groups showed a likely (HYP, ES=+0.5 (0.0;1.0), 88/11/1) and very likely (NORM, ES=+0.8(0.3;1.3), 97/3/0) increase at Post (figure 4), with unclear between-group difference in the change (figure 3). At 4WPost however, BV was very likely further increased in HYP (ES=+1.3 (0.5;2.1) vs Pre, 98/1/0), while it tended to return to baseline in NORM (ES=+0.3 (−0.9;1.6) vs Pre, 55/24/21; figure 4). There was a likely greater BV increase in HYP than in NORM at 4WPost (+5% (−3;14); figure 3). Individual responses for BV were ∼+3 and −7% at Post and 4WPost, ∼1/2 the mean change in the HYP group.
Relationships between variables
There was no clear correlation between changes in Yo-YoIR2 performance and either PV, Hbmass or BV (figure 5). There was no clear relationship between changes in Hbmass and baseline measures.

Associations between variables. Relationships between changes in Yo-Yo intermittent recovery level 2 (Yo-YoIR2) performance and changes in plasma volume (PV, upper panel), haemoglobin mass (Hbmass, middle panel) and blood volume (BV, lower panel) in players belonging to the normoxic (NORM) or hypoxic exposure (HYP) groups. There was also no clear correlation when considering within-group data.
Discussion
This study is the first to describe the performance and haematological adaptations to a combination of heat and hypoxic exposure in professional AF players in an applied training setting. Results showed that (1) large increases in BV and high-intensity intermittent running performance can be observed after 7 days of training (ie, Mid) involving only four skill-based training sessions in the heat, with additional hypoxic exposure providing no additive effect; (2) in this population, the addition of hypoxic exposure during sleep time and some training sessions for a total of 170 h was enough to stimulate erythropoiesis, as shown by moderate-to-large increases in Hbmass (and hence, BV) both immediately and 4 weeks following the camp.
Immediate physiological and performance effects of the live high-train high and low in the heat model
Immediately after the camp, we observed large increases in PV (+5.6%) and decreases in sweat sodium concentration (−29%) and HR (−10%) during the heat-response test, with no between-group difference in the change (figure 4). While a control group training indoor under normal environmental conditions is required to demonstrate the effect of heat training per se, the changes in these later measures were well above the smallest worthwhile change (SWC). This suggests that these changes were meaningful,27 and that players showed clear signs of (at least) partial heat acclimatisation.15 ,28 However, additional measures such as core temperature or sweat loss during the heat-tolerance test8 would be required to appropriately assess the magnitude of heat acclimatisation achieved. The lack of between-group differences in these acclimatisation-related measures was nevertheless expected, since both groups received the same amount of heat exposure throughout the camp. However, individual acclimatisation responses were substantial (ie, two-third of the mean change in [Na+]sweat in both groups). Methods for identifying athletes who are likely to gain substantial acclimatisation effects and how these responses can be optimised has yet to be elucidated.8
At the end of the camp, there was an early and likely 3% increase in Hbmass in the HYP group, while it did not change in the NORM group (difference in the changes=+3.2% (0.8;5.7) for HYP vs NORM). These differences in the changes were well above both the SWC27 and the typical error of measurement in our laboratories (<2%), within the range of usual random variations in athletes (ie, ≤3%29 ,30), and similar to changes observed recently in a similar population (but following a 19-day altitude training camp).12 To our knowledge, this study is the first to show the Hbmass responses to a combined heat+hypoxic training camp in elite team sport athletes and this is the first time that such a substantial increase in Hbmass is reported after such a short period of time, that is, after 170 h (12×14 h/night–day). Our present data also confirm that increases in Hbmass are unlikely linear and that prolonged hypoxic exposure might not be requisite to gain large increases in Hbmass.22 ,31–33 For instance, while it is generally recommended to spend at least 14–22 h/day for more than 3–4 weeks at altitude6 ,34 or to accumulate at least 300 h32), early erythropoiesis may occur within 14 days (with 1431 to 16 h33 of exposure per day) or 21 days (with 10 h of exposure per day22) of LHTL. Factors including athletes’ baseline training status, baseline Hbmass20 ,21 and the severity of simulated exposure22 might explain the present large erythropoietic responses observed and the possible dissimilarities with previous studies. In the current study, most players started the camp with a relatively poor training status compared with their usual fitness levels and had never previously been exposed to hypoxic environments for long periods. While ≈200 h of hypoxic exposure failed to improve Hbmass in elite Nordic skiers (likely hypoxia-acclimatised and already possessing high Hbmass values),35 a similar ‘hypoxic dose’ lead to a 8.5% increase in Hbmass in highly-trained, non-hypoxia-acclimatised, swimmers.18 In these lines, a very large and negative correlation has been shown between Hbmass response to hypoxic exposure and baseline Hbmass.21 The football players in the current study presented low baseline Hbmass values (11 g/kg) compared with elite endurance athletes (>14 g/kg), which lends support to this latter hypothesis. Importantly, in the present study, since there was no change in Hbmass in the NORM group at the end of the camp (despite similar training load than HYP; figure 4), a training-induced increase in Hbmass30 was unlikely.
In the present study, both groups showed very large and almost certain improvement in Yo-YoIR2 at Mid (+25%, ES=+1.4) and Post (+44%, ES=+2.3; figure 2), with no difference between the groups, neither with respect to overall performance changes (figure 3), nor individual responses (ie, ∼1/6th of the mean response). Similarly in both groups, there were very large decreases in submaximal HR (figure 3). While we cannot discount the effects of jet lag/travel fatigue on baseline measures, and a subsequent overestimation of the training camp-induced changes,36 this was likely similar for both groups and the between-group comparisons were unlikely affected. It is also worth noting that the magnitudes of the changes in Yo-YoIR2 performance and HRex were substantially greater than both the SWC27 and the day-to-day variability for both the Yo-YoIR2 (ie, 10%23 and submaximal HR (ie, 3%24). These changes in running performance were also very large compared with what is generally reported within such a limited period of time (ie, 14–52% are generally observed after training periods lasting at least 6−8 weeks23). Additionally, while acknowledging that only regular testing sessions (eg, every second week) would allow definitive conclusions on the exact time course of adaptation, the changes in YoYoIR2 performance following the present training camp was similar to that generally observed after 3 months of training in this group of AF players (unpublished club historical data). Changes in HRex (−8%) were also clearly greater than the SWC27 and those reported in highly trained young handball players following a 2-month high-intensity training intervention (a total of 16 sessions), which resulted only in a 5% decrease in HRex.37 Finally, the present data are consistent with recent studies that showed substantial improvement in either high-intensity cycling (ES=+0.3 for work on a 60 min time trial11), submaximal (ES=−0.9 for HRex in well-trained soccer players7), swimming (ES ∼ −0.8 for 400 m freestyle time9) and high-intensity intermittent running performance (ES=+0.4 for Yo-YoIR Level 1 in well-trained soccer players7) in temperate conditions following short-term heat training programmes (ie, 5,7 89 and 1011 days). The likely greater changes in performance in the present study compared with the previous soccer study7 (as inferred from ES values) might be due to the present study being performed immediately following the off-season period (ie, 4 weeks following the previous competitive season, and not in-season as has previously been described7). Moreover, in addition to the skills training sessions, the players in the present study also performed strength and cycling interval sessions (figure 1), which may have accelerated the performance adaptations independently of heat exposure.38 The greater increase in jumping performance in the HYP group (figure 3) was unexpected given the similar strength training programmes for both groups (figure 1). Importantly for the present study, however, adjusting the changes in Yo-YoIR2 performance for jumping performance did not modify the interpretations of the findings. This suggests that the differences in neuromuscular function between the two groups did not directly influence the changes in high-intensity running performance. Present data confirm therefore that within no more than a week of training in hot temperatures (32±1°C (range 33−29°C), 39±5% RH (range 37−50%)) for only 11.5 h, irrespective of the hypoxic stimulus, there were substantial ergogenic benefits for team sport players when tested in temperate conditions.7
The observation that there was no clear additional performance benefits for the HYP group is an important finding of the present study, and is consistent with the concept that a minimal ‘hypoxic dose’ has to be prescribed to observe meaningful changes in physical performance (ie, generally more than 3−4 weeks34 or a total of ≈300 h32). We also suggest that in comparison with the heat acclimatisation-induced effects, the 3% increase in Hbmass in the HYP group was too small to substantially alter more both maximal oxygen uptake and high-intensity running performance.39 This conclusion is further reinforced by the blinding of the players toward the intervention (ie, for sleeping and cycle interval training), so that a placebo effect during the post-tests was unlikely in the HYP group.40 ,41 The mechanisms by which high-intensity running capacity was improved following the camp however remains unclear with present measures, since we did not observe any significant association between the changes in either PV, BV or Hbmass and Yo-YoIR2 performance (figure 5). It is therefore possible that other mechanisms (not measured here) may also explain the performance benefits of heat acclimatisation. While the present results are of great relevance for many team sport athletes since such hot environmental conditions can be found in most countries during the spring/summer periods, they also provide new information in that additional hypoxic exposure had no acute benefit on either submaximal HR response or high-intensity running performance within such a short period (ie, <2 weeks). Despite the likely beneficial physiological adaptations observed (ie, increased Hbmass), present results directly question the efficacy of using hypoxic exposure for obtaining short-term performance benefits in team sport athletes (eg, preparation for competition at sea level). The data detailed below however suggests that hypoxic exposure might augment chronic training effects.
Delayed effects of the live high-train high and low in the heat model
Twenty-six days (∼4 weeks) following the camp, we observed moderate-to-large increases in Hbmass and BV in the HYP group, while all blood variables were back to baseline values in NORM (figure 4). The very likely 6% increase in Hbmass 4 weeks after the camp (figure 4) was well above both the SWC and the typical error of measurement in our laboratories (<2%), and within the range of usual random variations in athletes (ie, ≤3%29 ,30). Additionally, this 6% increase was similar to the ≈5% increase generally reported following either classic altitude or live high-train low (LHTL) programmes.6 ,34 ,42 The present study is the first to show the time course of Hbmass responses following a combined heat+hypoxic training camp in team sport athletes. In addition, the observation of greater Hbmass values 4WPost (figure 4) is a unique observation, irrespective of the hypoxic stimulus and/or athletes considered. It should be acknowledged that the lack of a clear control of training load during the postcamp period is a limitation of the present study. However, the players from both groups, as professional team sport athletes, reported good adherence to the unsupervised training period and, as such, no between-group differences in training loads were apparent. Additionally, the magnitude of the observed increase in Hbmass in the HYP group (ie, 3% in 4 weeks) was likely greater than any possible between-group difference in the training effect on Hbmass (a 1% change in Hbmass for a 10% difference in training load30), and there were no substantial changes in Hbmass in the NORM group. Taken together, these data suggest that the observed Hbmass increase in the HYP group might be related to a delayed erythropoiesis consecutive to the first camp, which might have been potentiated with the initial heat exposure. The prolonged Hbmass increase following the camp is particularly surprising given the reduced training load during the postcamp period (figure 1), which may be expected to be associated with a slightly decreased Hbmass.30 Data on Hbmass changes following hypoxic exposure differ, with authors reporting either a further increase that may last a week,31 ,43 or an immediate decrease32 leading to prealtitude values within 4−6 weeks.43 ,44 Irrespective of the possible reasons for these changes in Hbmass, the higher values 4WPost in the HYP group likely explains the maintenance of blood volume (with respect to haemoconcentration normalisation), despite the absence of heat exposure during this period (figure 4). The present observations also confirm that physiological responses to hypoxic exposure45 are highly individual and likely dependent on the individual psychophysiological characteristics of each athlete (ie, the individual responses in both Hbmass and BV were ∼1/2 of the mean change in the HYP groups). The present results also show that in an applied setting with elite team sport players, the long-term physiological effects of a short training block in the heat may be limited. Indeed, in comparison with the end of the heat exposure period, PV decreased in the NORM group 4WPost (figure 4). While PV increased further in the HYP group 4WPost, this increase was relatively (ie, compared with changes in the NORM group) lower than that for BV. The increased PV was therefore more likely related to the increase in Hbmass and compensatory fluid adjustments aimed at regulating blood hemoconcentration rather than heat-induced mechanisms. It is in fact possible that the performance benefits dissipate as acclimatisation-induced mechanisms normalise. Although such information is limited for heat exposure in elite team sport players, the characteristic adaptations to heat have been shown to return to normal values ∼3 weeks following cessation of acclimation exposure.46
In parallel to these hematological changes 4WPost, there was a possible trend for a better maintenance of Yo-YoIR2 performance in the HYP compared with NORM group (figures 2 and 3). Despite large interindividual variations in changes in Yo-YoIR2 performance (figure 2, the SD for 4WPost-Post changes were 32% and 11% for NORM and HYP group, respectively), and the unsupervised training during the postcamps phase, these results are in accordance with empirical observations showing that enhanced physical performances generally occur 2−4 weeks following hypoxic exposure.6 While it could be intuitive that the observed changes in BV provided an ergogenic benefit17 and contributed to the better maintenance of Yo-YoIR2 performance in HYP compared with NORM group, there was no direct association between these variables (figure 5), suggesting that other mechanisms (not measured here) may also explain the delayed performance benefits of the hypoxic exposure.33 ,47 For example, the multifactorial cascade of responses induced by hypoxia including angiogenesis, glucose transport, glycolysis and pH regulation, may partially explain improved high-intensity endurance performance independent of a greater Hbmass.47 Specific beneficial non-hematological factors also include improved muscle efficiency probably at a mitochondrial level, greater muscle buffering and the ability to tolerate lactic acid production.33 ,47 Players in the HYP group also performed seven ‘interval cycling sessions’ in hypoxia during the camp. Despite inconsistencies, training ‘high’ has been suggested to trigger muscle adaptation to compensate for decreased O2 availability during exercise, which can have direct implications for high-intensity intermittent running performance.6 ,14 Additionally, despite the lack of a direct transfer of the hypoxic exposure into improved performance immediately following the camp, the training and environmental stimulus provided in HYP group may have facilitated the training adaptations. This may also explain the better maintenance of Yo-YoIR2 running performance observed 4 weeks after the camp.
Finally, while the hypoxic treatment was blinded to the players during the initial part of the camp, they were informed about the treatment they received after the last testing session of the first camp (based on the coaches’ decision for motivational purposes). Before this occurred however, when questioned 11 of the 17 participants correctly predicted the experimental treatment allocated. Therefore, we are unable to completely rule out the possibility of a placebo effect in explaining the better maintenance of performance in the HYP group 4WPost. Moreover, it is possible that differences in player's individual training load during the 4WPost period could also have affected present results.48
Limitations
One of the primary limitations of the present study was our inability to both examine the independent heat effects, and document training loads during the unsupervised training period. However, all the physiological and performance changes after heat exposure were well above the smallest worthwhile change and the players in each group, as professional athletes, reported that they adhered to their individual programme. We also acknowledge the lack of a clear control of the effectiveness of the blinding.40 Another limitation is related to only having single Hbmass measures at each time point. While duplicate measures would have decreased the possible error of measurement, increasing the number of blood samples was unrealistic with the present population of elite professional players. In contrast, we consider that the elite standard of the players’ and the realistic training setting enhanced the ecological validity of the present investigation of elite players’ training practices.
Practical applications
While the specific effects of sleeping versus cycling in hypoxia, as well as that of a possible placebo effect on changes in performance could not be deciphered, the actual efficiency of such a training camp for the majority of the players still lends support to its implementation during the preseason in team sports. The rapid but likely transient effects of heat training on plasma volume and physical performance show that this training approach could be applied in-season7 or just before a competition in hot ambient conditions.8 Conversely, the delayed effects from hypoxic exposure on haematological variables (and likely physical performance) may be beneficial to either build a physiological base during preseason training or to rebuild it towards the end of the competitive season (at least 2–4 weeks before the competition season6). It is however worth noting that the difference in the maintenance of Yo-YoIR2 performance 4 weeks after the camp was rather small between the two experimental groups (ES=+0.3); the decision to add a hypoxic stimuli during sleeping and some training sessions has therefore to be taken with a cost/benefit approach. Finally, the large between-athlete variability of response and lack of association between change in Hbmass and/or PV, BV and change in Yo-YoIR2 performance imply that factors other than accelerated erythropoiesis and BV expansion contribute to observed performance improvements. Therefore, future work should be conducted to examine the factors that determine the responders from non-responders to heat+hypoxic exposure. This information could then be used to make informed decisions about individualising training/living conditions so that performance and physiological adaptations could be optimised. The proposed actions to individualise training camps include frequent monitoring of the changes in HR-derived measures7 and the utilisation of a heat-response test.8
Conclusion
In summary, a very large increase in high-intensity running performance was observed after only 1 week of training in the heat in elite football players. An additional hypoxic exposure had no immediate performance benefits, despite an increased Hbmass. Moreover, 4 weeks later, hematological variables remained elevated and high-intensity running performance tended to be maintained only in the hypoxic group. Pending confirmatory research, present results suggest that a combination of heat and hypoxic training/exposure might offer a promising ‘conditioning cocktail’ in team sports exercising at sea level in temperate environments. More research is still needed to identify the factors affecting the individual responses and therefore optimise such interventions at the individual player level. Further investigations are also warranted in team sport players to demonstrate the optimal dosing and timing of such heat+hypoxic camps, and to examine how this may translate into competitive match outcomes.
What is known on this subject
-
Hypoxic exposure (live-high, train-low model) can increase haemoglobin mass, especially in athletes with low baseline levels such as team sport players.
-
Short-term heat acclimatisation can increase plasma volume in team sport players.
-
Combined, increased haemoglobin mass and plasma volume improve total blood volume and convective O2 delivery, which can, under some circumstances, improve high-intensity exercise performance.
What is this study adds
-
Preseason outdoor football training in hot ambient conditions induces (at least) partial heat acclimatisation in professional Australian Rules Football players, and is associated with very large improvements in high-intensity running performance.
-
The substantial increases in haemoglobin mass and blood volume observed immediately after a ‘live high-train low in the heat’ camp can last at least 1 month.
-
Compared with training in the heat only, an additional hypoxic stimulus during sleep and some training sessions has no high-intensity running performance benefits immediately after the camp. The possible greater delayed effects of the hypoxic exposure, if any, are only small in magnitude.
Acknowledgments
The authors thank all staff from Aspire Academy and Aspetar for their support during the camp, especially Mohamed Ibrahim Elzain Elgingo and Eric Kimathi.
References
Footnotes
-
Competing interests None.
-
Ethics approval UTS Sydney.
-
Provenance and peer review Not commissioned; externally peer reviewed.