Article Text

Abstract
Introduction Achilles Tendon injuries are common in elite track and field (T&F) accounting for 3.7% of all injuries in 13 international athletics championships (Fedderman, 2014). Achilles Tendinopathy (AT) can affect tendon viscoelasticity and neuromuscular performance (Wang, 2012). UTC is a novel imaging modality that demonstrates potential for the objective assessment of Achilles tendon structure. It reports 4 different echotypes representing different qualities of tendon structure (Type 1: highly stable, Type 2: medium stable, Type 3: highly variable and Type 4: constantly low intensity and variable distribution) (van Schie, 2010). There are 3 UTC studies in 18–23 patients with AT (van Schie, 2010, deVos, 2012, Rosengarten, 2014). There have been no studies of normal tendons in elite athletes and the normal phenotype has not been characterised.
Methods 40 elite British Athletics T&F athletes agreed to participate in a medical screening assessment, to include a UTC scan, greyscale ultrasound (US) scan and VISA-A questionnaire. Athletes had not performed intense physical exercise for 48 h preceding the test. UTC scans were performed by the same clinician using a mounted 10Hz linear US transducer. Each athlete was scanned in a prone position with the ankle maintained at 90 degrees dorsiflexion. UTC analysis quantified the four validated echotypes (Types 1–4) from the most superior aspect of the calcaneus to the soleus insertion to the Achilles tendon. Greyscale US determined maximum tendon diameter, grade of neovascularity and hypoechoic areas. Statistical analysis tested for difference (p < 0.05) in UTC echotype between: Male and Female; aged ≤25 years (yrs) and >25 yrs; currently symptomatic vs asymptomatic; no history vs history of AT; tendinopathic changes on US vs normal US.
Results 22 females (23.0 yrs ± 3.7) and 18 males (25.6 yrs ± 4.5) participated. Seven athletes (3 male and 4 female) had current symptoms of AT with VISA <100. Five additional athletes (1 male and 4 females) had a previous history of AT (all bilateral). There was a significant difference in echotypes 1, 2 and 4 between asymptomatic male and female athletes (*p < 0.05).
UTC Echotypes in Male and Females
There was a significant difference in percentage of Type 3 (p < 0.05) and Type 4 (p < 0.01) echotype in athletes >25 yrs (n = 18) compared with those under 25 yrs (n = 22).
There was no difference in UTC echotype between symptomatic athletes or those with a history of AT compared with asymptomatic athletes or those with no history of AT.
23 Achilles tendons demonstrated US signs consistent with AT. There were no differences in UTC echotype in this group compared with Achilles tendons with normal US.
Discussion This study demonstrates a difference in UTC echotype between elite female and male athletes that has not previously been identified. Oestrogen has an effect on the functional and structural properties of Achilles tendons and other connective tissue (Bryan, 2008, Hobara 2012). Older athletes had an increase in Type 3 and Type 4 echotypes. The incidence of AT is higher, and tendon stiffness reduced, with increasing age (Stenroth, 2012). There was an increase in Type 2 echotype relative to previous work (van Schie, 2010, deVos, 2012, Rosengarten, 2014)). This study imaged the tendon to the calcaneal insertion at which there is an increase in Type 2 echotypes. Unlike the first published paper on UTC(5), there was no difference in UTC echotype between symptomatic tendons or those with a history of AT compared with tendons with no history of AT. There was also no difference in UTC echotype between those tendons with AT features on US and those without. Similarly to other published work on UTC imaging in athletes, the number of tendinopathic tendons in this study was small. Further work is ongoing to characterise the normal phenotype and to prospectively evaluate UTC in load monitoring for individual athletes.
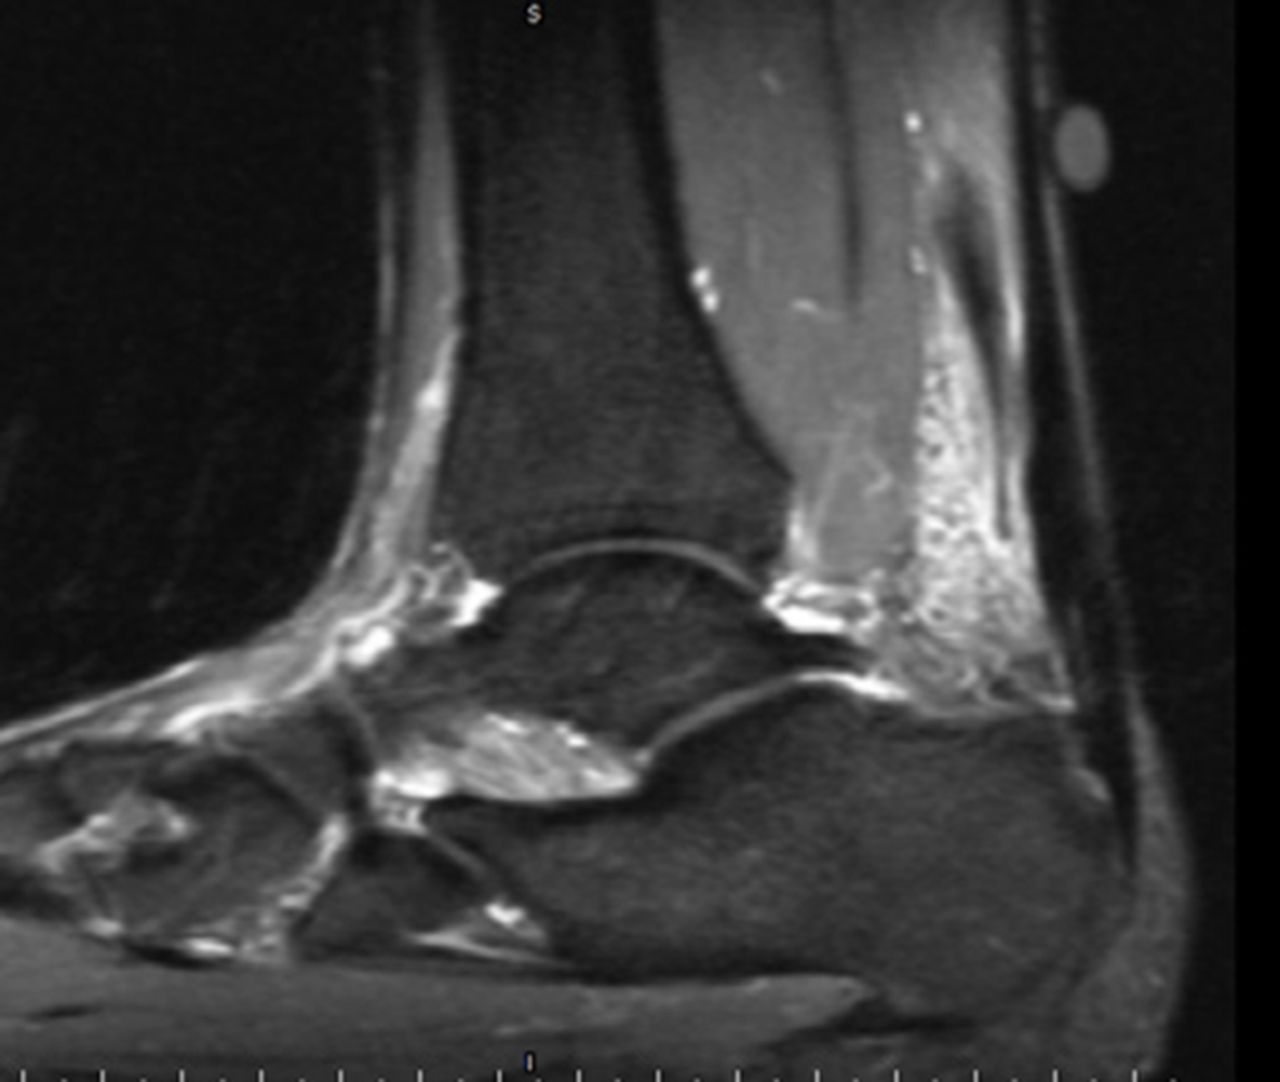
Complete Plantaris rupture

Plantaris ‘Friction’ syndrome
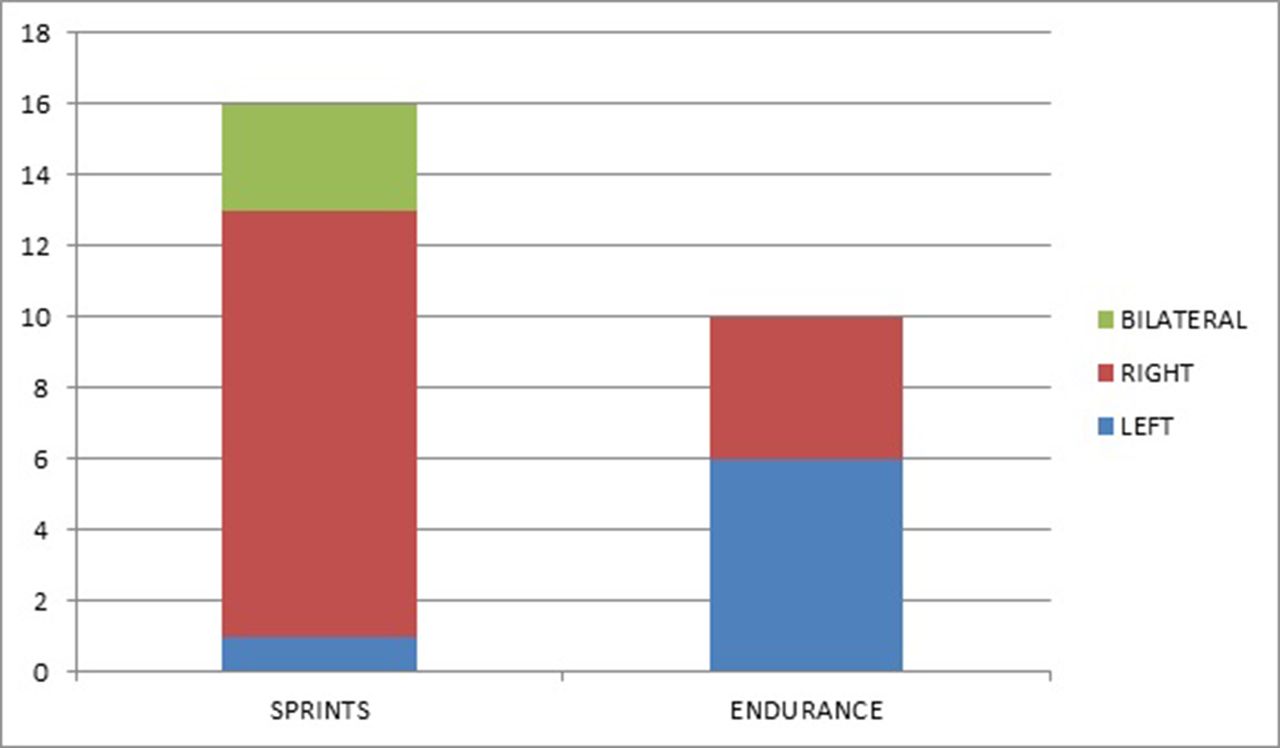
Side of clinical presentation: Sprints vs Endurance
References Feddermann et al. BJSM 48(7):513–22, 2014
Wang HK. Scand JMSS. 22(6):e147–155, 2012
Van Schie et al. BJSM 44(16):1153–9, 2010
De Vos et al. J Sport Rehabil. 21(1):34–43, 2012
Rosengarten et al. BJSM Apr 15 2014
Bryant et al. J Appl Physiol 105(4):1035–43, 2008
Hobara et al. J Biomech 15;45(16):2750–4, 2012
Hansen et al. J Appl Physiol 114:998–1008, 2013
Stenroth et al. J Appl Physiol 113:1537–44, 2012