Article Text

Abstract
Background Information on ice hockey injuries at the international level is very limited. The aim of the study was to analyse the incidence, type, mechanism and severity of ice hockey injuries in men's international ice hockey tournaments.
Methods All the injuries in men's International Ice Hockey Federation World Championship tournaments over a 7-year period were analysed using a strict definition of injury, standardised reporting strategies and an injury diagnosis made by a team physician.
Results 528 injuries were recorded in games resulting in an injury rate of 14.2 per 1000 player-games (52.1/1000 player-game hours). Additionally, 27 injuries occurred during practice. For WC A-pool Tournaments and Olympic Winter Games (OWG) the injury rate was 16.3/1000 player-games (59.6/1000 player-game hours). Body checking, and stick and puck contact caused 60.7% of the injuries. The most common types of injuries were lacerations, sprains, contusions and fractures. A laceration was the most common facial injury and was typically caused by a stick. The knee was the most frequently injured part of the lower body and the shoulder was the most common site of an upper body injury. Arenas with flexible boards and glass reduced the risk of injury by 29% (IRR 0.71, (95% CI 0.56 to 0.91)).
Conclusions The incidence of injury during international ice hockey competition is relatively high. Arena characteristics, such as flexible boards and glass, appeared to reduce the risk of injury.
- Ice hockey
- Epidemiology
- Injury
- Shoulder
- Concussion
This is an Open Access article distributed in accordance with the Creative Commons Attribution Non Commercial (CC BY-NC 3.0) license, which permits others to distribute, remix, adapt, build upon this work non-commercially, and license their derivative works on different terms, provided the original work is properly cited and the use is non-commercial. See: http://creativecommons.org/licenses/by-nc/3.0/
Statistics from Altmetric.com
Introduction
The International Ice Hockey Federation (IIHF), founded on 15 May 1908 in Paris, France, is the governing body of international ice hockey and inline hockey. The IIHF is comprised of 72 member associations, each of which is the national governing body for the sport of ice hockey. The IIHF also presides over ice hockey in the Olympic Games and the IIHF World Championships (WC) at all levels, that is, men, women, junior under-20, junior under-18 and women under-18. Each season, the IIHF, in collaboration with the local organising committee, runs Men's WC in the six different categories. The teams are qualified to the divisions and groups according to IIHF World ranking. Ice hockey is also the biggest team sport in the Olympic Winter Games (OWG).
Each ice hockey team typically consists of 22 players, including two wingers, one centre, two defencemen and a goalkeeper who are usually on the ice at the same time. The active playing time is three periods of 20 min each. In ice hockey, body contact is common and body checking is permitted in the men's game. Ice hockey is also associated with many other potential risk factors, such as unintended collisions, high velocity, rapid changes in direction and traumas from the boards, stick or puck. As a result, a wide variety of injuries ensue.1 Facial injuries and concussion have been reported in epidemiological studies at other levels of the sport including in the National Hockey League (NHL; USA and Canada).2 ,3 However, the risk, type, mechanism and severity of ice hockey injuries at the international elite level have not been well studied.
The purpose of this study was to assess the incidence, nature, causes and severity of ice hockey injuries among IIHF men's WC and Olympic Games between 2006 and 2013.
Methods
During the seven ice hockey seasons between 2006–2007 and 2012–2013 (from 1 July 2006 to 30 June 2013) we registered, with permission from the IIHF, all ice hockey injuries from 32 men's WC (seven WC Tournaments, seven WC Division (Div) I Grade (Gr) A Tournaments, seven WC Div I Gr B Tournaments, two WC Div II Gr A Tournaments, seven WC Div II Gr B Tournaments, two WC Div III Tournaments), one OWG (2010) and eight Olympic Qualification Tournaments. A total of 844 games were played in the 41 Tournaments by 303 Teams (6666 players). A-pool level competitions consisted of 436 games in the eight tournaments played by 124 teams (2728 players).
A Team Medical Personnel Meeting before each tournament allowed the IIHF medical supervisor (MS) to review the definition of the injury, game injury report form (GIR) and the injury report system form (IRS) with the individual team physicians (figure 1).

Injury report system form of the International Ice Hockey Federation.
The definition of an injury was made in accordance with accepted international ice hockey norms. An IRS was completed when one of the following criteria was observed:
-
any injury sustained in a practice or a game that prevented the player from returning to the same practice or game;
-
any injury sustained in a practice or a game that caused the player to miss a subsequent practice or game;
-
a laceration that required medical attention;
-
all dental injuries;
-
all concussions;
-
all fractures.
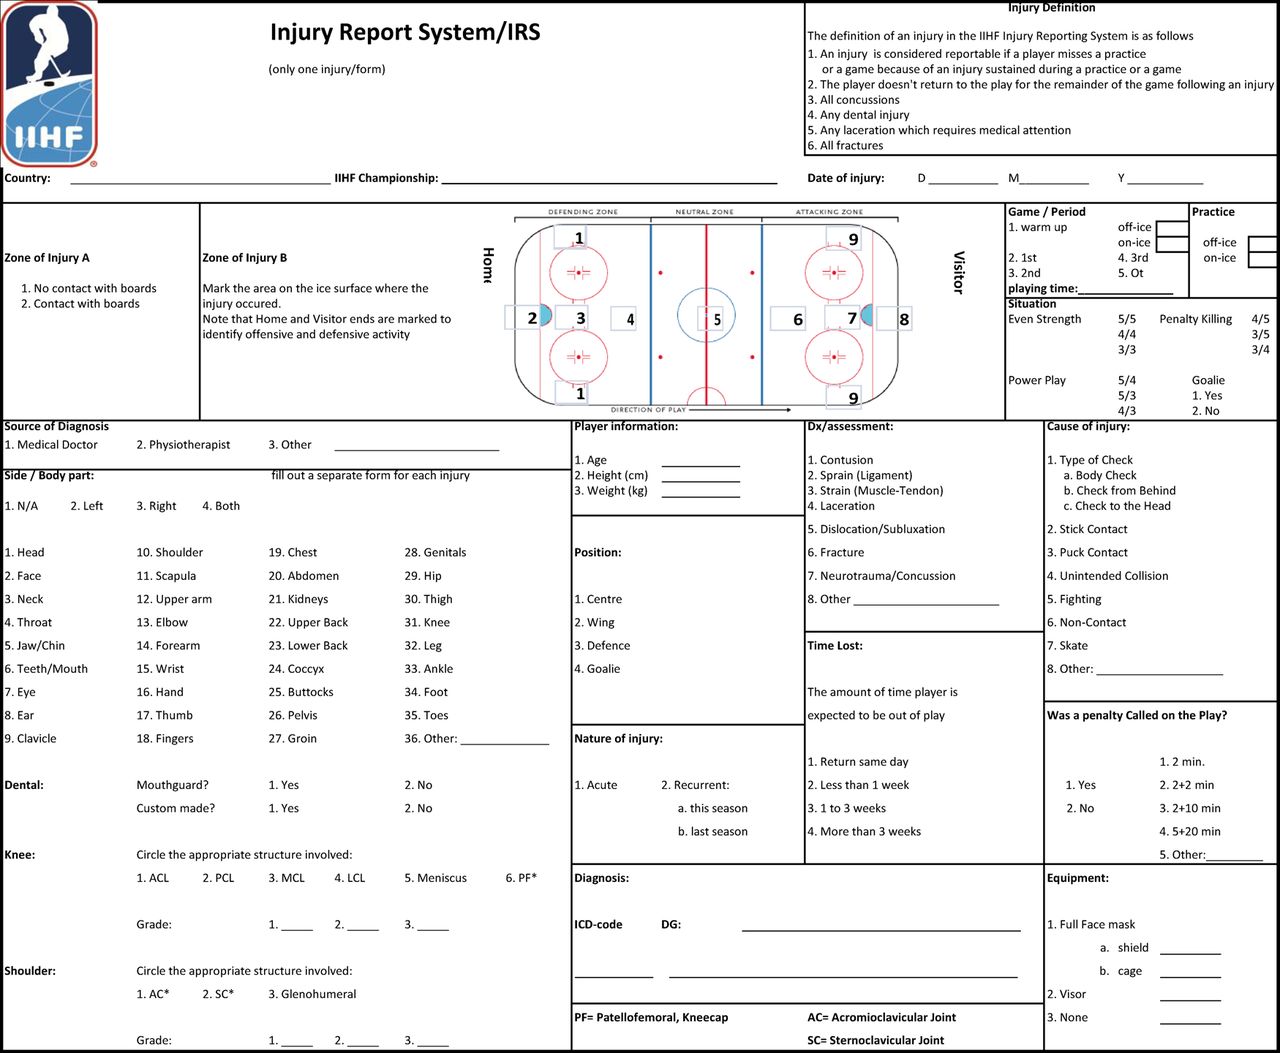
The team physician followed all the players on their team and reported all injuries to the MS using the GIR and IRS forms. Each injury required a separate IRS form and was reported only once. The GIR and IRS forms were both anonymous. The IIHF MS assigned to each championship was responsible for data collection. A GIR form was obtained from each team physician after every game to determine the number of injuries that satisfied the definition (figure 2). An IRS form was completed by the team physician for each individual injury. The IRS form detailed the period, location on ice, mechanism, anatomic location, severity and specific injury diagnosis. The anonymous forms were returned to the IIHF Medical Committee for insertion into a computer-based injury report system for ice hockey injuries (Medhockey).

Game injury report form of the International Ice Hockey Federation.
Injury rate (IR) was expressed as the number of injuries per 1000 ice hockey player-games and per 1000 player-game hours. These two different injury rate definitions were used to allow comparison with other IIHF championships, hockey leagues and sports (football, soccer).
The number of player-games was based on 22 players competing for each team in a game. The player exposure to injury was determined by collective playing time; that is, all the players of the team were participating in the game, had an impact in the game and were at risk for injury during every moment of the game event. When calculating the incidence all the players of the team were included in the denominator.
The player-game injury rate was an average risk of one individual player per 1000 games (# injuries/# players (two teams)/# games×1000=injuries per 1000 player-games). The injury rate for 1000 player-game hours was based on a 60 min active game with five players and a goalie per team on the ice at the same time (# injuries/# players on ice same time (two teams)/# games×1000=number of injuries per 1000 player-game hours).
The given injury rates refer to game injuries only (practice injuries excluded). In the present study, the subgroup ‘flexible board and glass’ was collected from the tournaments where boards comparable to those of NHL were used. The more flexible boards and glass were developed to improve player safety. To determine the association between the arena characteristics and occurrence of injuries, Poisson and Logistic regressions were used. Logistic regression was used when the number of the analysed injuries in each game was zero or one. In other statistical analyses, Poisson regression was applied to allow for several injuries per game. In these analyses, weighting with standardise active playing time was employed. Generalised estimating equations were used to determine association between the concussion and player position in A-pool tournaments.
Results
Incidence of injuries
During the study period, 528 injuries in 511 incidents were reported in 844 games. Additionally, 27 injuries occurred during the practices. The injury rate per 1000 ice hockey player-games was 14.2 for all men's WC and the annual injury rate ranged between 12.2 (2011) and 17.5 (2008). For WC A-pool tournaments and OWG the injury rate was 16.3/1000 player-games and the annual injury rate ranged between 10.3 (2013) and 20.6 (2008). Injury rate per 1000 player-game hours was 52.1 for all men's WC and 59.6 for men's WC A-pool tournaments (figure 3).

Annual ice hockey injury rates for all men's World Championship and men's World Championship A-pool tournaments.
Injuries by anatomic region
Injuries involved the head and face in 210 cases (39.8% of game injuries), the lower body in 162 cases (30.7%), the upper body in 115 cases (21.8%), and spine or trunk in 41 cases (7.8%). The injury rate for head and face injuries was 5.7/1000 player-games, for lower body 4.4, for upper body 3.1 and for spine and trunk 1.1, respectively. In men's WC A-pool tournaments the injury rate for head and face injuries was 7.0/1000 player-games, for lower body 4.6, for upper body 3.4 and for spine and trunk 1.2, respectively (table 1 and figure 4).
Ice hockey injuries by anatomic region in all men's World Championship games

Injury rate by anatomic region per 1000 player-games in men's ice hockey World Championship tournaments.
Head and face injuries
Head and facial injuries were the most commonly injured body parts (39.8%; IR 5.7) and the face was the most common location. Facial injuries comprised 72.4% of the head injuries in all men's WC with an injury rate of 4.1/1000 player-games (in men's WC A-pool 70.9%; IR 5.0). A laceration was diagnosed in 74.3% of the facial injuries and 59.3% of them was caused by stick. Injury rate for dental injuries was 0.5 (9.5% of the head injuries; in men's WC A-pool 0.7; 10.4%) and for eye injuries 0.1 (1.4%)/1000 player-games (in men's WC A-pool 0.2; 2.2%).
Lower body injuries
The knee was the most common lower body injury with 46.9% of the lower body injuries affecting the knee (men's WC A-pool 49.4%). The injury rate for knee injuries was 2.0/1000 player-games (men's WC A-pool 2.3). Medial collateral ligament (MCL) sprain was the most common knee injury (56.6% of the knee injuries) and most of them were grade I injuries (51.2%). Meniscus tears comprised 14.5% and anterior cruciate ligament (ACL) disruption 10.5% of all knee injuries. Ankle and thigh injuries were the second and third most common lower body injuries.
Upper body injuries
The shoulder was the most common location for an upper body injury (49.6%; men's WC A-pool=50%). The injury rate for shoulder injuries was 1.5/1000 player-games (men's WC A-pool=1.7). Acromioclavicular (AC) joint sprain (50.9%) and glenohumeral joint injury (40.4%) were the most frequent diagnoses. The fingers (14.2%), wrist (10.8%) and hand (10.8%) injuries were in the second, third and fourth place in upper body injuries, respectively.
Injury types by diagnosis
The vast majority of injuries (92.8%) were acute in nature and this trend was consistent over the 7-year study period. Lacerations were the most common type of injury (26.1%). Sprains (21.8%) and contusions (15%) made up the next largest group. A fracture was diagnosed in 14% (men's WC A-pool=15.4%). The percentage of neurotrauma was 9.9% (men's WC A-pool=11.5%; figure 5).

Injury distribution by diagnosis in the men's World Championship games.
Concussion
Concussions accounted for a small yet clinically important number (n=52, 9.9%) of injuries in the championships. The injury rate of concussion was 1.4/1000 player-games in all men's WC and 1.9 in men's A-pool tournaments. The most common cause for concussion was check to the head (51.9%). A penalty was called in only 32.7% of the events that caused a concussion. For those players diagnosed with a concussion, 11.5% returned to play in the same game (men's WC A-pool=5.6%). Estimated time loss was more than 3 weeks in 7.7% of the cases. The centre position had the highest risk of concussion, 25% (30.6% in men's WC A-pool), the defence position, 20.2% (15.3% in men's WC A-pool) and the wing position, 17.3% (19.4% in men's WC A-pool). The majority of concussions occurred during the first period (42.3%; 47.2% in men's WC A-pool).
Contact with the boards
The majority of injuries occurred away from the boards (68.5%). This trend was apparent in all championships and was similar over the 7-year study period. Shoulder injuries were the most common (27.3%) resulting from contact with the boards (63.2%). The majority of concussions occurred without board contact (55.8%).
Flexible boards and glass
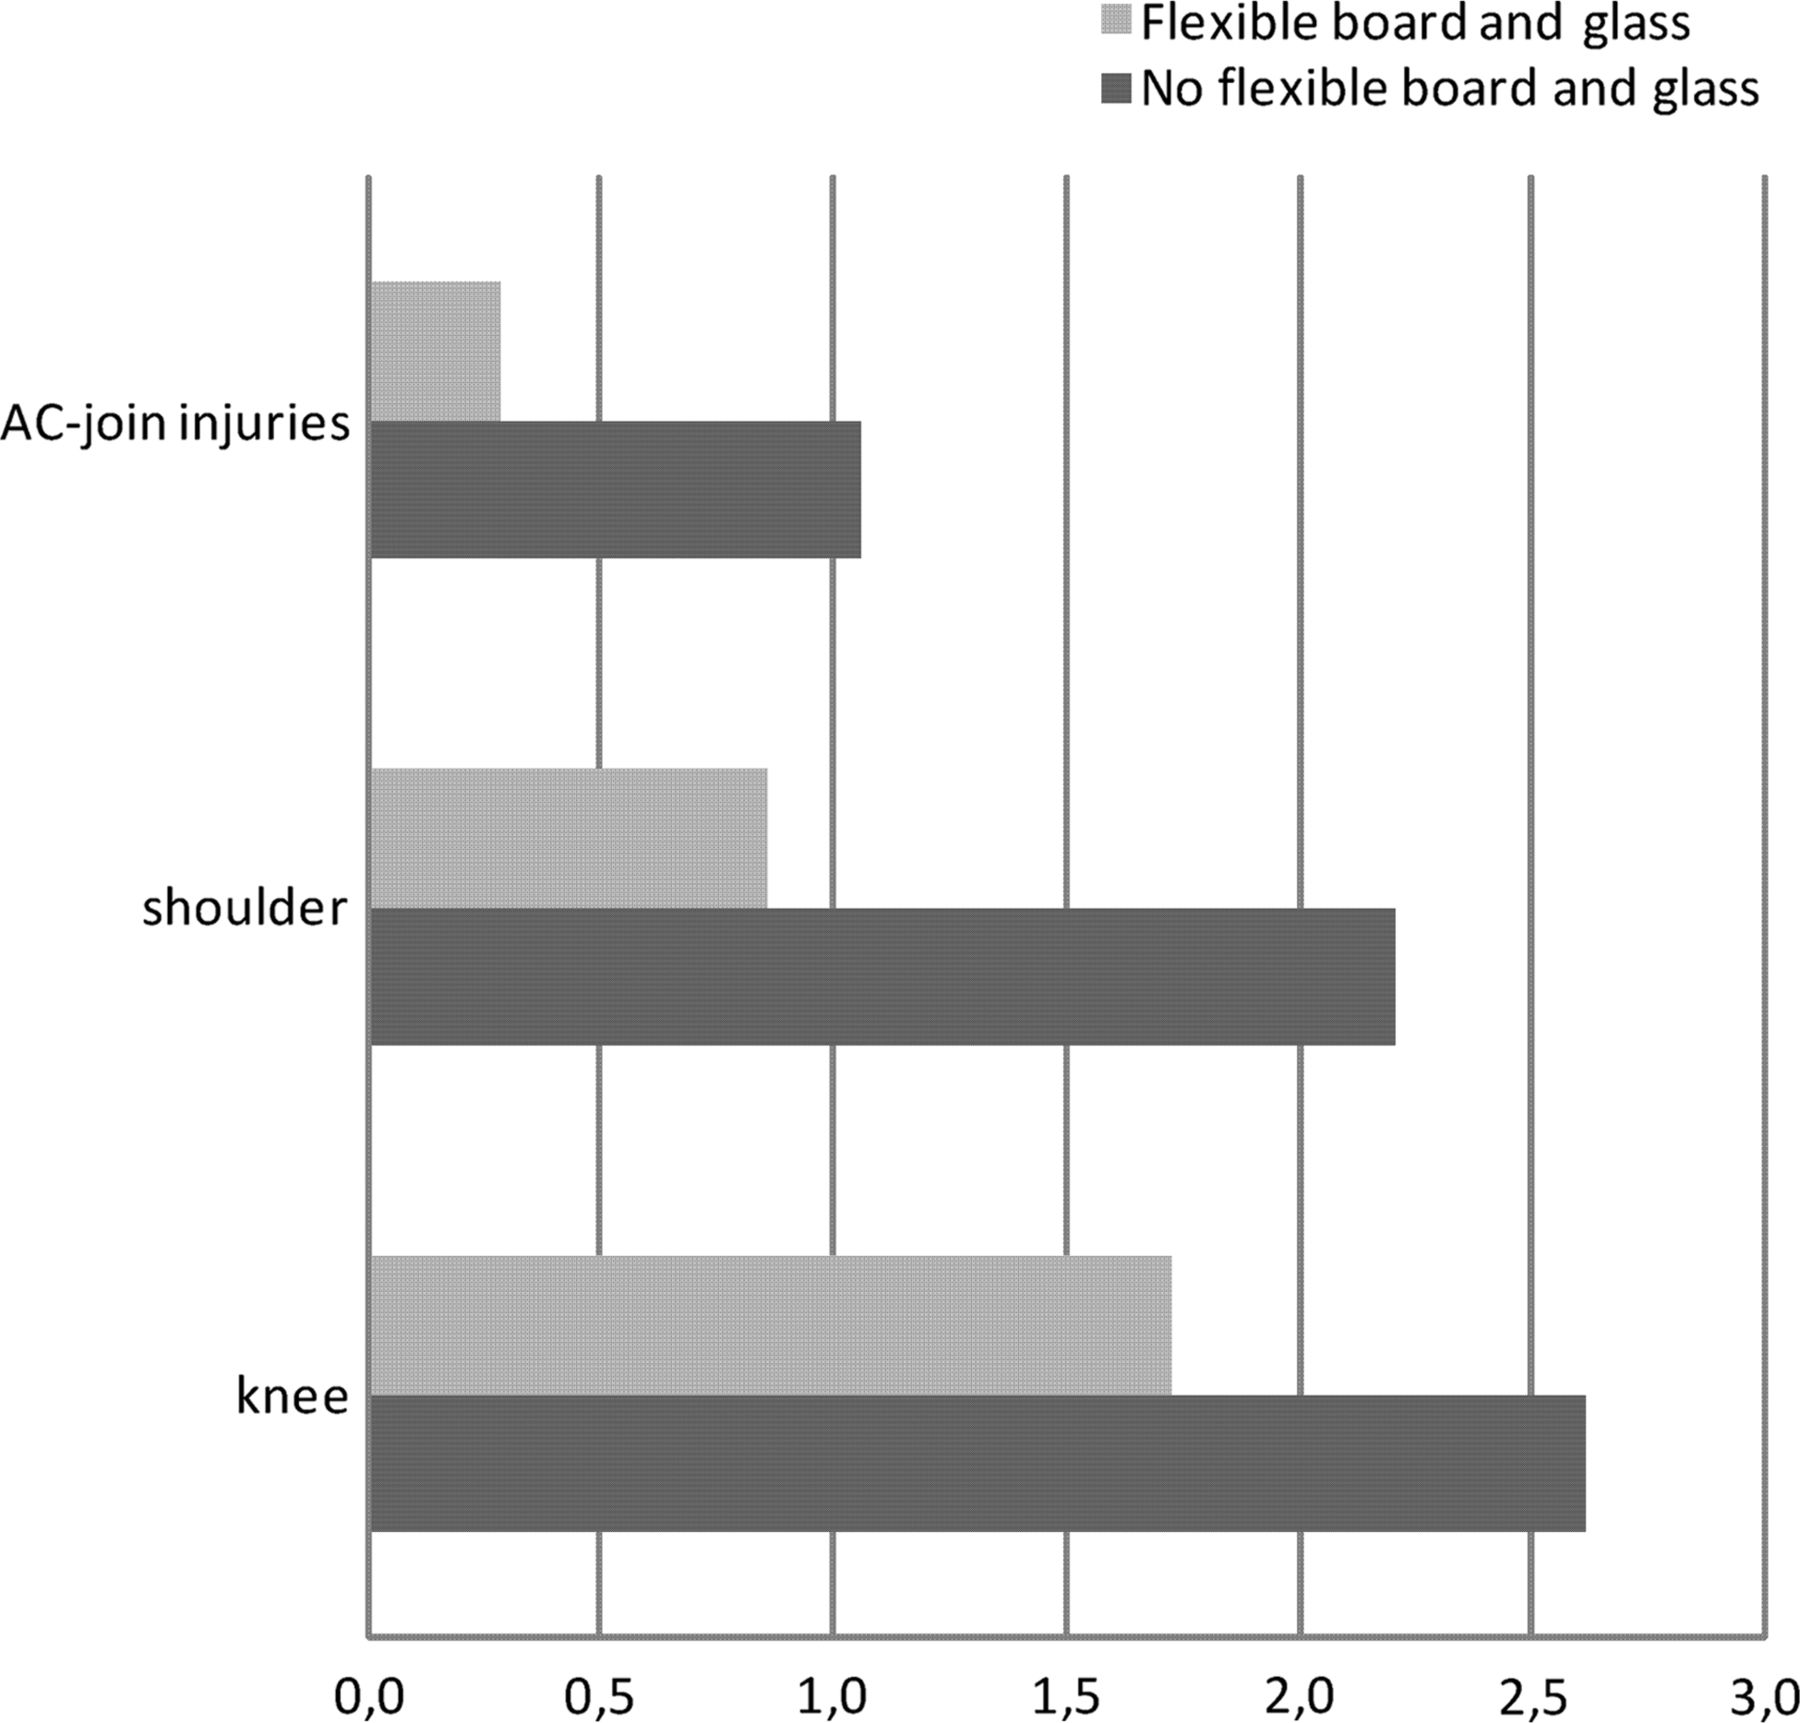
There was 29% lower risk of an injury at the arenas where flexible boards and glass were used compared to arenas with traditional boards and glass (IRR 0.71, (95% CI 0.56 to 0.91)). The A-pool WC tournaments that were played in arenas with flexible boards and glass had a shoulder injury rate of 0.9/1000 player-games as compared to 2.2/1000 player-games when traditional boards and glass were in place (IRR 0.36, (95% CI 0.15 to 0.90); figure 6). In addition to these significant findings, there were fewer concussions when flexible boards and glass were used instead of traditional boards and glass (OR 0.43, (95% CI 0.18 to 1.01)). Also, there was a trend for a decrease in all other types of injuries at arenas with flexible boards and glass compared to arenas with traditional boards and glass (IRR 0.82, (95% CI 0.61 to 1.09)).
Injury rate at the shoulder, acromioclavicular and knee per 1000 player-games in men's World Championship A-pool tournaments. Flexible versus non-flexible boards and glass.
Causes of injury
The three most common causes of injuries were body checking (27.2%), and stick (21.1%) and puck (12.3%) contact. The majority of the injuries caused by stick were head injuries (76.9%). Penalties were assessed in 25.9% of stick injuries, 40% in checking to the head and 48.4% in hitting from behind injuries.
Injury severity
The majority of players who were injured returned to play within 1 week (53.8%); however, 14.5% of the injured players did not return for at least 3 weeks.
Player position, period and zone
Injuries were equally distributed according to player position: wing players suffered 37% of all injuries (two wings per team), centre 18.4% (one centre per team) and defence 36.8% (two defences per team). The goalkeeper was the least injured in all the positions (3.5%) despite the fact that the goalkeeper is on the ice for the entire game. In the A-pool tournaments, the proportion of concussions sustained by centre was about twice that of defence and wing (OR 2.01, (95% CI 0.87 to 4.66)). The second period had the highest percentage of injured players (34.6%) during the game. There were only a few injuries sustained during the warm up (0.8%) and overtime in the Championships. Only 5% of the injury situations occurred during practices. Players sustained injuries at the home zone (39.3%), visitor zone (35%) and neutral zone (20.2%).
Discussion
This observational study followed 41 men's Ice Hockey WC tournaments over a 7-year period to determine the incidence, type, mechanism and severity of injuries. During the study period, 6666 players sustained 528 injuries in 844 games. The total injury rate was 52.1/1000 player-game hours for all men's WC and 59.6 for men's WC A-pool tournaments. Laceration was the most common injury followed by ligament sprain. The most commonly injured site was the head and face (39.8% of game injuries). The most common lower body injury involved the knee (46.9%) with the MCL (56.6% of all knee injuries) being the most frequent area. ACL injury was documented in 10.5% of cases. The most common upper body injury involved the shoulder (49.6%) with the AC joint most frequently involved (50.9% of all shoulder injuries). Body checking (27.2%) and stick contact (21.1%) were the most common causes of injuries. Of the players diagnosed with a concussion, 11.5% returned to play in the same game (men's WC A-pool=5.6%). The majority of concussions occurred before the 2012 Zurich Consensus Guidelines, which do not allow return to play in the same game.
Strengths of this study include the large number of players in the cohort, who were followed at the highest level of international competition over a 7-year period. Also, injury was clearly defined and detailed information was collected with the two validated questionnaires.4 In addition, the MS at each tournament ensured 100% compliance with data collection and the team physicians completed each injury report confirming the accuracy of the injury diagnosis.
Injury incidence rates were estimated by collective playing time since individual on-ice exposure was not measured. In addition, we assumed that each game was played for 60 min. This approach did not take penalties and overtime into consideration. To determine association between the arena characteristics and occurrence of injuries, weighting with standardised active playing time was used.
Lorenzon reported that in Swedish ice hockey the injury rate was 78.4/1000 player-game hours.5 In Finland, Mölsä observed the incidence of game injury in the Division I league to be 36/1000 player-game hours and 66/1000 player-game hours in the National League.6 Injuries were classified as major in 5% of the patients, and there were fractures in 8% and head or face involvement in 18% of them.6 In another study, Mölsä reported that the injury rate increased significantly from 54/1000 player-game hours in the 1970s to 83/1000 player-game hours in the 1990s.7 Rate of contusions, sprains and strains increased significantly with each decade. Checking and unintentional collision with an opponent were the common mechanisms of injury.7
Benson et al,8 reported that the estimated incidence of concussions in NHL was 1.8/1000 player-game hours, where the athlete-exposure time was estimated based on a roster of 18 skaters and one goalie playing in each team per game. The proportion of concussions sustained by centre was about twice that of defencemen and wingers. The present study supports the NHL findings of Benson et al.8 The reported differences in the injury rates are likely due to different study designs, including the definition of injury and measurement of player exposure.
Injury risk in ice hockey has been compared to other sports. In our study, the injury rate was 52.1/1000 player-game hours in men's ice hockey world championships. In contrast, injury rates were reportedly 112 injuries per 1000 player-game hours in male handball9 and 40.1 injuries per 1000 player-game hours in male soccer.10 In World Football Tournaments 1998–2010, the injury rate was 77.3 injuries per 1000 player-game hours but it included not only male games but also female and junior games.11 However, between-sports comparison of injury risk is difficult because of inconsistent study methodology including differences in definition of injury and estimation of exposure.
In conclusion, our 7-year follow-up study showed that the risk of injury during international ice hockey tournaments was relatively high. The head, face, shoulder and knee are the most vulnerable body sites. Arena characteristics, such as flexible boards and glass, seem to reduce the risk of injury in general and of the upper body specifically. Improved knowledge of the risk factors and mechanisms of ice hockey injuries are needed for initiation of preventive strategies.
What are the new findings?
-
The incidence of ice hockey injuries is at the same level as reported for other team sports.
-
Arena characteristics, such as flexible boards and glass, reduce the risk of injury in general and for the upper body specifically.
-
The face is the most common head injury location. A laceration is diagnosed in three-quarters of the facial injuries and three-fifths of them are caused by hockey sticks.
-
Every 10th player diagnosed with a concussion returned to play during the same game.
How might it impact on clinical practice in the near future?
-
Knowledge of the risk factors and mechanisms of ice hockey injuries are needed to initiate systematic injury prevention.
-
Arenas with flexible boards and glass make ice hockey safer.
-
Further research is necessary to determine if facial injuries in ice hockey can be reduced by enforcing existing rules or mandating full facial protection.
-
Possible rule changes should be considered to reduce risk of concussion. More education is needed for diagnosis and treatment of concussion; the return to play protocol needs wider adoption.
Acknowledgments
This study was financially supported by The International Ice Hockey Federation and the Finnish Ministry of Education and Culture. The authors highly appreciate the cooperation of all team physicians, physiotherapists and IIHF Medical Supervisors who volunteered their time to collect the data for this project. The authors sincerely thank Mr Kari Tokola, MSc, for statistical advice. The authors would also like to thank the International Ice Hockey Federation Medical Committee for all practical support.
Footnotes
-
Contributors MT, MJS, MA, PK and JP contributed to study conception and design. MT carried out the literature search, and coordinated and managed all parts of the study. MT, MJS and MA conducted data collection and performed preliminary data preparations. MT conducted data analyses and all the authors contributed to the interpretation of data. MT and JP wrote the first draft of the paper and all authors provided substantive feedback on the paper and contributed to the final manuscript. All authors have approved the submitted version of the manuscript. MT is guarantor.
-
Funding This study was financially supported by The International Ice Hockey Federation and the Finnish Ministry of Education and Culture.
-
Competing interests None.
-
Provenance and peer review Not commissioned; externally peer reviewed.