Article Text

Abstract
Background Previous studies investigating prediction of return to play after acute hamstring injury were limited by examining a single postinjury clinical and MRI evaluation. We evaluated the added value of including follow-up clinical evaluation when predicting return to play.
Methods A range of clinical and MRI parameters were prospectively investigated for an association with the time to return to play in 90 athletes with MRI positive hamstring injuries undergoing a criteria-based rehabilitation programme. Clinical evaluation was performed within 5 days of injury and 7 days after this initial assessment (follow-up clinical evaluation). The association between possible prognostic parameters and the time to return to play was assessed with a multiple linear regression model.
Results Data of 90 athletes were available for analysis. At the first physiotherapy appointment, a combination of three demographic and six clinical variables explained 50% of the variance (±19 days) in the time to return to play. At follow-up assessment (7 days), a combination of 10 clinical and demographic variables explained 97.0% of the variance (±5 days) in time to return to play. In order of importance, the variables were: change in strength during the first week for the ‘mid-range’ test, peak isokinetic knee flexion torque of the uninjured leg, maximum pain at the time of injury, number of days to walk pain free, playing the sport of football, strength performing the ‘inner range’ hamstring test at day 1, presence of pain on a single leg bridge at day 7 or its absence during a single leg bridge, delay in starting treatment and percentage of strength in the ‘outer range’ test compared to the healthy leg. No MRI variables were retained in any of these analyses. MRI variables alone explained 8.6% of the variance—which is unhelpful to players and coaches.
Summary The combination of initial and 7-day follow-up clinical evaluation is clinically helpful in predicting time to return to play (±5 days) following acute hamstring injury. MRI offered no useful clinical information regarding return to play duration in this cohort.
Trial registration number NCT01812564.
- Muscle
- Football
Statistics from Altmetric.com
Physiotherapist examination predicts physician-determined time to return to play after hamstring injury
Introduction
Return to play after hamstring strain injury varies widely—from 1 week1 to over 50 weeks2 or longer3—despite similar clinical grading and sporting requirements. Such variability is a significant challenge in the professional sporting environment—the players and their coaches, managers and others feel the clinical team should be able to estimate the likely time loss from the injury.
A number of factors have been proposed as influencing the time loss after hamstring injury, including: the mechanism of injury,4 injury location,5 MRI grading of injury,6 as well as the involvement of the proximal tendon.7
Whether variations in rehabilitation protocols will influence the duration of RTS is not known.8–10 Data from Askling et al9 ,10 suggest that adding early outer-range eccentric exercise to usual care shortens rehabilitation time and lowers reinjury rates, but this research did not control for the other exercises performed by the injured athletes. Sherry and Best8 tested an intervention but their study had a small sample sizes so a difference in return to play of 20 days was statistically insignificant.
Our goal was to examine the ability of (1) subjective and objective information obtained at the time of initial physiotherapy examination, (2) results of physiotherapy examination 7 days after the initial examination and (3) the MRI examination at initial examination to predict time to return to play after hamstring injury. A strength of our study design was that all participants underwent a standardised, criterion-based rehabilitation protocol with standard return to play criteria (these are detailed in the online web appendix). The present report is a preplanned secondary analysis of data acquired during the Aspetar PRP trial (Registered trial number: ClinicalTrials.gov Identifier: NCT01812564).11
Methods
This is a substudy of a double-blind randomised controlled trial examining the additional effect of acute injection of platelet-rich plasma and standardised physiotherapy (PRP+Physio), compared to platelet-poor plasma and standardised physiotherapy (PPP+Physio) and standardised physiotherapy without injection (Physio) on the return to play time and reinjury after MRI confirmed grade 1 and 2 hamstring injury.11
Inclusion criteria were male athletes who: (1) presented to our outpatient physiotherapy service within 5 days with an MRI-confirmed acute hamstring injury, (2) agreed to be randomised to receive one of the three interventions and (3) consented to physiotherapy treatment 5 days per week. The full methodology for the randomised trial are detailed elsewhere.11
All participants were given a standardised, criteria-based rehabilitation protocol (see online supplementary material) under the supervision of three experienced sports physiotherapists. Treating physiotherapists were blinded to the MRI results, as well as to the intervention group (PRP+Physio, PPP+Physio, Physio) allocation.11
Initial examination
After initial examination by a sports medicine physician and MRI confirmation of a grade 1 or 2 hamstring strain injury12 (excluding grade III—complete rupture), the study participants presented to physiotherapy, where one of the three physiotherapists took their history and conducted a physical examination. Participants were questioned regarding the history of their injury, its mechanism and a range of subjective features, via use of a standardised form (see online supplementary material: initial and daily assessment forms and online supplementary video).
The examining (and treating) physiotherapist then performed a standardised physical examination, and documented palpation pain and location, strength, flexibility and functional testing results (see table 1 and online supplementary material: initial and daily assessment forms and online supplementary video).
Summary of the assessment items that were candidates for the regression analyses, and the results
After this initial assessment, an isokinetic evaluation of the uninjured leg was conducted to serve as a baseline measure. The injured athlete performed three isokinetic knee flexion and extension strength tests of the uninjured leg: at 60°/s concentric extension and 60°/s concentric flexion; 300°/s concentric extension and 300°/s concentric flexion; and 60°/s eccentric extension and 180°/s concentric flexion.13
The rehabilitation protocol has been previously described13 and is depicted in the online supplementary material.
MRI
MRI examination was performed prior to any injection being given.11 Patients were positioned supine and examined with a 1.5 Tesla Siemens Espree12 (Erlangen, Germany). In addition, a phased array coil and two body matrix coils were strapped over the thigh and centred over the painful area, as identified by the athlete. Axial and coronal proton density with fat saturation along the longitudinal axis of thigh (TR/TE 3490/27 and a 512×326 matrix for the coronal images and TR/TE 3000/32 and a 512×333 matrix for the axial images) with one signal average each were obtained.
Each MRI was assessed by one radiologist with more than 9 years of experience in musculoskeletal radiology. While the injured athletes had standardised MRI examinations performed at initial examination, and during their final discharge examination, only the initial examination MRI investigations are reported in this study. The radiologist was blinded to the clinical status and to information on whether the MRI was of the initial injury or at return to play.
For assessment of the MRIs, we used standardised scoring forms (see online supplementary material: MRI report sheet), which included the modification of Peetrons’ grading; grade 0: no abnormalities; grade I: oedema without architectural distortion; grade II: oedema with architectural disruption; grade III: complete tear.12 ,14 When more than one muscle was involved, the muscle with the most extensive oedema or disruption was scored. We measured the increased T2-signal intensity for the affected hamstring muscle in craniocaudal, transverse and anterioposterior dimensions on the fluid sensitive sequences (PD-FS). We recorded the distance from the ischial tuberosity, longitudinal length (craniocaudal) of the lesion and calculated the involved cross-sectional area as a percentage of the total muscle cross-sectional area in the transversal plane, and approximated the lesion volume. Excellent reliability, with the same radiologist involved, has been previously described.12
Return to play
The primary outcome was the time to return to play expressed as the number of days from injury (day 0) to the completion of the full rehabilitation programme and clearance to return to play by the treating sports medicine physician (blinded to the intervention). The treating sports medicine physician clinically reviewed athletes on a weekly basis and immediately on completion of the rehabilitation programme. The guidelines for making the final return to play decision included successful and asymptomatic completion of the progressive criteria-based rehabilitation programme, clinical evaluation and interpretation of the results of isokinetic assessment.
The return to play decision was step-wise, and involved, at first, completion of the 6 stage criteria-based rehabilitation programme, the final 3 of which are functional field-based stages specific to the individual athlete's normal practice regimen. On successful completion of these criteria, the athlete performed three isokinetic knee flexion and extension strength tests of both, the injured and the uninjured leg: at 60°/s concentric extension and /60°/s concentric flexion; 300°/s concentric extension and 300°/s concentric flexion; and 60°/s eccentric extension and 180°/s concentric flexion.13 The same isokinetic protocol was performed on the uninjured leg prior to the start of the rehabilitation (baseline isokinetic). Isokinetic data guided the RTP decision, but there were no strict isokinetic criteria to be met. Informed by this, the treating sports medicine doctor then conducted a clinical examination and made a decision regarding return to play.13
Statistical analysis
The clinical utility of subjective and physical examination and the findings of acute MRI were investigated using linear regression. Statistical analysis was conducted using SPSS V.21 (IBM Corporation and other(s) 1989, 2012, Chicago, USA).
Three separate analyses were conducted to shed light on the utility of: (1) the initial physiotherapist's examination, (2) a combination of the initial and week one physiotherapist’s examinations, and (3) the MRI examination alone and in combination with (1) and (2). For initial examination analysis, all the information collected at initial examination along with the MRI variables and the athlete's attendance at physiotherapy were made available for inclusion. For the week 1 analysis, all of these same variables as well as the examination features from the day 7 examination were made available. For the MRI analysis, only the MRI variables were included.
To minimise the possibility of overfitting the data, in the first instance, simple scatter plots of each of the individual candidate predictor variables were created and correlations estimated, along with measures of central tendency (mean, median) depending on the kurtosis of the data, as well as estimates of variance (SD or IQR as appropriate) and estimates of covariance including variance inflation factor.Where this analysis suggested a relation, and the experienced clinicians involved in the study proposed a biologically plausible mechanism for their relation to return to play duration, the variable was retained for subsequent inclusion in the regression model, otherwise it was discarded.15 ,16 The suitable candidate variables were then examined in a multiple linear regression model with the independent variable being time taken (in days) from initial injury until medical clearance was given for return to full training and play.
Multiple linear regression was conducted using a best subsets approach, with the criteria for entry being improvement in adjusted R2 (variance explained adjusted for the number of predictors in the model). Equations for estimating RTP at initial examination, 1 week examination and using the MRI were generated along with estimations of the variance explained using these equations. Scatter plots were generated for the predicted and actual days of return to play along with the regression line and 95% CIs.
Result
From November 2009 through October 2013, 90 patients were included. The baseline demographic variables are presented in table 2.
Demographic data regarding the included injured athletes
The mean duration between injury and initial assessment was 2.0 days (SD 1.1). The mean duration of return to play was 25.1 days (10.1). There were 46 grade I and 44 grade 2 injuries with a mean oedema volume of 70.9 (89.2) cm3.
The variables retained for the predictive analysis are shown in table 3.
Summary of final variables considered in the regression models
At initial examination, a combination of nine variables (6 clinical and 3 demographic) in a regression equation explained 59% of the variance in the time to return to play. The six clinical variables that predicted return to play were:
Maximum pain at the time of injury (MaxP), presence of pain on the ‘outer range’ strength test, the mid-range strength test expressed as a percentage of the uninjured leg, passive knee extension range in 90° hip flexion (‘PKET’), Straight Leg Raise flexibility and the angle of peak torque for knee extension at 60°/s (concentric).
The three demographic variables that predicted return to play were:
Playing the sport of volleyball, a history of hamstring injury on both legs and the athlete's attendance to physiotherapy (expressed as a percentage of possible attendance). These variables are outlined in table 4.
Patient history and physical examination variables retained in the regression equations
Variables associated with a longer time to return to play will have a positive coefficient, while variables associated with a shorter return to play will have a negative coefficient. The coefficient multiplied by the variable (in its units of measurement) are then the associated change in expected return to play time. For example, MaxP has a coefficient of +2.4. This can be interpreted as: if an athlete reported 8/10 as their MaxP, then this would be associated with 19.2 days (ie, 2.4×8) longer return to play duration. Variables that are ‘Yes/No’ are interpreted as 1 or 0, respectively. For example, if, on initial examination, the athlete reported pain when performing the outer range strength test (‘OuterInjP’), this was associated with a shorter return to play duration of 11.25 days (ie, 11.25×1).
At initial examination, variables associated with a longer time to return to play were: higher MaxP, and greater passive flexibility of knee extension of the uninjured leg with the hip flexed to 90° (PKETUninj) and a higher angle of peak torque for knee extension in the uninjured leg (Quadriceps) tested at 60°/s (APTQ60Uninj). Variables associated with a shorter duration of return to play were: presence of pain on outer range strength testing (OutInjP), greater strength of the injured leg as a percentage of the uninjured leg when tested in the ‘mid range’ position expressed as a percentage (Mid%), playing the sport of volleyball (SportVolleyball), greater passive straight leg raise flexibility of the uninjured leg (SLRUninj), history of a hamstring injury to both legs (PrevHSInjBoth) and higher number of days attending physiotherapy expressed as a percentage of possible days attendance (attendance%) (see table 3, equation 1).
The 95% CI surrounding this equation at the median return to play time covers approximately 46 days, that is, ±approximately 23 days (see equation 1, and figure 1). 1
1

Scatter plot of the regression equation for initial physical examination findings (Days to Return to Sport Predicted) against actual time to return to sport (Days to Return to Sport Actual) with 95% CI, R2=0.592, p<0.01. Dashed line represents perfect agreement reference line, that is, where the predicted value is equal to the actual value. Inset: How to interpret the scatter plot if the equation predicted 35 days return to play. The horizontal (dotted) line intersects the regression line at 42 days actual return to play (single arrowhead) and the 95% CI ranges from 21 days to 65 days (double arrowheads). Thus, this set of variables is not helpful for a player or coach.
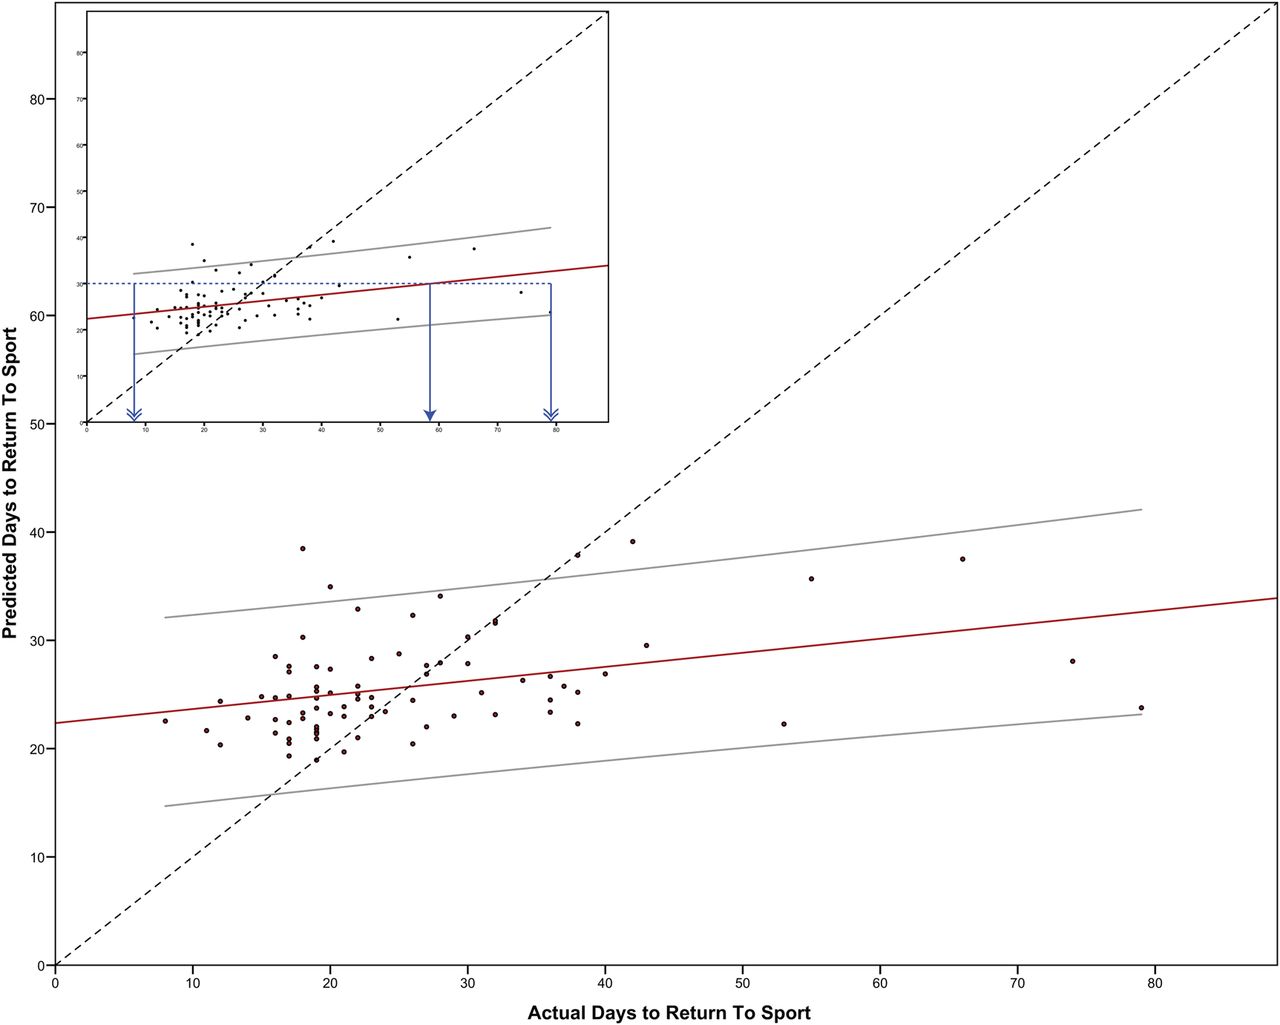
At 1 week post initial examination, a combination of 10 (9 physical and 1 demographic) variables explained 97.0% of the variance in time to return to play. Variables associated with a shorter return to play duration were: greater improvement in strength of the ‘mid-range’ strength test over the 7 day period (Wk1ΔMidInj), a painless strength test in the ‘Outer range’ position and playing the sport of Football (SportFootball).
Variables associated with a longer duration of return to play were: greater isokinetic strength of the knee flexors when tested at 60°/s on the uninjured leg (PTHC60U), higher maximum pain reported at the time of injury (MaxP), higher number of days taken to walk pain free (TimeWalk), greater strength on the ‘Inner Range’ strength test on the injured leg (InnerInj), pain reported when attempting a single leg bridge exercise (SLBridgePain), greater delay in starting physiotherapy after injury and higher percentage of strength tested in the ‘Outer Range’ position (injured compared to uninjured, outer%). The 95% CI surrounding this equation covers approximately 10 days, that is, 4±approximately 5 days (see equation 2, and figure 2). 2
2

Scatter plot of the regression equation for initial examination and week 1 postinjury examination findings (Days to Return to Sport Predicted) against actual time to return to sport (Days to Return to Sport Actual) with 95% CI, R2=0.970, p<0.01. Dashed line represents perfect agreement reference line, that is, where the predicted value is equal to the actual value. Inset: How to interpret the scatter plot if the equation (see online spreadsheet calculator) predicted 35 days return to play. The horizontal (dotted) line intersects the regression line at 35 days actual return to play (single arrowhead) and the 95% CI ranges from 31 days to 40 days (double arrowheads). Thus, this set of variables is likely helpful for a player or coach.
Examination of the MRI variables only and their relation to return to play duration showed a significant relation only for the volume of oedema (in cm3) such that the number of days predicted to return to play was equal to this volume ×0.11+19.7 days (p<0.05), however, the variance explained was only 8.6%, which resulted in a 95% CI in excess of 80 days for the median time to return to play (see figure 3 and equation 3). A box plot of days taken to return to play compared with overall MRI grading is shown in figure 4. Note that while all MRI variables were available for inclusion in the first two models, none were ultimately retained. 3
3
Scatter plot of the regression equation for MRI findings (Days to Return to Sport Predicted) against actual time to return to sport (Days to Return to Sport Actual) with 95% CI, R2=0.130, p<0.05. Dashed line represents perfect agreement reference line, that is, where the predicted value is equal to the actual value. Inset: How to interpret the scatter plot if the equation predicted 40 days return to play. The horizontal (dotted) line intersects the regression line at 58 days actual return to play (single arrowhead) and the 95% CI spans the range of the entire data set, that is, 7–78 days (double arrowheads). As such, MRI is entirely unhelpful in predicting return to play duration.

Days taken to return to sport compared with MRI grading. No significant difference between the grades 1 (median RTP: 20.5, IQR: 9.8) and 2 (Median: 23, IQR: 17.5) was found, Mann-Whitney U: two-tailed asymptotic significance: 0.618. Note that 4 outliers are depicted in this analysis. Open circles (Case 80 in grade 1, and cases 41 and 52 with a grade 2 injury) are participants who were >1.5 times the IQR, and an asterisk denotes participant 42, who was >3 times the IQR.
Discussion
These data show that the combination of initial and follow-up (7 days) examination has clinical utility, explaining 97% of the total variance of time to return to play in acute hamstring injuries. However, a single clinical examination at initial presentation is clinically less helpful in determining time to return to play (explaining 59% of the total variance).
Predicting time to return to play from these data—information for coaches and players
To understand the utility of the described regression equations, the predicted and actual return to play values, along with their 95% CI's, need to be examined. These values can be estimated from the equations and the figures provided. A predicted return to play value can be calculated from the provided formulae, and the 95% CI associated with a predicted value can be estimated graphically from the figures provided allowing the reader to derive clinical importance. To do this, choose a predicted value of interest (on the vertical-axis, or Y-axis) and then trace a line across horizontally until it intersects with the 95% CI values on the plot. The range of the horizontal (X-axis) values included between these intersections is the 95% CI, in days.
For example, taking the mean return to play duration (approximately 25 days) and using figure 1, reflecting initial examination variables, the actual value for return to play is approximately 24 days, however, the 95% CI associated with this prediction is from 8 to 47 days. Using figure 3 (initial and follow-up examination), the actual return to play value is approximately 25 days, with a 95% CI from 21 to 29 days. Using figure 4, the MRI examination, the actual return to play is 27 days, however, the 95% CI spans the entire range of return to play values—from 8 to 78 days.
We suggest that, from these data, clinically meaningful inferences can only be made from the data taken at initial examination and 7 days postinjury, despite the statistical significance of this equation. Conversely, clinically meaningful information was available from neither the initial examination nor from the MRI examination (nor any combination of variables taken at this time).
MRI did not add value in predicting return to play—why not?
Interestingly, the MRI features were not retained in either of the analyses that included clinical features, suggesting that MRI offered no added value in predicting return to play duration. Similarly, injection of PRP or PPP, or no injection, was not found to significantly alter the return to play duration in this cohort.11 The combination of initial and follow-up examination has not been studied before, but clearly reflects daily practice while dealing with acute injuries. Previous studies included only single baseline assessments and reported even lower percentages of explained total variance.17
In contrast to other research showing an association between MRI parameters and time taken to return to play,18 we found no such utility. We suggest three possible reasons for this discrepancy. First, previous studies were based on univariate analysis with a high risk of bias.17 Second, this study only examined grades 1 and 2 hamstring injuries. We suspect that grades 0 and 3 will, respectively, show much shorter and longer time to return to play than grades 1 and 2. As such, correlation or regression analyses will have much greater proportion of variance explained by including these more extreme values. Finally, in our study, the treating therapists and medical practitioners were blinded to the MRI, and clinical decisions were made according to subjective reports of the patient and objective clinical (physical) findings. To our knowledge, only one previous paper examining return to play duration has blinded the clinical decision makers to the MRI.19 In that study, there was no correlation between MRI findings and time to return to play, either.
Limitations
While we have taken steps to minimise the possibility of the influence of overfitting, a significant limitation of this analysis is that the data are certainly overfit with a much higher number of candidate variables than should be permitted for an exploratory analysis.20 Accordingly, at least some of the variables will have been incorrectly retained by capitalising on chance.21 These analyses should be seen as preliminary, and will need to be confirmed in a subsequent study.22
A further limitation of this study is that those in the cohort examined were predominantly professional sportsmen (mainly football players) who had enrolled in an RCT where they could have been assigned an injection therapy. Most likely, such a cohort will vary from a recreational athlete, and likely even some other professional athletes who feel differently about being included in a randomised study for their injury.
Of the identified variables, time to walk pain free has previously been proposed, however, this was in a different population (AFL players), in which rehabilitation was not controlled.23
A corollary of the likelihood of false positive assessment findings is that those not showing an association with return to play in this analysis are unlikely to be clinical predictors.16
Of interest, the football players in this cohort displayed a shorter time to discharge than participants from the other sports, such as track and field athletes. We speculate that the differing physical demands of individual sports (and therefore the differing requirements to reach sports-specific goals during rehabilitation) are contributing factors for this result.
We believe that a significant strength of this study is the tightly controlled and standardised criteria-based rehabilitation. We feel that such an approach has minimised the variability of outcome associated with interindividual rehabilitation variation.
This study has not examined predictors of reinjury. Given the reported high recurrence of hamstring injury, the clinical and MRI factors examined here should be examined to see if they can help predict those athletes likely to be reinjured.
Summary
A combination of subjective and objective examination features gleaned from the initial physiotherapy examination, and a further examination 7 days later, predicted time to return to play in this large series of athletes with grade I and II hamstring strain injuries. The key variables that clinicians may wish to consider when examining similar patients are: the change in strength from initial examination to day 7 examination for the ‘mid range’ test; isokinetic knee extension strength of the uninjured leg on day 1; the maximum pain reported by the athlete at the time of injury; playing the sport of football; strength at initial assessment on the inner ‘range’ test for the injured leg; the presence of pain on performing a single leg bridge at day 7; the delay in starting treatment; and the strength of the injured leg (expressed as a percentage of the uninjured leg) in the ‘outer range’ test performed at day 1. Conversely, examination performed on day 1 alone, as well as the addition of MRI examination, offered no clinical utility.
What are the findings?
Predicting return to play duration after hamstring injury at initial examination is difficult, and time to return to play varies widely.
How might it impact on clinical practice in the future?
A range of clinical examination findings performed at day 1 and day 7 of physiotherapy treatment likely offers reasonable predictive ability in duration of return to play. The key subjective features associated with return to play time were:
Maximum pain reported at the time of injury, delay in starting physiotherapy,
Time taken to walk pain free,
Playing the sport of football.
The key physical findings were six strength testing related variables:
Change in pain on the mid range strength test over the first week,
Pain during the outer range strength test and single leg bridge at day 7,
Outer range strength at day 7 expressed as a percentage of the uninjured leg,
Strength during the inner range test at day 1,
Peak isokinetic strength of knee flexion of the uninjured leg.
MRI offered no additional clinically meaningful information.
References
Supplementary materials
Supplementary Data
This web only file has been produced by the BMJ Publishing Group from an electronic file supplied by the author(s) and has not been edited for content.
- Data supplement 1 - Online Calculation book
- Data supplement 2 - Online Video
- Data supplement 3 - Online Initial Examination Physiotherapy
- Data supplement 4 - Online MRI Report sheet
- Data supplement 5 - Online physical assessments form
Footnotes
Contributors PJ, PM and RW conceived the study and collected the data. All the authors were involved in the analysis of the data. PJ, EW, RW and JT were responsible for writing the final manuscript.
Competing interests None declared.
Ethics approval Aspetar Sports Medicine Hospital Ethics Committee.
Provenance and peer review Not commissioned; externally peer reviewed.