Article Text

Abstract
Background Detailed injury data are not available for international ice hockey tournaments played by junior athletes. We report the incidence, type, mechanism and severity of injuries in males under ages 18 and 20 at junior ice hockey World Championships during 2006–2015.
Methods All injuries in the International Ice Hockey Federation World Junior under-20 (WJ U20) Championship and under-18 (WJ U18) Championship were collected over a 9-year period using a strict injury definition, a standardised injury reporting system and diagnoses made by a team physician.
Results 633 injuries were recorded in 1326 games over a 9-year period, resulting in an injury rate (IR) of 11.0 per 1000 player-games and 39.8/1000 player-game hours. The IRs in all tournaments were 4.3/1000 player-games for the head and face, 3.2 for the upper body, 2.6 for the lower body and 1.0 for the spine and trunk. A laceration was the most common injury type followed by a sprain. Lacerations accounted for 80% (IR 3.6) of facial injuries in WJ U20 tournaments. The shoulder was the most common injury site (IR 2.0) in WJ U18 tournaments. Board contact was the mechanism for 59% of these shoulder injuries. Concussion was the most common head and face injury (46%; IR 1.2) in WJ U18 tournaments.
Conclusions and recommendations The risk of injury among male junior ice hockey players was lower than the reported rates in adult men but higher than that in women. Facial lacerations were common in U20 junior players (WJ U20) since most wear only partial facial protection (visor). The IR for shoulder injuries was high in U18 junior players (WJ U18). Suggested strategies for injury prevention include full facial protection for all players and flexible board and glass for all junior tournaments.
- Ice hockey
- Epidemiology
- Injury prevention
- Concussion
- Adolescent
Statistics from Altmetric.com
Introduction
Thirty-nine countries competed in the 2015 International Ice Hockey Federation (IIHF) Male World Junior under-20 (WJ U20) Championships and 43 in the Male World Junior under-18 (WJ U18) Championships. The IIHF collaborated with the local organising committees to organise the A-pool and three other divisions. Divisions I and II of WJ U20 tournaments and all divisions of WJ U18 tournaments were divided into subgroups A and B. The teams were qualified for the divisions and its subgroups according to IIHF World ranking.
Ice hockey is associated with many potential risk factors for injury, such as unintended collisions; high velocity; rapid changes in direction; and contact with the boards, stick or puck.1 Full facial protection is mandatory for players under 18 years old. Partial facial protection (visor) is allowed for junior players aged over 18 years. The ice hockey injury research at other levels of competition has shown that most injuries occur in a game, including lacerations, contusions, sprains and concussions.2–6 Injuries in junior ice hockey at the international level have scarcely been studied. Knowledge of injuries should help to create effective prevention strategies for reducing the risk of injury,7 and help organisers plan medical services during tournaments.
The aim of the present study was to investigate the incidence, nature, causes, severity and time trend of injuries in the WJ U20 and U18 ice hockey tournaments between 2006 and 2015.8
Methods
During the nine ice hockey seasons between 2006 and 2007 and 2014 and 2015 (1 July 2006 to 30 June 2015), we registered, with permission from the IIHF, all ice hockey injuries from the 69 male junior ice hockey championships. There were 36 WJ U20 and 33 WJ U18 Championships. A total of 1326 games were played in the 69 tournaments by 487 teams (10 518 players). WJ U20 competitions consisted of 695 games in 36 tournaments played by 254 teams (5476 players) and WJ U18 competitions consisted of 631 games in 33 tournaments played by 233 teams (5042 players).
A team medical personnel meeting before each tournament allowed the IIHF Medical Supervisor (MS) to review the definition of the injury, game injury report (GIR) form and the injury report system (IRS) form with the individual team physicians (figure 1). The definition of an injury was made in accordance with the accepted international ice hockey norms. Minor injuries that allowed the athlete to continue playing and did not require medical attention were not included. An IRS form was completed when one of the following criteria was observed:
Any injury sustained in a practice or a game that prevented the player from returning to the same practice or game;
Any injury sustained in a practice or a game that caused the player to miss a subsequent practice or game;
A laceration which required medical attention;
All dental injuries;
All concussions;
All fractures.

Injury report system form of the IIHF. DG, diagnosis; ICD, International Classification of Diseases; IIHF, International Ice Hockey Federation; MCL, medial collateral ligament; LCL, lateral collateral ligament; NA, not available; PCL, posterior cruciate ligament.
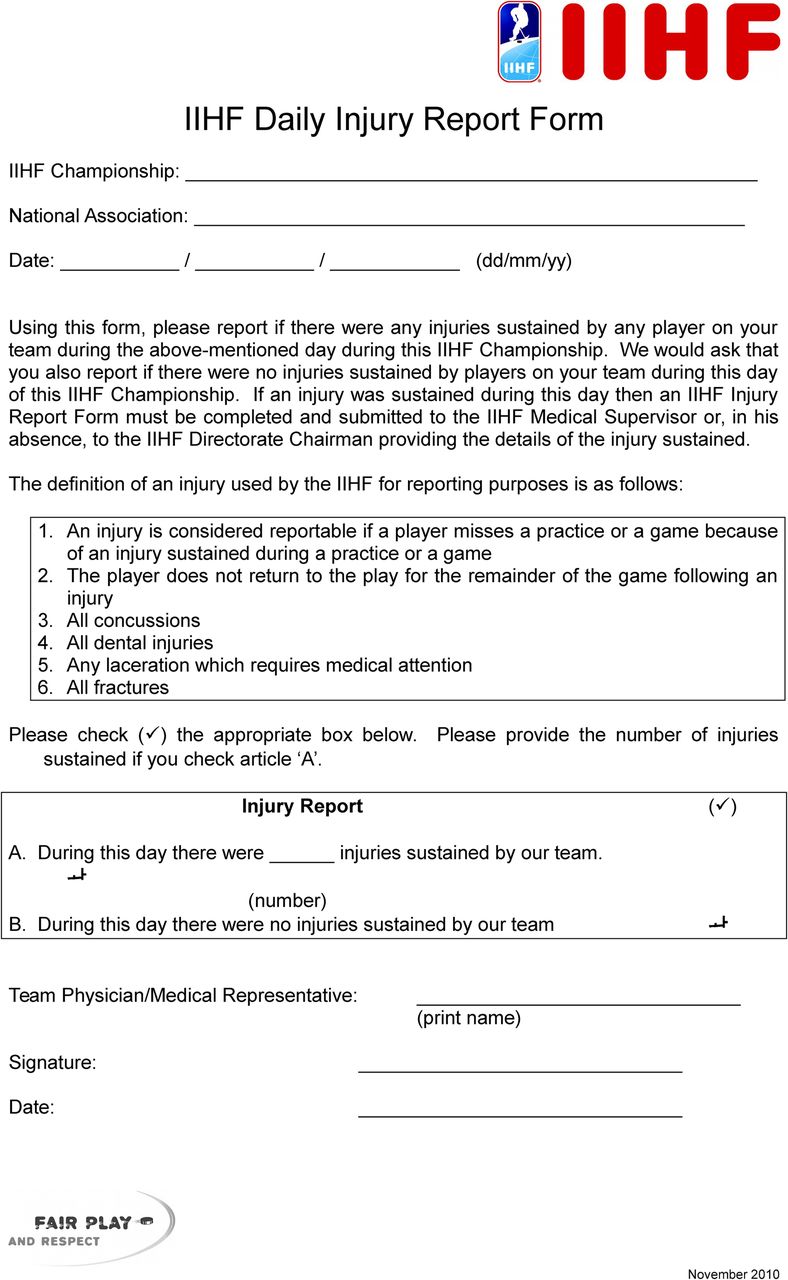
The individual team physician followed all the players on their team and submitted the GIR form to the MS after each contest. The GIR form was used to verify the number of injuries that satisfied the definition (figure 2). The team physician was also required to complete a detailed injury report (IRS form) for every injury. The IRS form was returned to the MS during the tournament as soon as all the sufficient information had been obtained and the final diagnosis was confirmed. The IIHF MS assigned to each championship was responsible for data collection. The IRS form was filled out only once for each injury and included detailed information on the game period, ice location, mechanism, anatomic site, severity and specific injury diagnosis. The anonymous forms were returned to the IIHF Medical Committee for insertion into a computer-based IRS for ice hockey injuries (Medhockey, Medisport Ltd, Finland).

Game injury report form of the International Ice Hockey Federation (IIHF).
No separate ethics approval was needed for this register-based study since all information was collected anonymously. The study was conducted with written permission of the IIHF, who is the holder of the registry.
Injury rate (IR) was expressed as the number of injuries per 1000 ice hockey player-games and per 1000 player-game hours. These two different IR definitions were used to allow comparison with other IIHF championships, hockey leagues and sports (soccer, rugby, football, basketball).9–16
The population-at-risk or player exposure to injury was determined by an estimation of collective playing time. The number of player-games was based on 20–22 players competing for each team in a game depending on the specific level and year of a given tournament. Only the participating athletes were included in the denominator when calculating incidence of injury.
The player-game IR was an average risk of one individual player per 1000 games (# injuries/# players (2 teams)/# games×1000=injuries per 1000 player-games). The IR for 1000 player-game hours was based on a 60 min active game with five players and a goalie per team on the ice at the same time (# injuries/# players on ice same time (2 teams)/# games×1000=number of injuries per 1000 player-game hours).
Practice injuries were excluded because there were only a few documented injuries (n=18, 3%; WJ U20, n=12; WJ U18, n=6). The IRs refer to those injuries that occurred in game competition only. Time loss was used as a proxy to determine the injury severity. The severity was graded into four groups by the team physician according to the IRS form (figure 1).
The outcomes from A-pool tournaments are reported separately, because they represent the top-level international championships in each age group. The injury results are presented as total numbers, percentages and rates (injuries per 1000 player-games and per 1000 player-game hours).
Results
Incidence of injury
During the study period, 633 injuries were reported in 1326 games. The IR per 1000 ice hockey player-games was 11.0 for all World Junior Championships. The annual IR ranged between 7.7 (2008) and 14.4 (2009). For WJ U20 tournaments, 361 injuries were reported in 695 games comprising 29 992 athletic game exposures. The IR was 12.0/1000 player-games (WJ U20 A-pool IR 13.2) and the annual IR ranged between 7.0 (2008) and 15.8 (2009; figure 3). For WJ U18 tournaments, 272 injuries were reported in 631 games comprising 27 334 athletic game exposures. The IR was 9.9/1000 player-games (WJ U18 A-pool IR 12.8) and the annual IR ranged between 6.7 (2013) and 15.0 (2011; figure 3). The IR per 1000 player-game hours was 39.8 for all WJ tournaments, 43.3 for WJ U20 tournaments and 35.9 for WJ U18 tournaments.

Annual ice hockey injury rates per 1000 player-games in all World Junior under-20 (WJ U20) Championships, WJ U20 Championships (A-pool), all World Junior under-18 (WJ U18) Championships and WJ U18 Championships (A-pool).
Injuries by anatomic region
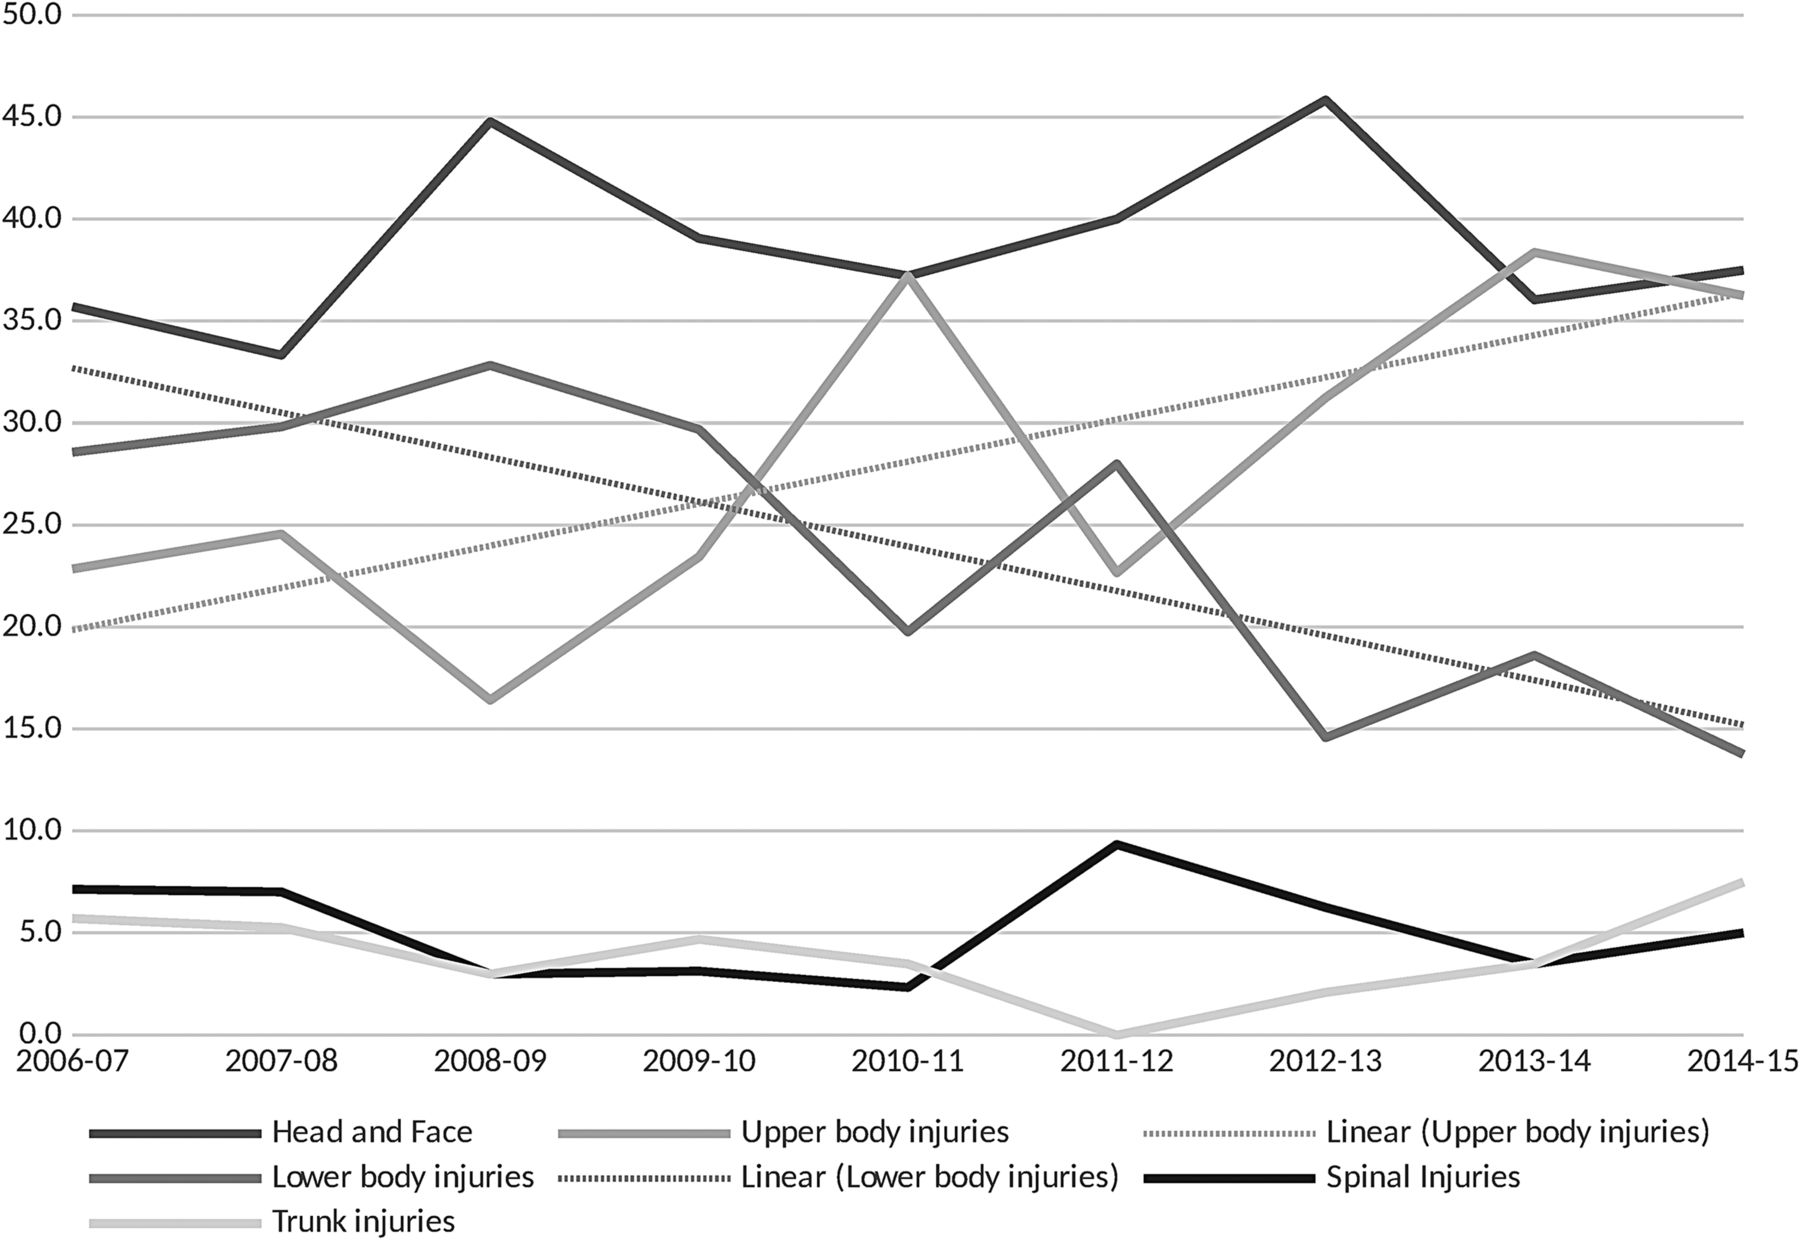
In all World Junior Championship tournaments (U20 and U18), injuries involved the head and face in 244 cases (39% of game injuries), the upper body in 182 cases (29%), the lower body in 150 cases (24%), and spine or trunk in 57 cases (9%). The IR for head and face injuries in all tournaments was 4.3/1000 player-games (IR 15.3/1000 player-game hours), for upper body 3.2 (11.4/1000 player-game hours), for lower body 2.6 (9.4/1000 player-game hours), and for spine and trunk 1.0 (3.6/1000 player-game hours), respectively (table 1). Over the 9-year study period, there was a trend towards an increase in upper body injuries and decrease in lower body injuries (figure 4). IRs are shown separately in U20 and U18 age groups in tables 1 and 2, and figure 5.
Anatomic regions divided to the body parts in World Junior under-18 Championships, World Junior under-20 Championships
Ice hockey injuries by anatomic region in WJ U18 Championships and WJ U20 Championships

Annual percentage of head and face, upper body, lower body, and spinal and trunk injuries in World Junior Under-18 (WJ U18) Championships and World Junior under-20 (WJ U20) Championships including trend lines for upper body and lower body injuries.
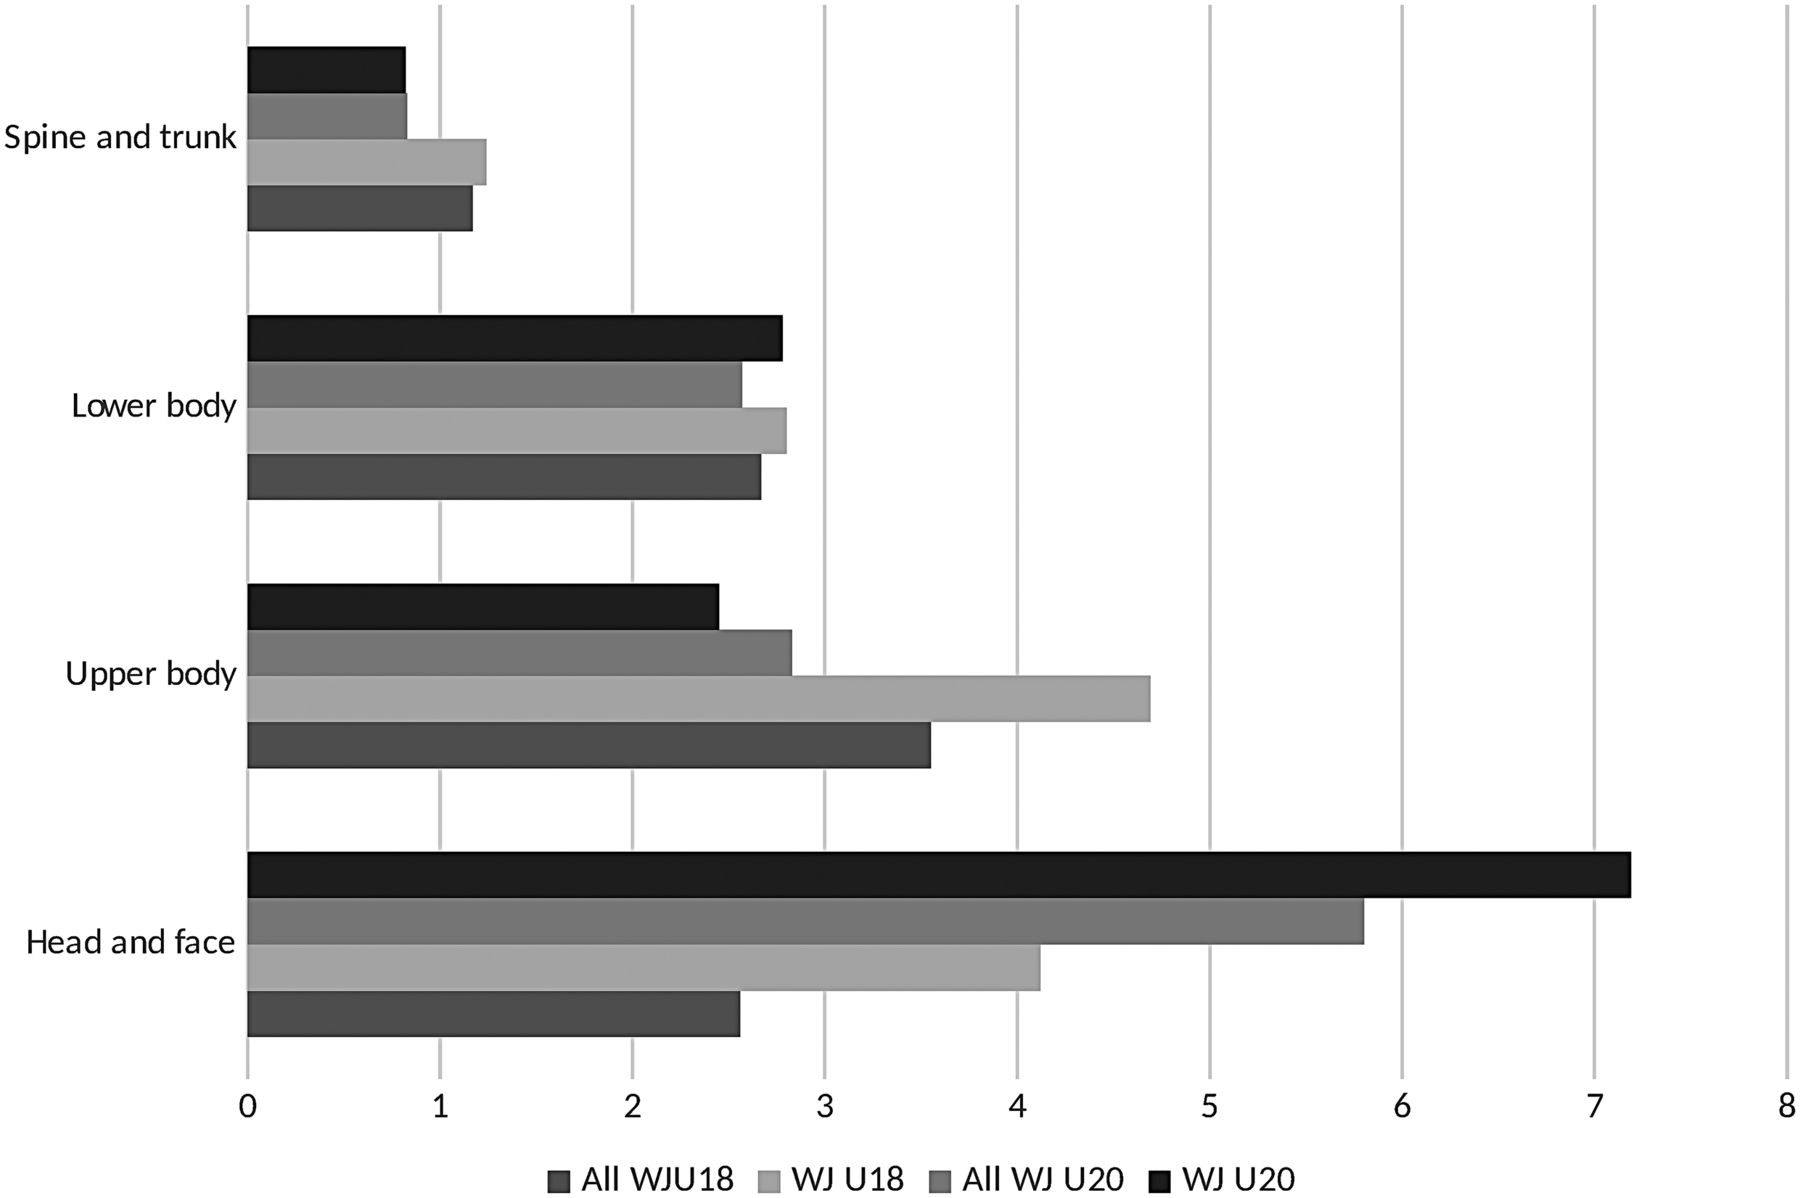
Injury rate by anatomic region per 1000 player-games in all World Junior under-20 (WJ U20) Championships, WJ U20 Championships (A-pool), all World Junior under-18 (WJ U18) Championships and WJ U18 Championships (A-pool).
Head and face injuries
The head and face were the most common sites of injury in WJ U20 tournaments (48%; IR 5.8/1000 player-games; 20.6/1000 player-game hours) and the face was the most common location (tables 1 and 2, and figure 5). Facial injuries comprised 76% of the head and face injuries in all WJ U20 Championships with an IR of 4.4 per 1000 player-games (in WJ U20 A-pool 78%; IR 5.6). A laceration was diagnosed in 80% (IR 3.6) of the facial injuries. Forty-one per cent of facial lacerations were caused by a stick and a penalty was called in 18% of them. The dental IR was 0.7 (11% of the head injuries; in WJ U20 A-pool 15%; IR 1.1). No eye injuries were reported.
In WJ U18 tournaments, concussion was the most common head and face injury (46%; IR 1.2/1000 player-games; 4.2/1000 player-game hours). Forty-four per cent of injuries were lacerations (IR 1.1) while 7% were dental injuries (IR 0.2). In WJ U18 tournaments, 47% of the head and face injuries involved the face with an IR of 1.2/1000 player-games. In WJ U18 A-pool tournaments, a laceration was the most common head and face injury (52%; IR 2.1) and the IR for concussion was 1.5 (36%).
Upper body injuries
The shoulder was the most common location for an upper body injury in WJ U18 and U20 tournaments (58%). The shoulder IR was 1.8/1000 player-games (6.7/1000 player-game hours; tables 1 and 2). Acromioclavicular joint sprain (59%) was the most frequent diagnosis. In WJ U20 tournaments, the shoulder IR was 1.7 (WJ U20 A-pool IR 1.5). The IR in WJ U18 tournaments was 2.0 (WJ U18 A-pool IR 2.4). Finger (9%; IR 0.3) and wrist (8%; IR 0.3) injuries were the second and third most common upper body injuries.
Lower body injuries
The knee was the most frequent site of lower body injury in WJ U18 and U20 tournaments (33%). The knee IR was 0.9/1000 player-games (3.1/1000 player-game hours; tables 1 and 2). A medial collateral ligament (MCL) sprain (40%) was the most common knee injury. Disruption of the ACL was responsible for 6% of all knee injuries. Sixty-five per cent of knee injuries resulted from unintended or intended collisions. Ankle (23%; IR 0.6) and thigh injuries (22%; IR 0.6) were the second and third most common lower body injuries.
Injury types by diagnosis
The vast majority of injuries (90%) were acute in nature and this trend was consistent over the 9-year study period. A laceration was the most common type of injury (24%), followed by a contusion (22%), sprain (18%), concussion (10%) and fracture (10%; figure 6). In the U18 category, a sprain was the most common injury type while in the U20 age group a laceration was the most common type of injury.

Injury rate by diagnosis per 1000 player-games in all World Junior under-20 (WJ U20) Championships, WJ U20 Championships (A-pool), all World Junior under-18 (WJ U18) Championships and WJ U18 Championships (A-pool).
Concussion
Concussions accounted for a small yet clinically important number (n=64, 10%) of injuries in the championships. The concussion IR was 1.1/1000 player-games (4.0/1000 player-game hours) in all WJ tournaments, 1.2 in WJ U18 tournaments (IR 1.5 in WJ U18 A-pool) and 1.0 in WJ U20 tournaments (IR 1.3 in WJ U20 A-pool; figure 6). The two most common causes for concussion were checking to the head (48%) and body check (23%). Illegal hits caused 63% of the concussions and a penalty was called in 53% of the events when checking to the head or checking from behind caused a concussion. For those players diagnosed with a concussion, 6% returned to play in the same game. The majority of concussions occurred before the 2012 Zurich Consensus Guidelines, which stated that a concussed athlete should not return to play in the same game. The wing position (IR 0.5/1000 player-game hours) had the highest risk of concussion, followed by defence position (IR 0.4) and centre (IR 0.1). The majority of concussions occurred during the third (38%) period.
Contact with the boards
The majority of injuries occurred away from the boards. This trend was apparent in all championships and was similar over the 9-year study period. In WJ U18 tournaments, 36% (IR 3.6; A-pool 4.4) of injuries occurred with board contact while in WJ U20 tournaments 24% (IR 2.9) of the injuries occurred in board contact (figure 7). Shoulder (30%) and head (18%) injuries were most common as a result of contact with the boards. Fifty-four per cent of shoulder injuries were caused by contact with the board (59% in WJ U18). The majority of concussions occurred without contact with the board (52%).

Injury rates for shoulder injuries and injuries occurred with board contact in all World Junior under-20 (WJ U20) Championships, WJ U20 Championships (A-pool), all World Junior under-18 (WJ U18) Championships and WJ U18 Championships (A-pool).
Causes of injury
Injuries were caused by body checking (32%), stick (13%) and puck contact (13%). There was an annual variation in injury causes without a clear time trend. The most common mechanisms for finger, hand and wrist injuries were puck (31%) and stick (18%) contact. In WJ U18 tournaments, body checking caused 39% (A-pool 37%) of all injuries while the stick accounted for only 3% (A-pool 3%). In WJ U20 tournaments, the stick caused 20% (A-pool 22%) of the injuries and the majority of them were to the head and face area (78%). Penalties were assessed 35% of the time for checking to the head injuries and 46% of the time for hitting from behind injuries.
Injury severity
The majority of players who were injured returned to play within 1 week (59%); however, 10% did not return for at least 3 weeks based on an estimate of time recovery. Most of the severe injuries were fractures (38%) and sprains (27%).
Player position, period and zone
Injuries were distributed according to player position as follows: wing 44% (2 wings per team) (WJ U18, 50%; WJ U20, 40%), centre 17% (1 centre per team; WJ U18, 16%; WJ U20, 18%) and defence 32% (2 defences per team; WJ U18, 29%; WJ U20, 35%). The goalkeeper was the least injured of all the players (3%). In WJ U18 tournaments, 50% of the injuries occurred in the wing position. The second and third periods had the highest percentages of injured players (34%, respectively) during the game. Players sustained injuries in the home zone (37%), visitor zone (38%) and neutral zone (17%).
Discussion
This prospective, observational study followed 69 male junior ice hockey World Championship (WC) tournaments over a 9-year period to determine the incidence, type, mechanism and severity of injuries. During the study period, 633 injuries were reported in 10 518 players competing in 1326 games. The total IR was 11.0 per 1000 ice hockey player-games and 39.8 per 1000 player-game hours for all junior tournaments. A laceration was the most common type of injury followed by a contusion. The head and face were injured most frequently (48% of game injuries) in WJ U20 tournaments. The majority of these injuries involved the face (76%) and 80% of the facial injuries were lacerations. The upper body was the most commonly injured anatomic region (36% of game injuries) in WJ U18 tournaments.
The strength of this study includes the large number of players competing in each age group at the highest international level over a 9-year period. The number of injury events was determined with an accepted injury definition that incorporated a specific diagnosis, standardised nomenclature, a reliable data collection instrument and time lost from play.7 Detailed information was collected with two structured and validated questionnaires.17 Data collection was reliable because the MS verified the team roster and collected both the GIR and IRS forms after each game.
The limitations of this study include the fact that injuries were analysed in tournament games only and not in practice or training. Moreover, the injury reporting system relied on the individual team physician to record the mechanism and type of injury. A more accurate description of injury mechanism would require a detailed review of a multiangle video. A more consistent injury diagnosis would require the examination of every injured athlete at each tournament by a single experienced physician. Injury incidence rates were estimated by collective playing time since individual on ice exposure could not be measured. We assumed that six players were on the ice for each team during the 60 min game. Thus, this method did not take penalties or overtime into consideration. The severity of the injury was based on an estimate of time to return to play.
Comparable epidemiology with adult men's hockey
In a similar study of adult men's international ice hockey, the total rate was 52.1/1000 player-game hours for all WC and 59.6 for the WC A-pool tournaments.18 The most commonly injured site was the head and face (40% of game injuries; IR 5.7/1000 player-games). Laceration, especially to the face, was the most common injury type (26% of all injuries). In this study of junior hockey players, the IR for facial lacerations and dental injuries was higher in WJ U20 tournaments than in the adult men's tournaments. In WJ U18 tournaments, a laceration was diagnosed only in 14% of all injuries, most likely due to the fact that full facial protection is mandatory in the U18 category. The transition to a half visor from full face protection in the U20 category increases the risk of injury.19–23
In the study of adult men's international ice hockey injuries, the most common lower body injury involved the knee (47%; IR 2.0/1000 player-games), with the MCL (57% of all knee injuries) being the most frequently injured anatomic structure.18 ACL injury was documented in 11% of all knee injuries. The knee IR for juniors during games was lower (IR 0.9) than in men's games (IR 2.0) and 40% of their knee injuries were MCL sprains. In a similar study of women's international ice hockey, the IR for knee injuries in World Women's Championship U18 tournaments (IR 1.4) was higher than that in the male U18 tournaments (IR 1.0) even though body checking is not allowed in female tournaments. The reasons for a higher risk of knee injury in women are unknown, but could be due to differences in the physical strength and motor skills of the players.24
In this study, the concussion rate for juniors (IR 1.1) was lower than that for adult men (IR 1.4). The risk of shoulder injury for WJ U20 international competition was similar to that for the adult men's tournaments, but it was higher in the WJ U18 tournaments: 1.5/1000 player-games in all adult men's WC and 1.7 in men's A-pool tournaments compared with 1.7/1000 player-games (1.5 in A-pool) in WJ U20 tournaments and 2.0 (2.4 in A-pool) in WJ U18 tournaments. The higher risk of shoulder injuries in the U18 age group could be due to lower muscular strength or more frequent body checks and collisions with the boards.
Comparison of the juniors' WC ice hockey data with that in the USA and Canada
Stuart and Smith2 reported an IR of 96.1/1000 player-game hours in elite Junior A ice hockey in North America. The game IR was highest in the third period. The IR for laceration was 32.4/1000 player-game hours. The anatomic region most often injured was the face (IR 38/1000 player-game hours).2 This study was performed at a time when facial protection was not mandated in the US Hockey League for players aged 18 and older. The lack of any facial protection in a large number of athletes contributed to the high risk of facial trauma, especially lacerations.
Agel and Harvey reported an IR of 18.7/1000 athlete exposure (AE) in men's National Collegiate Athletic Association (NCAA) ice hockey games (term ‘1000 AE in games’ corresponds to ‘1000 player-games’ used in this study). AE was determined by the number of athletes participating in a game or practice regardless of duration or type of exposure. Concussions were the most common injury type followed by shoulder and knee injuries. The average rate of concussion over a 7-year period was 0.7/1000 AEs.25 In another study, Agel et al reported a total IR of 16.3/1000 AEs in men's NAAC ice hockey games. More than one-third of all game injuries were to the upper extremity (34%). Lower extremity (34%) and head/neck injuries (15%) accounted for the majority of other game injuries. The IR for concussion was 1.5.26 It is important to note that full facial protection has been a requirement for all NCAA ice hockey players since 1978.
Flik et al reported an IR of 13.8 per 1000 game AE in American Collegiate men's ice hockey. Only time-lost injuries were collected from the games and practices. Most of the injuries occurred during the first and second periods and concussion was the most common diagnosis.27
In our study, the IR was 12.0/1000 player-games. The risk of injury for junior players competing in IIHF tournaments was lower than that reported for North American players. It is possible that differences in the style of play, officiating and ice surface size between North America and Europe help to explain the lower IR in the WC games.
Summary and conclusions
In summary, this 9-year study showed that the risk of injury to male junior ice hockey players under age of 20 during international tournaments was lower than the reported risk in adult men. Facial lacerations and dental injuries were common in the junior U20 Championships; therefore, full facial protection is recommended for these athletes. Injuries to the shoulder were common in juniors under 18 years. The risk for these injuries could be decreased by better protection and a more flexible board and glass.
What are the findings?
The overall injury rate (IR) in the World Junior Championships was 11.0 per 1000 ice hockey player-games and 39.8 per 1000 player-game hours.
Head and facial injuries were the most commonly injured body parts in World Junior under-20 (WJ U20) tournaments and laceration was the most common injury type.
In World Junior under-18 (WJ U18) tournaments, concussion was the most common head and face injury. Laceration occurred in only 14% of all injuries (all U18 players wore full facial protection).
The risk of shoulder injury in WJ U18 tournaments was higher than that in men's tournaments.
The knee IR in junior games was considerably lower (IR 0.9) than that in men's games (IR 2.0). Forty per cent of juniors' knee injuries were medial collateral ligament sprains.
In WJ U18 tournaments, 36% (IR 3.6; A-pool 4.4) of injuries occurred with board contact while in WJ U20 tournaments this figure was lower, 24% (IR 2.9).
How might it impact on clinical practice in the future?
Full facial protection decreases the risk of facial lacerations and should be recommended for all junior tournaments.
To prevent shoulder injuries involving contact with the boards, a more flexible board and glass should be used.
Enforcing the existing stick rules may decrease the risk of facial injuries in age groups where only half face protection is used.
More effective prevention strategies for shoulder and knee injuries are needed in junior ice hockey; there is evidence that neuromuscular exercises reduce knee injuries.28
More effective prevention strategies for concussion are needed including strict officiating and continuous education of players, officials, coaches and physicians.
Acknowledgments
This study was financially supported by the International Ice Hockey Federation and the Finnish Ministry of Education and Culture. The authors highly appreciate the cooperation of all team physicians, physiotherapists and IIHF Medical Supervisors who volunteered their time to collect the data for this project. We would like to thank the International Ice Hockey Federation Medical Committee and IIHF Director of Sport Dave Fitzpatrick for all practical support.
References
Footnotes
Contributors MT, MJS, MA, PK and JP contributed to the study conception and design. MT carried out the literature search, and coordinated and managed all parts of the study. MT, MJS and MA conducted data collection and performed preliminary data preparations. MT conducted data analyses and all authors contributed to the interpretation of data. MT and JP wrote the first draft of the paper and all authors provided substantive feedback on the paper and contributed to the final manuscript. All authors have approved the submitted version of the manuscript. MT is the guarantor.
Funding This study was financially supported by the International Ice Hockey Federation and the Finnish Ministry of Education and Culture.
Competing interests None declared.
Provenance and peer review Not commissioned; externally peer reviewed.