Article Text

Abstract
Background/Aim Web 2.0 internet technology has great potential in promoting physical activity. This trial investigated the effectiveness of a Web 2.0-based intervention on physical activity behaviour, and the impact on website usage and engagement.
Methods 504 (328 women, 126 men) insufficiently active adult participants were randomly allocated to one of two web-based interventions or a paper-based Logbook group. The Web 1.0 group participated in the existing 10 000 Steps programme, while the Web 2.0 group participated in a Web 2.0-enabled physical activity intervention including user-to-user interaction through social networking capabilities. ActiGraph GT3X activity monitors were used to assess physical activity at four points across the intervention (0, 3, 12 and 18 months), and usage and engagement were assessed continuously through website usage statistics.
Results Treatment groups differed significantly in trajectories of minutes/day of physical activity (p=0.0198), through a greater change at 3 months for Web 2.0 than Web 1.0 (7.3 min/day, 95% CI 2.4 to 12.3). In the Web 2.0 group, physical activity increased at 3 (mean change 6.8 min/day, 95% CI 3.9 to 9.6) and 12 months (3.8 min/day, 95% CI 0.5 to 7.0), but not 18 months. The Logbook group also increased physical activity at 3 (4.8 min/day, 95% CI 1.8 to 7.7) and 12 months (4.9 min/day, 95% CI 0.7 to 9.1), but not 18 months. The Web 1.0 group increased physical activity at 12 months only (4.9 min/day, 95% CI 0.5 to 9.3). The Web 2.0 group demonstrated higher levels of website engagement (p=0.3964).
Conclusions In comparison to a Web 1.0 intervention, a more interactive Web 2.0 intervention, as well as the paper-based Logbook intervention, improved physical activity in the short term, but that effect reduced over time, despite higher levels of engagement of the Web 2.0 group.
Trial registration number ACTRN12611000157976.
- Physical activity
- Randomised controlled trial
- Accelerometer
This is an Open Access article distributed in accordance with the Creative Commons Attribution Non Commercial (CC BY-NC 4.0) license, which permits others to distribute, remix, adapt, build upon this work non-commercially, and license their derivative works on different terms, provided the original work is properly cited and the use is non-commercial. See: http://creativecommons.org/licenses/by-nc/4.0/
Statistics from Altmetric.com
Introduction
Physical activity (PA) is associated with many benefits including reduced risk of cardiovascular disease, type 2 diabetes, some cancers, obesity, depressive symptoms, anxiety and increased quality of life.1 ,2 Only 43% of Australian adults, however, meet minimum recommended guidelines of 150 min of moderate-to-vigorous physical activity (MVPA) per week.3 Physical inactivity continues to be a public health concern across the world.4–7
Diverse PA promotion interventions, using different delivery modes including face-to-face,8 ,9 telephone10–15 and email-based16 ,17 approaches, have been developed and tested. Although success in increasing PA behaviours in the short term has been demonstrated, these effects are rarely maintained over time, and often with only minimal impact at a population health level.18 More novel and engaging approaches for increasing PA, with potential for long-term sustainability and extended population reach, are still needed.
The internet is an increasingly common modality for delivering health promotion (including PA) interventions, due to its potential for extended reach and accessibility.19 ,20 Similar to non-web-based approaches, early (Web 1.0) web-based interventions only showed short-term effects (usually only 3 months) on behaviour change.20–23 This could be due to the static nature of these websites (most commonly an information repository) and lack of interactivity and social support, resulting in poor user engagement and retention.24 ,25 Web 2.0 interventions, however, include more interactive technologies, and provide potential to increase user engagement and retention. These features enable a participation architecture where highly interactive user-focused tools and interfaces allow for personal influence of how information is generated, modified and shared collaboratively.24 ,26 ,27 If used effectively, Web 2.0 features could enhance website engagement, in turn influencing lasting behaviour change, including health-related behaviours.28 ,29
The aim of the WALK 2.0 trial was to compare PA behaviour between individuals using a traditional Web 1.0 PA website and those using an innovative Web 2.0 PA website. Additionally, this study investigated effectiveness of Web 2.0 features in engaging individuals in a PA promotion website, as well as their retention on the website. It was hypothesised that participants in the Web 2.0 group would display significantly higher levels of PA at 3-month, 12-month and 18-month follow-up, compared with those in a Web 1.0 or paper-based Logbook group. The paper-based Logbook group was included as a comparison group that was not dependent on online technology. It was also hypothesised that there would be significantly higher engagement in the Web 2.0 group at 3-month, 12-month and 18-month follow-up, when compared with the Web 1.0 group, as well as greater retention on the website.
Methods
Study design
The WALK 2.0 trial rationale, protocol and baseline participant characteristics have been described previously.30 ,31 In summary, WALK 2.0 is a three-arm randomised controlled trial (RCT) that compared effectiveness of two web-based PA promotion interventions with a paper-based Logbook intervention, on a range of outcomes including PA. The current study only reports on the outcomes of PA (assessed at baseline, 3, 12 and 18 months) and website usage and engagement consistent with study aims.
Participants were recruited from two regions in Australia (South Western Sydney, Central Queensland). The primary recruitment method was personalised invitation letters sent to an extract of individuals selected randomly from the Australian Electoral Commission electoral roll, supplemented with local print media advertisements, emails to university email lists and through people registered with the university as interested in future research. Participants were required to be over 18 years, have internet access, participate in <30 min of MVPA on 5 or more days of the week,32 not have an existing medical condition that contraindicated PA (assessed by the Physical Activity Readiness Questionnaire (PAR-Q)),33 and not have ever been a member of the existing 10 000 Steps programme (ie, the Web 1.0 group in this trial).34
Participants attended an individual induction session where they were fitted with an ActiGraph GT3X activity monitor (ActiGraph, Pensacola, USA) to measure PA over 7 days. Participants attended a baseline measurement session 7 days later, where all remaining outcome measures were assessed by a blinded assessor. All measurement sessions took place at a university laboratory, and the project manager enrolled/assigned participants to groups (March 2012–June 2013). After baseline measures were completed, participants were provided with a pedometer and randomly assigned (equal groups random allocation through a computer-generated algorithm) to one of three trial arms (figure 1): Web 1.0, Web 2.0 or Logbook. The Web 1.0 group participated in the existing 10 000 Steps programme,34 designed to promote PA through an online step log, a pedometer for monitoring PA, individual self-monitoring features and online educational materials. The 10 000 Steps programme has been demonstrated to increase short-term PA.35 ,36 Participants in the Web 2.0 group were provided access to a website (WALK 2.0) designed specifically for this trial. This website incorporated the core 10 000 Steps features as well as Web 2.0 tools to promote user-to-user interaction. These Web 2.0 tools were based around social networking capabilities including befriending individual users to create a ‘friend’ list, private messaging to other users, posting ‘status updates’ on current activity which could be ‘liked’ or commented on by other users, an ‘activity stream’ consisting of the most recent status updates from all users, participating in a ‘virtual walking group’ that contributed towards a monthly step goal and user blogs. Participants in the Web 1.0 and Web 2.0 groups were emailed a link (URL) to their respective websites that allowed them to set up personal log-in details that took them to their personal home page. Logbook group participants were provided with a paper-based logbook that contained the same key written messages available through the other two intervention arms (eg, instruction on goal setting, increasing PA opportunities. log activity). Participants were able to access and use these interventions for the entire period of the trial (ie, 18 months).
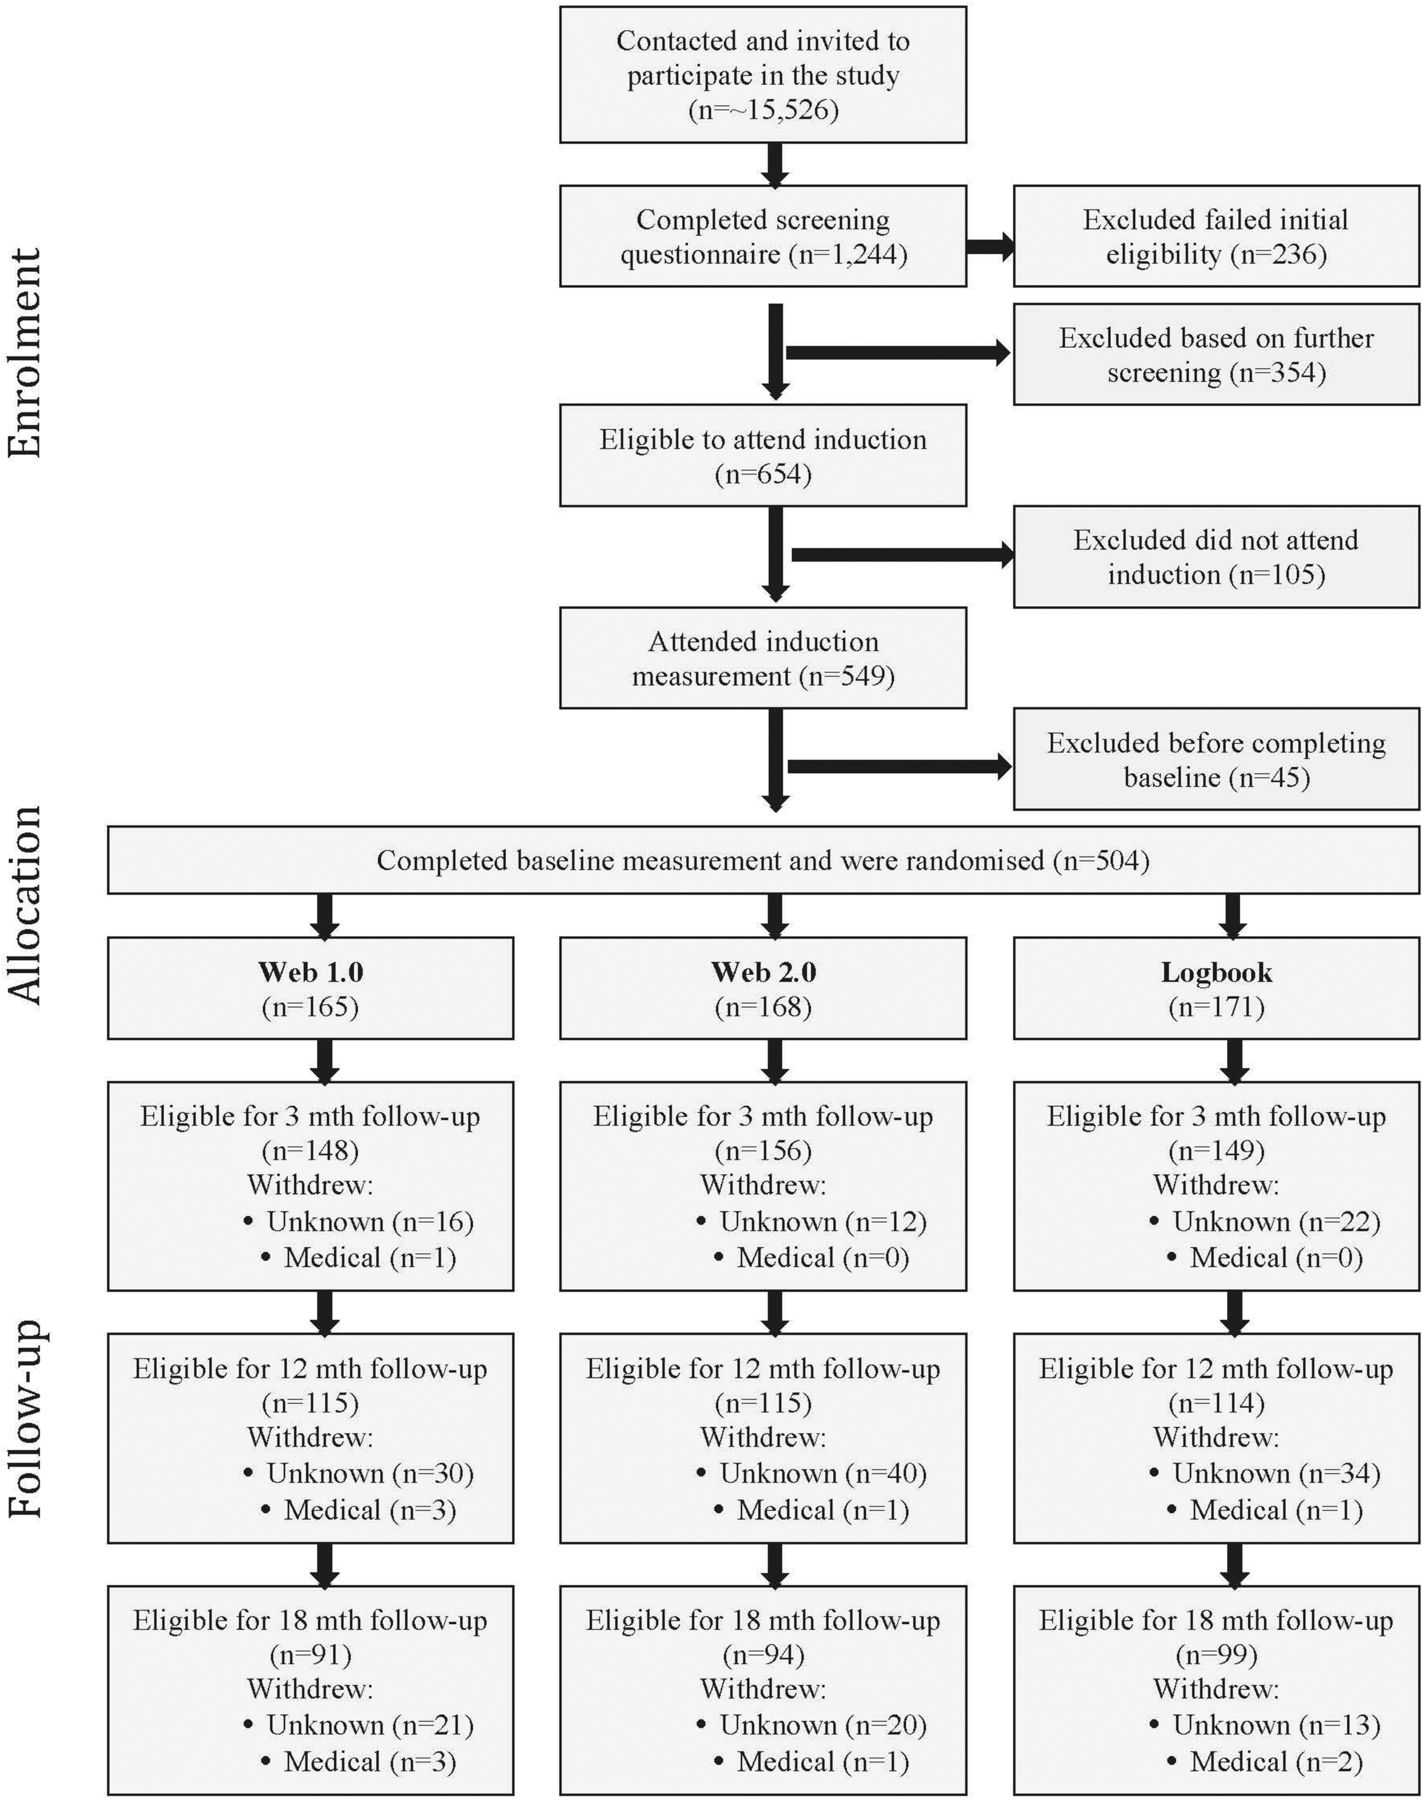
Flow of study protocol.
Participants
Detailed sample characteristics have been previously reported.31 Briefly, the 504 participants were 50.8±13.1 (mean±SD) years, had a body mass index (BMI) of 29.3±6.0, were mostly women (n=328, 65.1%) and had completed a certificate, diploma or university degree (n=364, 72.2%).
Physical activity measure
PA was assessed using the ActiGraph GT3X activity monitor during all waking hours over 7 days. Monitors were initialised to collect triaxial acceleration data using 1-second epochs, and data were aggregated to 60-second epochs using Actilife software 6.6.3. A customised Microsoft Excel macro was used to provide daily measures of MVPA (>1951 counts/min)37 and wear time, based on activity counts per minute. Non-wear time was defined as 60 min of consecutive zero counts, and included a 2 min spike tolerance of 50 counts/min of movement. Valid wear time was defined as ≥10 hours on ≥5 days, within a 7-day period.
Website usage, engagement, usability and internet self-efficacy
Data from each intervention website were used to collect information on a range of participant usage and engagement measures, including the total number of days a participant entered steps in the step log per week and annotated the step log entries with a comment. Google Analytics was used to estimate average time spent on the website each week and average number of visits per week. For comparability, all four measures were averaged relative to each participant's assessment date, or date of withdrawal from the trial. These metrics are commonly reported in website interventions, and reflect participants' engagement and usage of intervention websites.35 ,36 Similar to previous research,36 time until a participant's first occurrence of not entering steps for a minimum of 2 weeks was used as a measure of non-usage attrition,36 an indicator of website non-usage attrition.
Website usability ratings were assessed at all follow-up points with the reliable and valid System Usability Scale,38 ,39 a 10-item scale assessing participant usability of a range of the interface technologies (score from 0 to 100).
Internet self-efficacy was assessed with the Internet Self-Efficacy Scale, which has been shown to have good reliability and internal consistency.40
Sample size and power analysis
Sample size was based on the primary outcome measure of minutes of MVPA. A review of web-based PA interventions suggests that studies which do not include aspects of Web 2.0 had a small effect on change in PA.25 Given the expected enhanced effect of Web 2.0, this study was powered to detect a small-to-moderate difference in MVPA between groups (Web 2.0, Web 1.0, Logbook) with 80% power at any given time point. To achieve this, ∼120 participants per group were required (α level of 0.05). The number of participants per group was inflated by 40% (n=168 per group) to account for expected participant dropout while retaining adequate power to achieve study aims at 18 months (long-term follow-up).
Data analyses
Statistical analyses of change in PA were programmed using Statistical Analysis Software (SAS) V.9.4 (SAS Institute, Cary, North Carolina, USA). Analysis of website engagement and usage measures and internet self-efficacy was conducted using the Statistical Package for the Social Sciences (SPSS). Stata V.14.1 was used to determine non-usage attrition from the website data and analysis of non-usage attrition between groups. Results are presented within each treatment group using means and SDs for continuous variables, and counts or percentages for categorical variables.
Primary analysis of endpoints was intention-to-treat, where between-group differences in the change from baseline to follow-up at 3, 12 and 18 months were assessed using linear mixed models. Primary models included fixed effects for treatment group (Logbook as referent), time (baseline as referent) and the interaction between treatment group and time. Between-subject heterogeneity was modelled with a subject-level random intercept, and various forms of the residual correlation structure were explored (compound symmetry, autoregressive, unstructured). The decision of the residual correlation structure was guided by inspecting correlations over time of the data. Empirical SEs (Huber-White) were used for all analyses. Potentially confounding variables (gender, age at baseline, BMI, education, accelerometer wear time) were included in the model as a sensitivity analysis. Within-group changes from baseline, and adjusted differences between treatment groups in change from baseline, are presented with 95% CIs.
Independent t-tests were used to compare website usage and engagement measures between Web 2.0 and Web 1.0 groups at each time point, and internet self-efficacy at baseline only. A log-rank test was used to compare time from randomisation to non-usage attrition between groups, and Kaplan-Meier estimates of the survival distributions for time to non-usage attrition are also plotted. Independent t-tests were used to compare average System Usability Scale ratings between groups at 3 months only.
Results
Table 1 shows baseline participant data. There were no statistically significant differences between groups, except for BMI, where the Web 2.0 group had a lower proportion of obese participants. There was also no significant difference (p=0.81) in Internet Self-Efficacy Scale scores between Web 1.0 (mean±SD=5.14±1.43) and Web 2.0 (mean±SD=5.10±1.54).
Characteristics of participants at baseline
Summary statistics for minutes/day of MVPA at each time point are presented in table 2.
Summary of minutes per day of MVPA at each time point
Table 3 provides a summary of the unadjusted and adjusted changes over time within each group, and differences between groups at each time point. The pattern of results was similar in the unadjusted and adjusted analyses.
Analysis of minutes per day of MVPA (unadjusted and adjusted), results from the linear mixed effects model
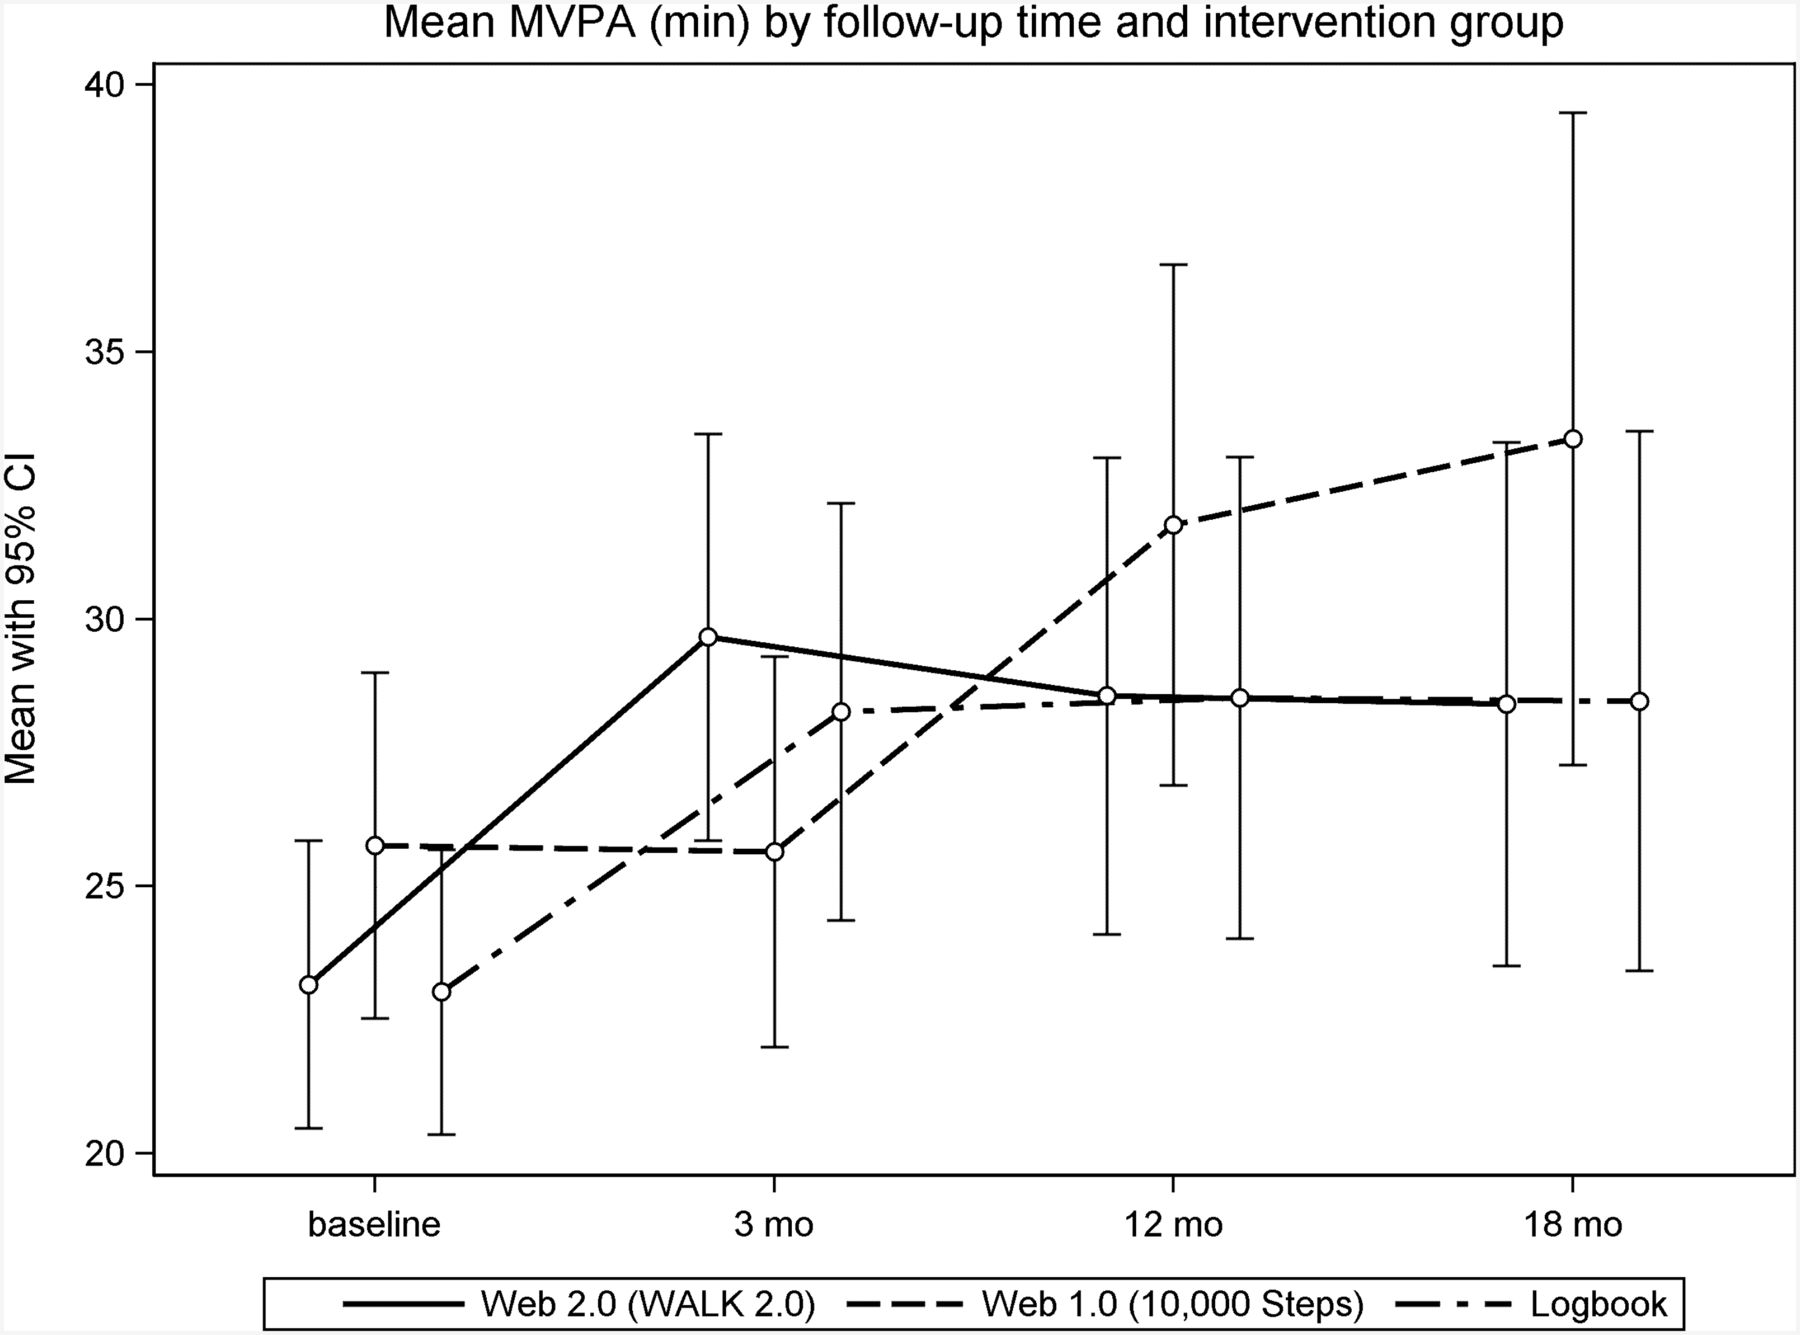
There were significant group×time interactions in the unadjusted (p=0.0197) and adjusted (p=0.0198) models, indicating that changes in MVPA from baseline over time differed between groups. This appears to be primarily driven by the between-group differences in change at 3 months post baseline (figure 2 and table 3), where the Web 2.0 and Logbook groups had significantly greater increases in activity at 3 months post baseline compared to the Web 1.0 group. At 3 months, there were significant changes in minutes of MVPA from baseline for Web 2.0 (mean change=6.8 min/day, 95% CI 3.4 to 10.2) and Logbook (mean change=4.8, 95% CI 1.8 to 7.7) groups. At 12 months post baseline, the change in MVPA remained stable for Web 2.0 (mean change=3.8 min, 95% CI 0.5 to 7.0) and Logbook (mean change=4.9, 95% CI 0.7 to 9.1) groups. At 12 months post baseline, the Web 1.0 group also demonstrated significant change from baseline (mean change=4.9, 95% CI 0.5 to 9.3). At 18 months, no significant increases in MVPA, or between-group differences in the change in activity, were observed.

Mean MVPA (min) (95% CI) by intervention group. MVPA, moderate-to-vigorous physical activity.
The Web 2.0 group had significantly higher average number of days per week with a step entry, average time per week on the website and average number of website visits per week at 0–3, 3–12 and 12–18 months compared with the Web 1.0 group (table 4). The Web 2.0 group had a significantly greater average number of days per week with a step comment in comparison with the Web 1.0 group at 0–3 months; however, this was no longer statistically significant at 3–12 and 12–18 months.
Comparison between groups on website usage and engagement measures
Non-usage attrition occurred in 85% and 80% of the Web 1.0 and Web 2.0 groups, respectively, with no significant differences between groups in the time to non-usage attrition (log-rank test p=0.3964, figure 3). Average System Usability Scores were not significantly different between Web 1.0 (mean=64.12, SD=10.21) and Web 2.0 (mean=63.91, SD=10.20) groups at 3 months.

Kaplan-Meier estimates of the survival distribution for time to non-usage attrition.
Discussion
This study examined the effectiveness of a Web 2.0 website compared with a Web 1.0 website and a paper-based logbook for increasing PA. This study also investigated the effectiveness of Web 2.0 features in engaging individuals in a PA promotion website compared with those of a Web 1.0 website.
Changes in physical activity
Analyses showed that, in the short term (ie, 3 months), those in the Web 2.0 group had a greater increase in MVPA than the Web 1.0 group. At 12-month follow-up, however, there was no difference between the Web 2.0 and Web 1.0 groups, with both groups participating in significantly higher levels of MVPA than at baseline. There was no evidence for differences between groups in changes from baseline at the longer term follow-up (18 months).
Differences in MVPA between the Web 2.0 and Web 1.0 interventions in the short term partially support our first hypothesis that those in the Web 2.0 group would show higher levels of PA than those in the less interactive Web 1.0 group. This, however, did not hold for 12-month or 18-month follow-up. It could be that the greater interactivity and engagement (demonstrated through our findings) of Web 2.0 approaches is sufficient to engage participants and improve PA only in the short term, and that the ‘novelty’ of this greater interactivity is insufficient to generate a longer term effect. That said, however, the level of engagement was significantly higher in Web 2.0 than Web 1.0 participants at all time points. It could be that the magnitude of these differences was not great enough to have longer term impacts. The literature shows only short-term gains in PA from Web 1.0 interventions,20–22 with the suggestion that the more static nature of such websites has not provided opportunity for interactivity and engagement to levels that may be achieved from Web 2.0 websites.24 These earlier findings do not support those of the current study where the Web 1.0 group showed significant gains at 12 months.
Another explanation for the lack of a statistically significant effect of the Web 2.0 intervention at 18 months is that RCTs allow only for a very limited ‘community of interest’ (and one not known to the participant) among which to interact and share materials and content. This idea accords with the suggestion that the highly controlled nature of RCTs inhibits the dynamic nature of testing online social networks, and that more ecologically focussed research designs, that take into account real-world conditions, are needed to advance this field.41 This is particularly important given that Web 2.0 interventions are designed around giving users a greater sense of control over the generation, modification and sharing of website content. Stronger results, and possibly better sustainability of treatment effects, may have been found if participants were able to invite their friends onto the website to participate in the intervention, and if new people joined the website over time. A recent systematic review supports this notion and indicates that the majority of intervention studies do not leverage well enough the participatory nature of user-generated content to enhance health interventions.28
Of interest, was that the Logbook intervention, supported by a pedometer to monitor and record PA, also led to increased MVPA at 3 and 12 months. This was likely also impacted by the accountability of participants through the other assessments they were required to undertake. Previous studies have also shown the effectiveness of print-based interventions to increase PA in physically inactive adults, with such interventions demonstrated to be particularly effective in maintaining PA in the longer term.13 Taking this into consideration, it would be interesting to test a web-based intervention supplemented by print-based material and pedometers to identify whether effects could be enhanced or made more sustainable. A systematic review has also shown the effectiveness of pedometers in increasing PA.42
Website usage, engagement and usability
The second hypothesis of this study, that there would be significantly higher engagement, usage and retention in the Web 2.0 than Web 1.0 group at 3-month, 12-month and 18-month follow-ups, was supported. Compared with those in the Web 1.0 group, the Web 2.0 group reported higher frequency of entering steps to the website, higher average number of visits to the website and higher average time spent on the website. These findings support those of earlier research that also found that the greater interactivity of Web 2.0 approaches led to greater engagement and usability in a range of health promotion interventions.43 ,44 It should be noted, that overall, a high proportion of participants in both web-based groups reached the point of non-usage attrition. This is not uncommon in internet-based interventions,45 and has been suggested to be related to such interventions not being as highly ‘prescriptive’ as non-internet-based interventions used in other trials. Rather, usage of the intervention is at the discretion of the participant and the participant can opt to discontinue usage very easily.
Strengths and limitations
Major strengths of the trial were its long-term follow-up (18 months), use of validated and objective outcomes, inclusion of insufficiently active adults and comparison with an existing and successful Web 1.0 intervention. An important limitation of this study was the rapid pace at which web-based technologies change. Within the context of a gold-standard RCT (with long-term follow-up), technologies engaged for the intervention at its design stage may be different from those in common use by the time the trial ends. A recent systematic review28 suggested that study designs are needed that allow for the constantly and rapidly changing information technology landscape. Designs that allow for research and development to run concurrently with prototype development would allow interventions and their components to be evaluated in real time, and allow healthcare to keep pace with that of changing technologies. A further limitation could be the lack of a true (ie, no treatment) control group. That said, our main purpose was to compare the additional features of Web 2.0 technologies with those of an existing Web 1.0 intervention. Moreover, print-based materials have proven effective, and thus form a strong basis to examine whether more contemporary and less costly (when implemented at large scale) web-based interventions are more effective. The usability ratings of the websites, being slightly below average System Usability Scores,46 may also be seen as a potential limitation to the trial, and may have influenced the observed changes in PA.
Conclusion
The WALK 2.0 trial shows that, in comparison with a Web 1.0-based intervention, a more interactive Web 2.0-based intervention significantly improved MVPA in the shorter term, but that the effect was reduced in the long term. As well, a paper-based Logbook intervention was shown to be effective in increasing MVPA in the shorter term. The trial also showed that the Web 2.0 intervention led to greater engagement of participants in the short and longer term, and greater retention on the website. Future research should focus on examining how this greater engagement and retention can be harnessed to increase PA levels in insufficiently active adults, and examining the specific elements of web-based interventions in greater detail to establish their relative contributions to engagement and health behaviour change. These findings also have relevance to sport and exercise medicine practice, which has increasingly looked to adding incidental or more general PA to rehabilitation-specific exercise regimes. These findings provide evidence to practitioners around the various physical promotion approaches that may be effective for their patients.
What are the findings?
A Web 2.0 physical activity promotion intervention (10 000 Steps programme plus interactive social networking features) and a paper-based Logbook physical activity promotion intervention improved physical activity levels better than a Web 1.0 physical activity promotion intervention (10 000 Steps programme) at 3 months. No differences between groups existed at 12 and 18 months.
A Web 2.0 physical activity promotion intervention led to greater website engagement than a Web 1.0 physical activity promotion intervention in the short and longer term.
A Web 2.0 physical activity promotion intervention led to longer retention on the website than did a Web 1.0 physical activity promotion intervention.
How might it impact on clinical practice in the future?
More interactive Web-based interventions should be used by sport and exercise medicine professionals to promote physical activity.
Sport and exercise medicine professionals can utilise Web-based interventions to improve general physical activity as an adjunct to rehabilitation-specific exercise regimes.
Acknowledgments
The authors thank Professor Stewart Trost (Queensland University of Technology) for providing the excel macros used to analyse the data.
References
Footnotes
Contributors GSK, WKM, AJM, CV, MJD and CMC conceived the project and procured the project funding. GSK led the coordination of the trial. GSK, RRR. AJM, CV, MJD, CMC and WKM assisted with the protocol design. TNS managed the trial including data collection with data management from AVI. AJM and RT developed the IT platform for the trial and MJD performed the sample size calculations. CO conducted the initial analysis for this paper. GSK, MJD, RRR and CO interpreted the data. GSK, MJD and CMC drafted the manuscript, and all authors read, edited and approved the final manuscript.
Funding This trial was funded by the National Health and Medical Research Council (Project grant number 589903). The funder did not have any role in the study other than to provide funding. MJD (ID 100029) and CV (ID 100427) are supported by a Future Leader Fellowship from the National Heart Foundation of Australia.
Competing interests None declared.
Ethics approval Ethical approval for the WALK 2.0 trial was granted by the Human Research Ethics Committees of Western Sydney University (Reference Number H8767) and Central Queensland University (H11/01-005). All participants gave consent to participate.
Provenance and peer review Not commissioned; externally peer reviewed.
Data sharing statement The data set supporting the conclusions of this article will not be shared at present as it is still being used for analysis of other outcomes for the WALK 2.0 randomised controlled trial.
Linked Articles
- Warm up