Article Text

Abstract
Background Concussions in sports are a growing concern. This study describes the incidence, injury characteristics and time trends of concussions in international ice hockey.
Methods All concussions in the International Ice Hockey Federation (IIHF) World Championships (WC) and Olympic Winter Games were analysed over 9 ice hockey seasons between 2006 and 2015 using a standardised injury reporting system and diagnoses made by the team physicians.
Results A total of 3293 games were played (169 tournaments, 1212 teams, 26 130 players) comprising 142 244 athletic game exposures. The average injury rate (IR) for concussion was 1.1 per 1000 ice hockey player-games for all IIHF WC tournaments. The IR was the highest in the men's WC A-pool tournaments and Olympic Games (IR 1.6). However, the annual IR for concussion in the men's tournaments has been lower than that in the World Junior tournaments since 2012. When a concussion occurred with contact to a flexible board, the IR was 0.2 per 1000 player games. In contrast, the IR was 1.1, if the board and glass were traditional (for the latter, RR 6.44 (95% CI 1.50 to 27.61)). In the men's tournaments, the trend of concussions caused by illegal hits decreased over the study period. After the 4th Consensus Statement on Concussion in Sport was published (2013), none of the concussed players in the men's WC returned to play on the day of injury.
Conclusions The annual risk of concussion in the men's WC has decreased during the study period. This was most likely due to a reduction in illegal hits. The risk of concussion was significantly lower if games were played on rinks with flexible boards and glass. Rink modifications, improved education and strict rule enforcement should be considered by policymakers in international ice hockey.
- Ice hockey
- Concussion
- Injury prevention
- Epidemiology
- Head
This is an Open Access article distributed in accordance with the Creative Commons Attribution Non Commercial (CC BY-NC 4.0) license, which permits others to distribute, remix, adapt, build upon this work non-commercially, and license their derivative works on different terms, provided the original work is properly cited and the use is non-commercial. See: http://creativecommons.org/licenses/by-nc/4.0/
Statistics from Altmetric.com
Introduction
Ice hockey is a collision sport executed on a hard ice surface surrounded by a perimeter of board and glass. Players reach high skating velocities and rapidly change direction. The fast-moving puck, swinging sticks and six players per team in a small space contributes to risk of concussion.1–8
The International Ice Hockey Federation (IIHF) is responsible for ice hockey at the Olympic Winter Games (Olympic Games) and coordinates the annual IIHF World Championships (WC) at all skill levels of men (WS), women (WW), juniors under-20 years (WJ U20), juniors under-18 years (WJ U18) and women under-18 years (WW U18). A total of 28 WC tournaments, 10 Olympic Qualification tournaments and a Youth Olympic tournament were held in collaboration with the local organising committees during the 2015–2016 season.
In all WC tournament games, the active playing time is three periods of 20 min each. The main difference between male and female ice hockey rules is that body checking is legal in the men's game. Intentional body checking is not permitted in any level of women's ice hockey.1 ,9–12 The equipment is similar for all ice hockey players, except facial protection. All female and male U18 players must wear full-facial protection (full cage or shield), but male players over 18-year of age are allowed to wear partial-facial protection (visor). In addition, mouth guard is mandatory in WJ U20 category for players wearing visor.13 The exact size of a hockey rink and its sections (offensive zone, neutral zone and defensive zone) varies among arenas but not between sex, age or levels of tournament.14 Modern rink materials have flexibility and the capacity to absorb the energy of players colliding with boards and perimeter glass; this has led to the gradual replacement of traditional rinks with modern flexible material.15
Concussion in sport is a clinical syndrome of traumatically induced transient disturbance of normal brain function. The lateral and temporal area of the head are the most common areas to be struck resulting in concussion. In ice hockey, concussion impacts are more likely to occur from contact with another body part or object rather than another head. Differences in mechanisms of injuries have been found between men and women.10 The diagnosis of concussion relies on a clinician's evaluation. Injury mechanics, visible signs, reported symptoms, changes in cognitive and/or physical performance and exclusion of a more severe neurotrauma are the fundamentals of clinical assessment.16–20 The systematic collection of all ice hockey injuries shows that concussion is one of the most common injury type resulting to missed participation in both sexes.21–29 Furthermore, growing concerns on the possible lingering detrimental effects of concussion have addressed the need for preventive measures.30
We aimed to describe the incidence of concussions in international ice hockey. In addition, we examined and analysed possible contributing factors, including: (1) injury causes, (2) injury location on the ice, (3) the period of the game, (4) player position and (5) contact with the board at the time of the incident. We also examined the differences in concussion rates stratified by sex, age groups and the level of play to help develop concussion recognition and prevention programmes at all levels of play.31
Methods
During the nine ice hockey seasons between 2006–2007 and 2014–2015 (from 1 July 2006 to 30 June 2015), we registered, with the permission from the IIHF, all ice hockey injuries from the 169 ice hockey tournaments. Forty-four of them were World Senior Championships (WS) (10 of them were A-pool tournaments), two Olympic Winter Games (Olympic Games), and eight Olympic Qualification tournaments. Seventy tournaments were World Junior under-18 and under-20 Championships (WJ U18; WJ U20) (19 of them were A-pool tournaments). Forty-three tournaments were women's World Championships (WW) (14 of them were A-pool tournaments) and two Olympic Games. Fifteen of the women's World Championships were women's under-18 tournaments (WW U18). A total of 3293 games were played in the 169 tournaments by 1212 teams (26 130 players) comprising 142 244 athletic game exposures.
Before each tournament, a team medical personnel meeting allowed the IIHF Medical Supervisor (MS) to review the definition of each injury, game injury report form (GIR) and the injury report system (IRS, figure 1) form with the individual team physicians. The definition of an injury was made in accordance with the accepted international ice hockey norms. Minor injuries that allowed the athlete to continue playing and did not require medical attention were not included. An IRS form was completed when one of the following criteria was observed:
any injury sustained in a practice or a game that prevented the player from returning to the same practice or game;
any injury sustained in a practice or a game that caused the player to miss a subsequent practice or game;
a laceration which required medical attention;
all dental injuries;
all concussions;
all fractures.

Injury report system form of the International Ice Hockey Federation.
The individual team physician followed all the players on their team and submitted the GIR form to the MS after each contest. The GIR form was used to verify the number of injuries that satisfied the definition (figure 2). The team physician was also required to complete a detailed injury report (IRS form) for every injury. The IRS form was returned to the MS during the tournament as soon as all the sufficient information had been obtained and the final diagnosis was confirmed. The IIHF MS assigned to each championship was responsible for the data collection. The IRS form was filled out only once for each injury and included detailed information on the game period, ice location, mechanism, anatomic site, severity and specific injury diagnosis. The anonymous forms were returned to the IIHF Medical Committee for insertion into a computer-based IRS for ice hockey injuries (Medhockey, Medisport, Finland).

Game injury report form of the International Ice Hockey Federation.
The injury rate (IR) was expressed as the number of injuries per 1000 ice hockey player-games and per 1000 player-game hours. These two different IR definitions were used to allow comparison with other ice hockey leagues, and other sports (rugby, football, basketball).32–35
The population-at-risk or player exposure to injury was determined by an estimation of the collective playing time. The number of player-games was based on 20–22 players competing for each team in a game depending on the specific level and year of a given tournament. Only the participating athletes were included in the denominator when calculating the incidence of injury.
The player-game IR was an average risk of injury for 1 individual player per 1000 games (# injuries/# players (2 teams)/# games×1000=injuries per 1000 player-games). The IR for 1000 player-game hours was based on a 60 min active game with five players and a goalie per team on the ice at the same time (# injuries/# players on ice same time (2 teams) / # games×1000=number of injuries per 1000 player-game hours).
Concussion was a clinical diagnosis made by a team physician. At the Team Medical Personnel Meeting, physicians were advised to follow the recommendations provided by the Consensus Statement on Concussion in Sport and were given the Sport Concussion Assessment Tool (SCAT) to use as a tool in making the clinical diagnosis.16–19 Concussions that occurred during practice were excluded because there were very few documented injuries (n=3, 2%); therefore, the given IRs in this study refer to game injuries only. Time loss was used as a proxy to determine the injury severity. The severity was graded into four groups by the team physician according to the IRS form (figure 1). Concussions caused by illegal contact were defined to checking to head (CTH), checking from behind, stick, fighting and body contact in female games. All other concussions were caused by legal reasons (figure 1).
The outcomes from A-pool tournaments are reported separately, because the tournaments represent the highest level of international championships in each age group. The injury results are presented as total numbers, percentages and rates (injuries per 1000 player-games and per 1000 player-game hours). Risk ratios (RRs) and 95% CIs for concussion were calculated by comparing traditional board and glass with flexible board and glass. RRs were also used to compare differences between the sexes. ORs and 95% CI were calculated to determine the association between player's positions, groups, causes, the arena characteristics and concussions. ORs were calculated for the senior women's WC and WW U18 tournaments separately.
Results
Incidence of injury
Concussions accounted for 10% of all injuries in the championships, including 160 concussions reported in 3293 games. The average IR for concussion per 1000 ice hockey player-games was 1.1 for all IIHF WC. The annual IR ranged between 0.7 (2007) and 1.6 (2012). The results of the different groups can be found in table 1.
Injury rate for concussion per 1000 player-games and per 1000 player-hours in all World Championships (WC) at all skill levels of men (WS), women (WW), juniors under-20 years (WJ U20), WJ U20 A-pool, juniors under-18 years (WJ U18), WJ U18 A-pool, all WW, WW A-pool and WW U18 tournaments
Annual IR for concussion
The time trend of concussions and annual IRs are shown in figure 3. The IR for concussion was highest in the men's world Championships A-pool tournaments and Olympic Games. In the men's tournaments, the IR for concussion decreased, especially in WS A-pool tournaments. The annual IR for concussion in the men's tournament has been lower than that in the WJ tournaments since 2012. The trends of annual IRs for concussion in WJ U18 and WJ U20 tournaments were slowly increasing (figure 3). In the WW tournaments, no clear time trend was observed.

Annual injury rates per 1000 player-games for concussion in the World Senior, World Junior under-20 and under-18 and women's World Championships tournaments.
Contact with the boards
The majority of concussions occurred away from the boards (56%; IR 0.6). This trend was apparent in all championships and was similar over the nine-season study period with the exception of the seasons 2007–2009. In the WJ U20 A-pool tournaments, 72% (IR 1.0) and in WW U18 tournaments 67% (IR 0.9) of concussions occurred without board contact. IR for concussions that occurred with board contact was highest in the WS A-pool (IR 0.7) and WJ U18 (IR 0.7) A-pool tournaments.
Flexible board and glass
The men's A-pool WC tournaments that were played in arenas with flexible board and glass had an overall concussion IR of 1.0 per 1000 player-games, when compared with 2.0 per 1000 player-games when traditional boards and glass were in place (for the latter, RR 2.07 (95% CI 1.06 to 4.04)). When concussion occurred with board contact, the IR was 0.2 per 1000 player games when flexible board and glass was used, compared with the IR 1.1 when traditional board and glass was used (for the latter, RR 6.44 (95% CI 1.50 to 27.61)). There were no differences between the IRs of concussions when the concussion occurred without board contact: traditional board and glass (IR 0.9) versus flexible board and glass (IR 0.8) (figure 4).

Injury rate for concussion per 1000 player-games when traditional or flexible board and glass was used and when concussion occurred with or without board contact.
Causes of concussion
The most common situation leading to concussion was contact with another player (89%) (WS A-pool 91%). Concussions were caused mainly by a CTH (42%), body checking (23%), checking from behind (13%) and unintended collision (UC) (13%). Ninety per cent of the concussions caused by checking from behind occurred with contact to the board. The highest IR for concussion caused by CTH were in WJ U18 (56%) and WJ U20 A-pool (61%) tournaments (IR 0.8, respectively). In the WW tournaments, concussion was caused mainly by UC (34%; IR 0.3) and body checking (31%; IR 0.3). Fighting caused 3% of the concussions in all the tournaments and 7% in the WS A-pool tournaments (figure 5).

Injury rates per 1000 player-games for causes of concussions.
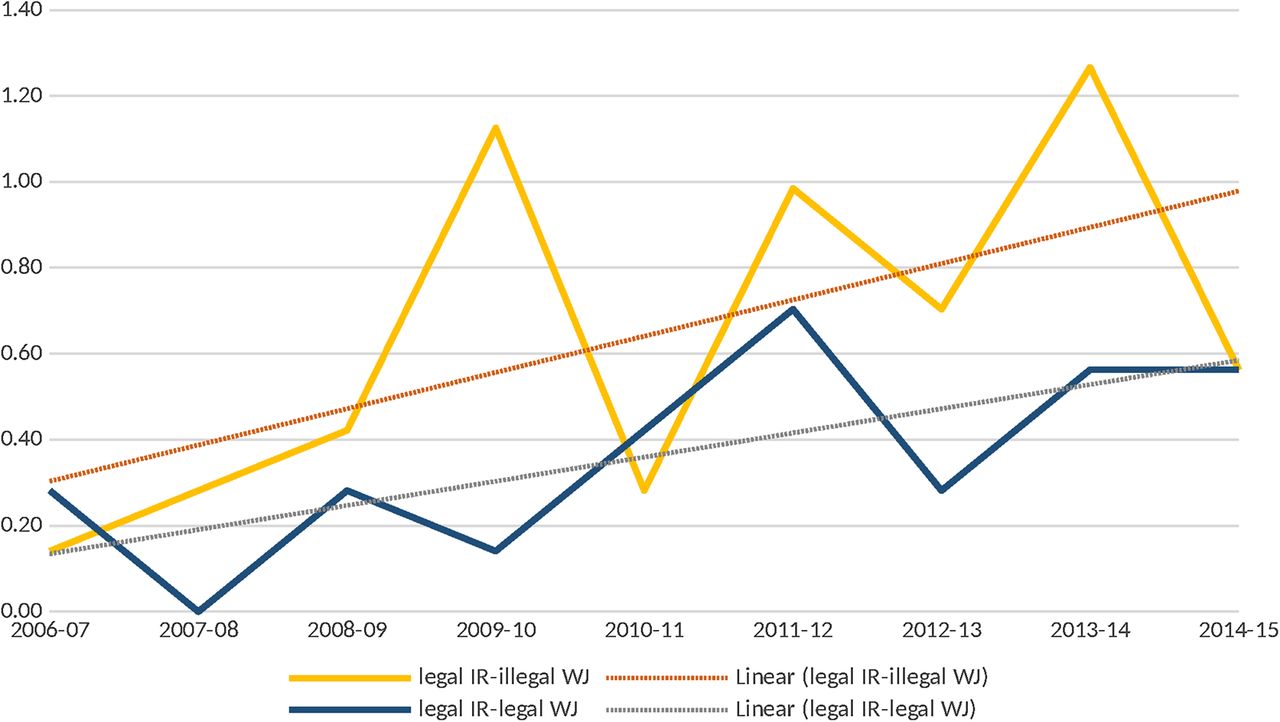
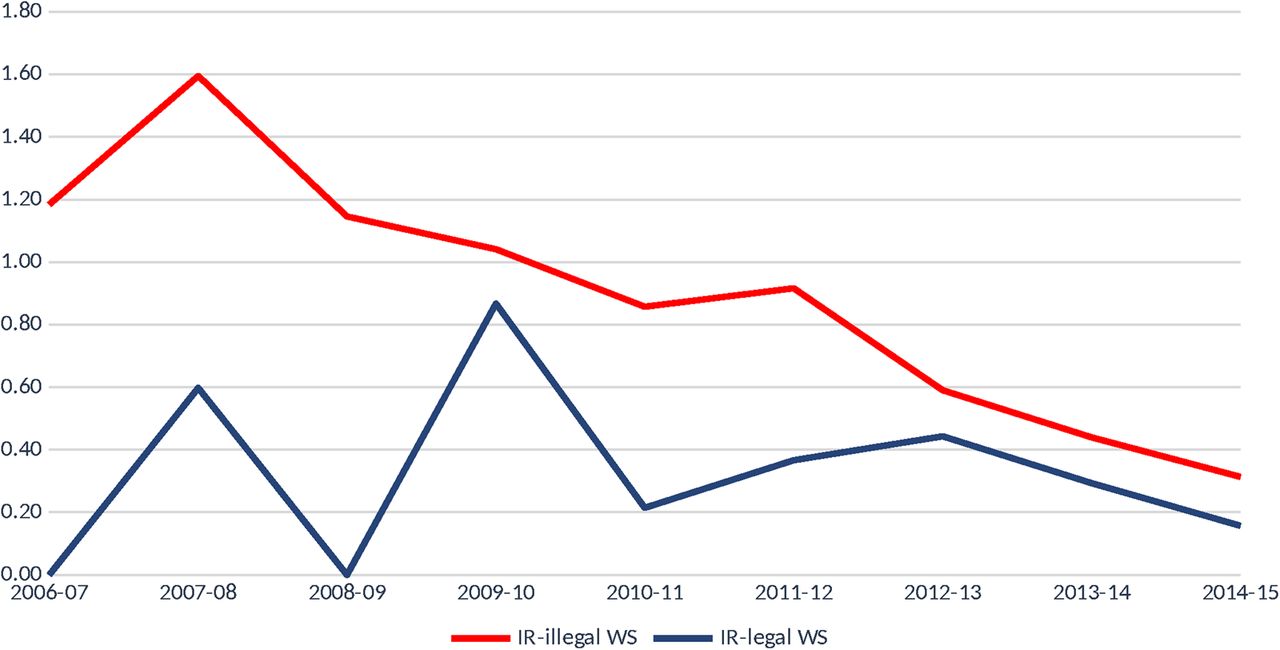
Sixty-six per cent of the concussions were caused by illegal contact. In all the tournaments, the trend of annual IR for concussion caused by illegal contact was slowly decreasing and the trend of annual concussion IR caused by legal reasons was slowly increasing. In the WS tournaments, the trend of the annual concussion rate caused by illegal contact was significantly decreasing, but the trend for legally caused concussion remained stable (figure 6). In the WJ tournaments, the trends of annual concussion rate caused by illegal or legal reasons were increasing (figure 7). Penalties were assessed in 31% of concussions. In 40% of concussion caused by CTH and in 50% of concussions caused by checking from behind, a penalty was called.

Annual injury rate per 1000 player-games for concussion in the World Senior Championships tournaments caused by legal or illegal hit.
Annual injury rate per 1000 player-games for concussion in the WJ tournaments (World Junior under-20 and under-18 Championships) caused by legal or illegal hit.
Injury severity
Nine per cent of the players who were diagnosed a concussion returned to play on the day of injury. In the WS tournaments, 14% of the concussed players returned to the same game (in the WS A-pool 8%) before the publication of the 2012 Zurich Consensus Statement (no return to play in the same game following a concussion).19 Following the 4th Consensus Statement on Concussion in Sport was published (2013), publication none of the concussed players in WS tournaments returned to the same game. However, in other tournaments, the percentage of return during the same day were similar before and after 2012 Zurich Consensus Statement.
Player position, period and zone
Concussions were distributed according to player position: wing 37% (WS A-pool 41%) (two wings per team), centre 23% (WS A-pool 26%) (one centre per team) and defence 38% (WS A-pool 33%) (two defences per team). The goalkeeper was the least injured of all positions (1%). In the WS A-pool tournaments, 67% of concussions occurred among forwards and 33% among defence. The centre had the highest concussion rate in the WS A-pool tournaments (IR 0.4) and women's tournaments (45%; IR 0.4). In the WJ U18 tournaments, wing (53%; IR 0.6; two wings per team) had the highest risk for concussion compared with the other positions.
There were no differences between the periods. Percentages of periods for concussed players were 33%, 31% and 31% during the games. Few concussions occurred during the warm up or overtime. In the WS A-pool games, 43% of the concussions occurred during the first period. The third period had the lowest IR. In the WJ U18 and WW tournaments, the lowest IR was during the first and the highest during the third period.
Players sustained concussions in the home zone (36%) (WS A-pool 41%), visitor zone (37%) (WS A-pool 35%) and neutral zone (23%) (WS A-pool 24%). In the WJ U20 A-pool tournaments, 28% of the concussions occurred in the neutral zone.
Concussion rate for men was higher than women, but the results were statistically non-significant (RR 1.29 (95% CI 0.87 to 1.91)). Results related to the player's position, cause of concussion and the arena characteristics are summarised in table 2.
Association between player's positions, groups, causes, the arena characteristics and concussions
Discussion
Our prospective, observational study from 2006 to 2015 monitored 169 ice hockey World Championship tournaments and Olympic Games over 9 ice hockey seasons to determine the incidence and circumstances of concussion. The diagnosis accounted for 10% of all injuries in the championships, including 160 concussions in 26 130 players who competed in 3293 games. The concussion rate was 1.1 per 1000 ice hockey player-games and 4.0 per 1000 player-game hours. The highest concussion rate was in the WS tournaments (IR 1.2) and lowest in the WW tournaments (IR 0.9).
World senior A-pool tournaments results compared with the NHL studies
The injury risk for concussions in WS A-pool tournaments was similar to the National Hockey League (NHL). Benson et al36 estimated the incidence of concussions in NHL as 1.8 per 1000 player-game hours, where the athlete-exposure time was estimated based on a roster of 18 skaters and 1 goalie playing in each team per game. The proportion of concussions sustained by a centre was about twice that of defencemen and wingers.36 In our study, WS A-pool tournaments had a similar injury risk for concussion (IR 1.6) and the centre was the most injured position.
Hutchison et al37 ,38 used systematic video analysis of NHL to report that 88% of concussions occurred due to contact with an opponent and 5% involved contact with a teammate. Eight per cent of concussions were due to fighting, although the incidence for this mechanism may be underestimated due to detection bias. Sixty-five per cent of the concussions were sustained by forwards, 32% by defencemen and 3% by goalies. The majority of the concussions occurred in the first period (47%). Concussions were distributed relatively equally in the second (27.9%) and third (25.1%) periods. Forty-five per cent of concussions occurred in the defensive zone, 34% in the offensive zone and 21% in the neutral zone. The most common body part initially contacted by the hitter was the player's head (68%) with 22% of direct head contact from the shoulder, elbow or gloves. A penalty was called 29% of cases of concussions. The present findings from WS A-pool tournaments support the NHL findings by Hutchison et al.37 ,38
The IIHF and the NHL should work together to identifying common mechanisms and institute rules that will help prevent concussions. All hits to the head, whether intentional or unintentional, should be penalised consistent with recent rule changes by Hockey Canada and USA Hockey.
Changes in the annual risk of concussion
Concussion risk in World Senior tournaments has decreased and since 2012, the annual risk of concussion in those tournaments has been lower than that in World Junior tournaments. The concussion rate resulting from illegal hits decreased in the World Senior tournaments but has slowly increased in other tournaments. More attention is needed to decrease the concussion risk in World Junior tournaments caused by illegal hits. Further studies are needed to clarify the effect of improved rule enforcement, disciplinary panel suspensions, player education and attitude on reducing the risk of concussion.
Differences between periods, positions and sex
Most of the concussions at the men's highest level of competition occurred during the first period, when the players are maximally energised and able to apply more force with greater acceleration to contacts. This finding is contrary to the risk analysis in the WJ U18 and women tournaments in which the risk for concussion was least in the first period and highest in the third period when players are expected to be more tired. There may be also an increase in intensity in the third period because of its importance in determining the outcome of the game.
In the WW U18 tournaments, the centre had a statistically significant higher risk for concussion compared with the other positions and most of concussions were caused by body checking or a UC. These results may reflect the fact that girls do not have enough strength and awareness to avoid collisions and are not physically able to withstand a collision. Female sex has been associated with a higher risk of sport-related concussions.3 ,9 ,11 Our study identifies a higher risk of concussion in men, but the result was not statistically significant.
Effect of flexible board and glass
More flexible rink materials and protective installation methods improve impact energy resorption, resulting in lower peak forces and greater stopping distances. These should decrease the risk of concussions.15 ,39 This study is the first to report that the risk of concussion is lower when flexible boards and glass are in use. Installation of flexible board and glass is highly recommended to decrease the risk of concussion and shoulder injuries in all future tournaments, especially in WS and WJ U18 tournaments, where the IRs for shoulder injuries and concussions occurred contact with board were highest.27 ,29
Return to game on the day of injury
None of the concussed players since 2012 returned to the same game in the WS tournaments in keeping with the 4th Consensus Statement on Concussion in Sport (2013).19 Conversely, the policy of returning to competition on the day of injury has not changed in other tournaments.19 We recommend more thorough education on concussion management and effective injury prevention measures are especially needed for the WJ and WW tournaments.
Strengths and limitations
The strengths of this study include the large number of players competing at each age groups' highest international level over a nine-season period. All the injuries were systematically collected and the number of injury events was determined with an accepted injury definition that incorporated a specific diagnosis, standardised nomenclature, a reliable data collection instrument and time lost from play.31 The detailed information was collected with the two structured and validated questionnaires.40 The data collection was reliable as the MSs verified the team roster and collected (and reviewed) the GIR and IRS forms after each game.
The limitations of the study were that injuries were analysed in tournament games only and not in practice or training. The injury reporting system relied on the individual team physician to record the mechanism and type of injury. A more accurate description of the injury mechanisms would require a detailed review of the multiangle game videos. A more consistent and detailed injury diagnosis would require examination of every injured athlete at each tournament by a single experienced physician in concussion. Injury incidence rates were estimated by collective playing time since individual on-ice exposure could not be feasibly measured. We assumed that six players were on the ice for each team during the 60 min game. Thus, this method did not take penalties, overtime or time-lost injuries during a game into consideration.41 The severity of the injury was also based on an estimate of the time to return to play written by the team physician.
What are the findings?
The overall concussion rate in the International Ice Hockey Federation World Championships and Olympic Winter Games was on average 1.1 per 1000 ice hockey player-games and 4.0 per 1000 player-game hours.
The overall risk of concussion was highest in the men's tournaments. However, the concussion rate in the men's tournaments has been decreasing over the 9-year period and since 2012, annual risk of concussion in the men's tournaments has been lower than in the junior tournaments.
The concussion rate caused by illegal hits has been decreasing in the men's tournaments but slowly increasing in the other tournaments.
After the 4th Consensus Statement on Concussion in Sport was published (2013), none of the concussed players returned to play on the day of injury in the men's tournaments. In other tournaments, the conclusions from the Consensus Statement have not been followed as players have returned to play on the day of injury. As this paper goes to press, the 5th Consensus Statement on Concussion in Sport is being finalised (2017 publication, Br J Sports Med).
The risk of concussion was significantly lower when the game was played on an ice rink with a flexible board and glass.
How might it impact on clinical practice in the future?
Flexible boards and glass should be used in ice hockey to help prevent concussions.
Enforcing the existing rules, including head checks and checking from behind, may decrease the risk of concussion.
More effective prevention strategies for concussions are needed, especially in junior and women's ice hockey tournaments.
Improved education of players, officials, coaches and physicians may mitigate concussion risk.
Acknowledgments
The authors highly appreciate the cooperation of all team physicians, physiotherapists and IIHF Medical Supervisors who volunteered their time to collect the data for this project. The authors would like to thank the International Ice Hockey Federation Medical Committee and IIHF Director of Sport Dave Fitzpatrick for all practical support.
References
Footnotes
Contributors MT, TH, JP, MJS, TL, PK and MA contributed to study conception and design. MT and TH carried out the literature search, coordinated and managed all parts of the study. MT, MJS and MA conducted data collection and performed preliminary data preparations. MT conducted data analyses and all the authors contributed to the interpretation of data. MT, TH and JP wrote the first draft of the paper and all authors provided substantive feedback on the paper and contributed to the final manuscript. All authors have approved the submitted version of the manuscript. MT is the guarantor.
Funding This study was financially supported by The International Ice Hockey Federation and the Finnish Ministry of Education and Culture.
Competing interests None declared.
Provenance and peer review Not commissioned; externally peer reviewed.