Article Text

Abstract
Background Cadence (steps/min) may be a reasonable proxy-indicator of ambulatory intensity. A summary of current evidence is needed for cadence-based metrics supporting benchmark (standard or point of reference) and threshold (minimums associated with desired outcomes) values that are informed by a systematic process.
Objective To review how fast, in terms of cadence, is enough, with reference to crafting public health recommendations in adults.
Methods A comprehensive search strategy was conducted to identify relevant studies focused on walking cadence and intensity for adults. Identified studies (n=38) included controlled (n=11), free-living observational (n=18) and intervention (n=9) designs.
Results There was a strong relationship between cadence (as measured by direct observation and objective assessments) and intensity (indirect calorimetry). Despite acknowledged interindividual variability, ≥100 steps/min is a consistent heuristic (e.g, evidence-based, rounded) value associated with absolutely defined moderate intensity (3 metabolic equivalents (METs)). Epidemiological studies report notably low mean daily cadences (ie, 7.7 steps/min), shaped primarily by the very large proportion of time (13.5 hours/day) spent between zero and purposeful cadences (<60 steps/min) at the population level. Published values for peak 1-min and 30-min cadences in healthy free-living adults are >100 and >70 steps/min, respectively. Peak cadence indicators are negatively associated with increased age and body mass index. Identified intervention studies used cadence to either prescribe and/or quantify ambulatory intensity but the evidence is best described as preliminary.
Conclusions A cadence value of ≥100 steps/min in adults appears to be a consistent and reasonable heuristic answer to ’How fast is fast enough?' during sustained and rhythmic ambulatory behaviour.
Trial registration number NCT02650258
- walking
- exercise
- physical activity
This is an Open Access article distributed in accordance with the Creative Commons Attribution Non Commercial (CC BY-NC 4.0) license, which permits others to distribute, remix, adapt, build upon this work non-commercially, and license their derivative works on different terms, provided the original work is properly cited and the use is non-commercial. See: http://creativecommons.org/licenses/by-nc/4.0/
Statistics from Altmetric.com
Introduction
Despite the training advantages associated with more vigorous intensities of physical activity, walking remains the most commonly reported form of exercise.2 Furthermore, ambulatory activity (most apparently walking, including any other bipedal locomotion) is integral to activities performed in the course of transportation, occupation, leisure time and domestic duties for most able-bodied individuals.3 The fundamental unit of human locomotor movement underlying all forms and purposes of ambulation is a step, which can be objectively captured and summarised as steps/day using most contemporary wearable technologies.
A total daily accounting of accumulated steps is a volume indicator of physical activity,4 with no consideration for the variable intensities of effort associated with execution. Advances in many research-grade and commercial-grade wearable technologies have enabled the time-stamped tracking of step accumulation patterns over shorter time frames. Cadence (steps/min) has been strongly linked to objectively measured speed (r=0.97) and intensity (r=0.94) under controlled laboratory conditions (eg, treadmill speeds from 1.8 to 12.1 km/hour).5
We have previously described the potential for moving the study of cadence out of the laboratory and into the study of free-living human step accumulation patterns.3 In the free-living context, step accumulation patterns observed over a minute (ie, cadence) can effectively communicate free-living differences between incidental or sporadic movements and more purposeful movements leading up to the more persistent patterns indicative of walking and running.3 6 Extrapolating from laboratory-based studies of steady state cadence,5 we have described that the intensity of effort will be quite low at zero cadence (no ambulation) and relatively lower values (eg, 1–19 steps/min or incidental stepping; 20–39 steps/min or sporadic stepping; 40–59 steps/min or purposeful stepping).6 As bout length increases, the step accumulation patterns of free-living shift more and more towards one that approximates a rhythmic, continuous, forward-advancing movement pattern more easily recognised as ‘walking’ and associated with increasingly higher intensities.
These walking patterns can be described more appropriately as a rate (slow or 60–79 steps/min, medium or 80–99 steps/min, brisk or 100–119 steps/min and all faster forms of locomotion or 120+ steps/min).6 It is important to emphasise that the lowest cadence bands reflect a step accumulation pattern that is not ‘comically slow motion’ purposeful stepping, but one that is indicative of a naturally incidental or sporadic stepping pattern accumulated in real life.
In 2012, we published a narrative review describing the potential for cadence to represent behavioural patterns of ambulatory activity in free-living contexts.3 The topics covered included: 1) measurement of cadence under controlled conditions, 2) measuring free-living cadence, 3) the relationship between cadence measured under controlled and free-living conditions, 4) measuring change in cadence under controlled and free-living conditions, 5) instrumentation capable of capturing free-living cadence and 6) targeting cadence in physical activity intervention.3 The purpose of this current review is to present the state of evidence supporting benchmark (standard or reference) and threshold (minimums associated with desired outcomes) values for cadence-based metrics as an initial step in addressing ‘How fast is fast enough?’ in terms of clinical and public health recommendations for adults.
This line of inquiry builds on the literature that established ‘How many steps/day are enough?’ for adults5 7 8 and ‘How many steps/day are too few?'.9 We anticipate that the benchmark and threshold values reported herein will be useful for communicating and interpreting cadence-based metrics. This information has potential value and utility across a wide range of audiences, including researchers, clinicians, device manufacturers and the general community. For example, walking cadence can be used to prescribe physical activity (eg, in public health guidelines), shape behaviour (eg, in physical activity interventions and clinical therapeutic programme) and/or analyse behaviour (eg, making sense of data from research-grade and consumer-grade physical activity monitors).
Methods
Search strategy
This is a narrative review informed by a systematic search strategy. The Preferred Reporting Items for Systematic Reviews and Meta-Analyses (PRISMA) statement10 11 was used to guide our overall approach and writing structure, but not all of the PRISMA items were applicable to our review question ‘How fast is fast enough?’ under controlled or free-living conditions.
In July 2017, we systematically searched CINAHL, ERIC, PsycINFO, PubMed, SPORTDiscus and Web of Science search engines using Boolean keyword strings of ‘walk AND (pedometer OR accelerometer) AND ((cadence OR (‘steps per minute’ OR steps/min) OR stride)) to identify relevant studies published in English language since 2000.
Eligibility criteria and study selection
We chose to focus on adults, as cadence-based research in children and adolescents is currently less developed. Review articles, abstracts not linked to any published article and duplicates were initial exclusions. Subsequently, two authors (HH and EJA) independently screened all records by title and abstract. Any discrepancies were resolved by further discussion before proceeding to the full-text screening stage. Inclusion criteria for original research studies of adults were: 1) controlled studies of the relationship between cadence and intensity, or 2) observational studies reporting cadence-based metrics in free-living conditions or 3) intervention studies that had used cadence to prescribe and/or analyse ambulatory behaviour. All coauthors reviewed the list of selected articles and reference sections were scanned to identify any studies that may have been missed on the electronic database search.
Data collection process
Data items extracted and tabulated by HH and EJA were: study design; authors; sample characteristics; measurement methods; protocol; analytical strategy and cadence-related study outcomes. Several authors (EJA, DAR, MK and TVB) shared auditing of this information for quality control. Discrepancies were resolved by consensus. If studies reported cadence-based metrics in terms of stride frequency, we converted these to steps/min (eg, measures in stride were multiplied by 2). Any apparent inconsistencies in contents summarised within and across tables (eg, manners of reporting instrument brand, models, number of decimal points, ages, etc) reflect inconsistent conventions tied to the original articles. Values are generally presented as mean±SD, unless otherwise indicated.
Synthesis of results: categorising and collating benchmark values and heuristic thresholds
After studies were identified, we began synthesising their information by categorising the study designs (controlled, free-living observational, intervention) and the various ways that cadence-based metrics have been defined, captured and reported in the literature. Based on our collective extensive experience and expertise in the field collecting step-based data, we focused on the cadence-based metrics that were most relevant to public health and clinical utility.
We initially approached ‘How fast is fast enough?’ in terms of our current ability to set threshold (ie, minimum) values associated with moderate intensity (ie, the intensity advocated in most public health physical activity recommendations). This can inform tracking real-time intensity relative to enacted cadence and analysis of recorded time spent above objectively monitored cadences. This tactic also echoes accelerometry-based approaches in recent decades that have calibrated time-stamped activity counts in a similar manner; the difference is that activity counts are unit-less summarisations of an acceleration signal, whereas cadence is a more direct interpretation of the accelerometer’s signal in terms that are more congruent with the originating, underlying and observable human ambulatory pattern. Our group consensus process was focused on identifying consistency in heuristic (ie, reasonable, not necessarily precise) values associated with absolutely defined moderate and vigorous intensity as assessed by indirect calorimetry.
We collated free-living observational estimates of time above a range of cadences as initial benchmark values, and categorised published peak cadence indicators (generally the average cadence representing the highest, not necessarily consecutive, 1, 30 or 60 min accumulated in a day) assessed during free-living and related to different health-related outcome variables. This approach provides important benchmark values for these novel metrics and is an initial step in exploring the potential for setting thresholds of ‘best natural effort’. We also catalogued emerging intervention research to identify how cadence-based metrics have been employed to shape and/or evaluate change in daily ambulatory activity accumulation patterns.
Assessment of internal validity and risk of bias
EJA and HH independently evaluated the risk of bias of the nine identified intervention studies using the Cochrane Risk of Bias Tool12 (as suggested by the PRISMA statement).10 11 Any discrepancies in the determination of risk of bias for each study across the individual items of the tool were resolved by discussion until a consensus was reached.
Results
Search strategy and identified cadence-related definitions
Figure 1 presents a PRISMA-inspired flow chart documenting the outcome at each stage of our implemented search process. We identified 38 controlled (n=11), free-living observational (n=18) and intervention studies (n=9) reporting cadence as an explicit or implicit indicator of intensity. Cadence-based metrics and the definitions used in the identified studies are presented in table 1.

Flow of identification, screening, eligibility and inclusion phases for the literature review.
Reported cadence-based metrics and their definitions
Controlled studies of cadence
Table 2 presents 11 controlled studies (sample size ranged from 17 to 226 participants) conducted with adult samples that have focused on determining cadence associated with moderate-to-vigorous physical activity (MVPA), typically defined absolutely in terms of metabolic equivalents (METs; 1 MET=3.5 mL/kg/min of O2 consumption), with 3 METs generally held to be the threshold for moderate intensity.13 One exception14 used 40% of VO2reserve as an indicator of relative intensity associated with cardiorespiratory benefits. Although there is a published study that estimated exercise intensity from monitored heart rate response to increasing cadences,15 table 2 only includes those studies that estimated intensity from indirect calorimetry. Eight studies reported measuring observed steps using a hand tally counter, the other three relied on a record of technology-detected steps taken. Nine studies reported cadences (measured in ostensibly healthy samples) associated with absolutely defined moderate intensity congruent with a heuristic value (ie, reasonably acceptable guiding value) of >100 steps/min. A single study of unilateral transtibial amputees reported that a cadence >85 steps/min was associated with absolutely defined moderate intensity.16
Cadence-based controlled study designs focusing on intensity (ie, MVPA/3 METs) measured with indirect calorimetry
Most samples were relatively young with average ages <40 years. The two studies14 17 focused expressly on older adults presented conflicting findings. Peacock et al17 reported that ~100 steps/min (exactly, 99 steps/min according to personal communication with Dr David Rowe, a coauthor on the study) was generally associated with absolutely defined moderate intensity at 3 METs (a conventional public health intensity marker) but was moderated by age and height (lower cadences with older ages and increased height). In contrast to the Peacock et al17 conclusion that advanced age moderated a lower cadence requirement for absolutely defined intensity at 3 METs, Serrano et al14 concluded that a higher cadence (ie, 115 steps/min) was associated with relatively defined moderate intensity measured at 40% of VO2reserve, a cardiorespiratory fitness-based marker established from a prior maximum fitness test. The three studies that included estimates of absolutely defined vigorous intensity reported values congruent with a heuristic value of >130 steps/min associated with 6 METs in ostensibly healthy samples.18–20
Free-living observational study of cadence
Technology monitored cadence-based data were measured in terms of 1) mean steps/min for the whole day,4 21 22 2) time accumulated in different cadence bands6 23–25 (ie, time spent at zero, 1–19, 20–39, 40–59 steps/min, etc) and/or above a specific cadence threshold indicative of at least moderate intensity (eg, 100 steps/min)18 26 27 and 3) peak cadence indicators (indices of ‘best natural effort’).3 Peak cadence indicator metrics include peak 1 min cadence (the highest single recorded minute of steps in a day),24 28 peak 30 min cadence (an average of the highest, not necessarily consecutive, 30 min of a day)24 28 and peak 60 min cadence (an average of the highest, not necessarily consecutive, 60 min of a day).24 29
Detailed information of studies that have reported peak 1 min and 30 min cadences are presented in table 3. Those studies presented data from approximately 7500 participants/patients. A variety of chronically ill populations as well as healthy participants were represented in these studies and included those adults aged up to ≥90 years. Ostensibly healthy adults aged <60 years had peak 1 min cadences of typically >100 steps/min. Relatively older and/or unhealthy individuals had lower peak 1 min cadences, sometimes in the 70 steps/min range. Smaller studies noted differences between men and women in peak 1 min cadence while studies with more participants did not. Peak 1 min cadence was higher on weekdays compared with weekends.28
Mean values for peak 1 min and 30 min cadences
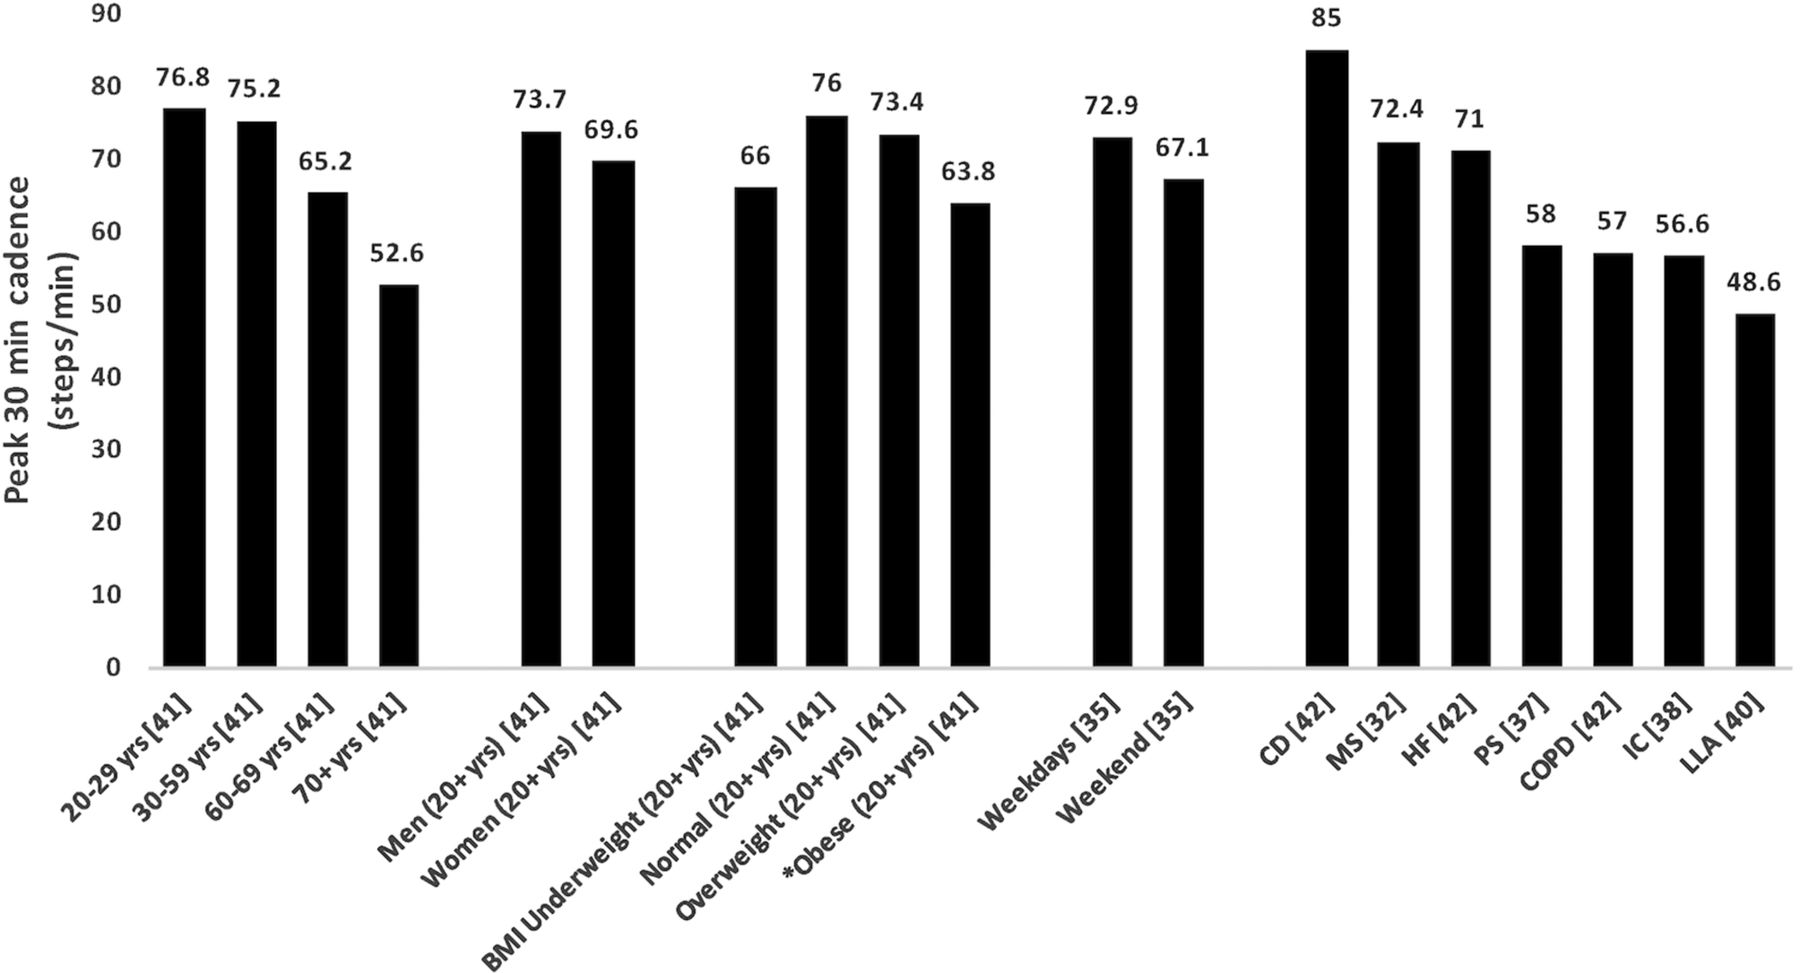
Figure 2 is supplemental to table 3 and graphically depicts peak 30 min cadences reported by age, sex, body mass index (BMI)-defined weight status, weekday versus weekend, day or by specified chronic illness or disability. Where multiple studies reported values based on the same data set, for example, National Health and Nutrition Examination Survey (NHANES), only a single study’s data are presented. Across studies, peak 30 min cadence was negatively associated with age. Peak 30 min cadence was negatively associated with BMI, although individuals in the underweight BMI category had similar peak 30 min cadences to those classified as obese. Individuals with one or more diseases had lower peak 30 min cadences than ostensibly healthy individuals. Natural breaks in the data for peak 30 min cadence are unclear. Relatively younger and/or healthy adults had peak 30 min cadence values >70 steps/min (sometimes >80 steps/min), whereas relatively older and/or unhealthy individuals had peak 30 min cadence values <70 steps/min.
Intervention studies
Nine studies (table 4) either provided cadence-based recommendations as part of an intervention (n=5) or used cadence-based metrics to analyse accelerometer data (n=4). At this early stage in intervention research, cadence-based metrics appear to be readily sensitive to physical activity intervention. An additional focus on manipulating cadence in step-based interventions appears to increase speed of walking and engagement in continuous bouts, but does not seem to lead to more daily steps or consistently to more total time in MVPA. Most studies were at high risk of selection, performance, detection and attrition bias (table 5), indicating an overall high risk of bias (poor internal validity) (table 5).
Expected values of peak 30 min cadence based on age, gender, BMI and various health conditions. CD, cardiac dysrhythmias; COPD, chronic obstructive pulmonary disease; HF, heart failure; IC, intermittent claudication; LLA, lower limb amputations; MS, metabolic syndrome; PS, poststroke; yrs, years. *BMI determined by weighted average obesity classes for obesity class I (30–34.9), II (35–39.9) and III (≥40).
Cadence-related intervention studies
Assessment of risk of bias using the Cochrane Risk of Bias Tool12
Discussion
The surge of availability of commercial wearable technologies capable of detecting minute-by-minute step accumulation patterns presents an opportunity to provide cadence-based values to guide and monitor healthful ambulatory activity. Because people wear these devices increasingly frequently, there is a need for guidance on how to monitor and interpret these data. However, such devices are not absolutely necessary to track cadence as it can be simply determined by manually counting the number of steps accumulated during a 1 min period (or 15 s multiplied by 4, or 10 s multiplied by 6) or more crudely by dividing the total number of steps accumulated during a bout of exercise by the duration of the bout (eg, 3000 steps/30 min=100 steps/min). Cadence may also be shaped using rhythmic auditory cues (eg, a metronome) or music.30 31 Therefore, the use of cadence as a marker of physical activity intensity may have clinical and practical value. Furthermore, there is potential for it to be effectively combined with steps/day (an indicator of ambulatory volume) and time spent at zero cadence (an indicator of non-ambulatory or sedentary time) to provide an integrated snapshot of different aspects of human movement/non-movement behaviour.32
Controlled studies of cadence
Perhaps the most compelling observation that can be made is that, despite acknowledged interindividual variability, there is remarkable consistency supporting ≈100 steps/min as a heuristic value associated with the threshold for absolutely defined moderate intensity in ostensibly healthy individuals without movement impairments. This overall consistent finding for a broad heuristic moderate-intensity benchmark value is in stark contrast to the prevailing situation of ‘cut-point wars’ associated with waist and wrist worn accelerometer-determined activity counts, where consensus regarding values associated with intensity markers have proven elusive.
Two studies (Peacock et al17 and Serrano et al14 examined the influence of age on the relationship between cadence and intensity, and reported conflicting findings. The discrepancy is most apparently due to a combination of differences in sample ages and employed definitions of moderate intensity; the need for a maximum fitness test to establish a relative intensity index makes the Serrano approach less practical for non-research purposes (ie, public health applications). A higher cadence might be required for older adults to achieve moderate intensity,33 however, our findings do not support this suggestion, at least in terms of absolutely defined moderate intensity. While older adults have the capacity to walk above 100 steps/min in both laboratory and free-living setting, this does not imply that older adults require a higher cadence to achieve moderate intensity.17 23 Instead, older adults (especially those of advanced age) might require a relatively lower cadence to achieve moderate intensity, although it may be premature to make any firm conclusions due to the limited data available. The CADENCE-Adults study (ClinicalTrials.gov: NCT02650258; in progress) will provide more information to guide specific benchmark values.
Initial evidence suggests that >130 steps/min may be similarly useful as a threshold value indicative of vigorous intensity (ie, ≥6 METs) ambulatory activity. To clarify, achieving 100 or 130 steps/min are both achievable targets for ostensibly healthy adults. The Compendium of Physical Activities34 indicates that walking at 2.5 mph (4.0 km/hour) is a moderate (3 MET)-intensity activity (code 17170). Using the metabolic equations provided for walking energy expenditure provided by the American College of Sports Medicine,35 3 METs corresponds to a walking speed of 2.6 mph (4.2 km/hour). From a controlled treadmill trial of walking at 3.0 and 4.0 mph (4.8 and 5.4 km/hour) in 50 young adults,18 3 METs was the energy expenditure predicted for a speed of 2.7 mph (4.3 km/hour). From a controlled study of overground walking at speeds between 2.0 and 4.0 mph (3.2 and 6.4 km/hour), 3 METs was the predicted energy expenditure when walking at 2.7 mph (4.3 km/hour).36 These data suggest that moderate-intensity walking reliably occurs at a speed of 2.6–2.7 mph (4.2–4.3 km/hour). In addition, slow to fast walking speeds (~2.0–4.0 mph or 3.2–6.4 km/hour, respectively) correspond to a cadence range of 96–134 steps/min,5 further emphasising the practical relevance of 100 steps/min but also 130 steps/min as heuristic cadence-intensity threshold values useful for communicating, prescribing and/or evaluating ambulatory intensity. Although further research is needed to more firmly establish a consistent threshold value for vigorous intensity.
Free-living observational study of cadence
Mean steps/min represents a daily average value that is shaped by the naturally large amount of time spent at zero cadence (both individually and on a population level). As a result, it is very low in absolute magnitude (US adults >20 years of age accumulate an average of 7.7 daily steps/min4). Expressed in terms of average time spent in different cadence bands during daily wearing time, the US adults also accumulate ≅ 4.8 hours at zero cadence, ≅ 8.7 hours at 1–59 steps/min, ≅ 16 min at cadences of 60–79 steps/min, ≅ 8 min at 80–99 steps/min, ≅ 5 min at 100–119 steps/min and ≅ 2 min at 120+ steps/min.6 Although the US adults average approximately 30 min daily at cadences >60 steps/min, time spent at cadences >100 steps/min are low at the population level (3.6% prevalence of averaging at least 30 min/day ≥100 steps/min). Relative to the approximately 1000 waking minutes available in a day,37 it is apparent that for most people, daily continuous, rhythmic walking of at least moderate intensity is quite rare. With so many zero scores for time at this cadence level, analysts will be tempted to simply categorise monitored samples according to whether or not an individual accumulates any time at >100 steps/min. The problem is that this approach misses the opportunity to explore the greater range of individual cadence-based behaviour. Furthermore, although ambulating at a cadence >100 steps/min appears to be a heuristic value congruent with moderate-intensity activity, it remains possible that various health benefits can be realised with lower step accumulation patterns and thus intensities captured as time spent above lower cadence values (eg, >60 steps/min and/or patterns of interrupting zero cadence sequences). This requires further evaluation. However, this approach to setting lower time-based cadence thresholds does not alleviate the problem inherent in studying time accumulated above any set cadence threshold in these strongly positively skewed data.
To better address the issue of skewed data, we suggest using peak cadence indicators to study group/population-level patterns of intensity-related ambulatory behaviour. We describe these as indices of ‘best natural effort,’ shaped by 1) the highest daily personal cadence values accumulated, 2) the relative ‘persistence’ of this behaviour on that day and 3) the habitual regularity of that same behaviour pattern across averaged days.28 As an index value, a peak cadence indicator’s distribution is more likely to approximate normality than conventional time-above-threshold metrics (ie, time spent at or above 100 steps/min), because everyone has a score above zero. We recently reported strong inverse relationships (linear trends; all P<0.001) between quintiles of peak 30 min cadence and numerous cardiometabolic risk factors (eg, weight, BMI, waist circumference, insulin) in an analysis of NHANES 2005–2006 data.32 While only the fifth quintile achieved a peak 30 min cadence (~96 steps for men and women) similar to the heuristic value of >100 steps/min, clinically favourable cardiometabolic risk factor values were also apparent at the third (~70 steps/min) and fourth (~80 steps/min) quintiles compared with the lowest quintiles. This opens up the possibility, assuming corroboration from prospective/intervention study designs, that lower cadences than that associated with absolutely defined moderate intensity may be appropriately prescribed to elicit specific health outcomes.
Intervention studies
One clear application of cadence-based benchmarks and thresholds is for prescription and/or analysis of ambulatory physical activity. However, this has not been extensively studied—we only identified nine intervention studies with our systematic search. These initial findings convey the potential utility of using cadence-based metrics to either shape or identify nuanced changes in patterns of free-living ambulatory behaviour. However, based on the relatively small number of studies identified, and the generally high risk of bias, further high-quality research is needed to better understand the utility of cadence-based physical activity prescription and/or data analysis approaches. While it is premature to synthesise the evidence across studies (eg, using meta-analytic approaches) to specifically quantify the expected change in these novel cadence-based metrics and their potential associations with health-related outcomes, we anticipate high-quality evidence is likely to build on this nascent foundation.
Limitations
We acknowledge the interindividual variability inherent to the cadence and intensity relationship. One possible source of variability is that individuals are likely to adopt different patterns of cadence and step length (based on height/leg length) to modulate increases in walking speed and intensity. A logical question, then, would be to consider the role of step length in determining walking speed and intensity. In a study of gait variability during free-living ambulatory behaviour, cadence was the primary strategy for increasing ambulatory speed up to self-selected preferred speed, and cadence and step length contributed equally beyond this point to achieve faster walking speeds.38 Furthermore, cadence is strongly and consistently related to ambulatory speed and intensity,5 supporting our focus on cadence as a suitable and practical proxy indicator of ambulatory intensity. To reconcile these seemingly conflicting tensions, we assert that both these statements are true: 1) evidence-based heuristic cadence values (eg, ~100 steps/min indicative of absolutely defined moderate intensity intended to communicate public health recommendations) are reasonable and 2) a degree of individualised precision may be achieved by considering stature-related characteristics, and that the usefulness of such individualisation is greater for people who are further from the population average for stature. Either approach (ie, generalised vs individualised) can be rationally defended depending on expressed research, clinical, performance training or public health need.
The minimal amount of time spent at >100 steps/min on a population level is readily acknowledged; a large proportion of any representative population accumulate zero minutes above this threshold. Furthermore, time spent above relatively lower cadences is also associated with various health markers. Time spent above any set value, however, will likely exhibit similar floor (or ceiling, if set too low) effects in terms of measurement characteristics. Peak cadence indicators are derived variables indicative of an individual’s ‘best natural effort’ and their approximately normal distribution in a population is appealing, at least from a data analytic perspective. However, they are not widely familiar. Therefore, it is too early to judge their intervention utility (eg, in terms of acceptability to the general public and practitioners) or to establish firm threshold values for surveillance or screening purposes, public health or clinical messages or programme evaluation.
It is methodologically possible to capture the instantaneous rate of just a few steps taken over smaller time intervals than a minute. However, we believe that consistently using the term cadence (and the unit steps/min) to describe the spectrum of step accumulation patterns up to and including the transition to rates of increasingly faster (and thus more intense) locomotion is reasonable. This amalgamated approach facilitates efficient measurement and communication that transcends the gaps between science, clinical practice and real life. As we have previously argued, the standardised use of a minute as the base unit of time for capturing and describing free-living cadence patterns is also reasonable.3 The step accumulation pattern observed over a minute can effectively communicate free-living differences between incidental or sporadic movements and more purposeful movements leading up to the more persistent patterns indicative of walking and running.3 6 Although shorter time intervals can reveal the abruptness and transience of such movements, the meaningfulness of such reductionist approaches to compartmentalising human free-living movement outside of the laboratory is not our intent.
We predicted3 that some would argue that a shorter time interval would be necessary to capture the speed of brief movement patterns,39 and this may be appropriate for some specific research questions. Of interest, Stanfield et al40 objectively monitored free-living behaviour of individuals with intermittent claudication and a general unlimited sample and clearly demonstrated that differences in time spent in all rate-specific stepping patterns were obscured when cadence was represented as an instantaneous rate but effectively discriminatory when expressed as steps accumulated in a minute. We again assert that ’the purpose of studying free-living minute-by-minute step accumulation patterns is to relay the execution and relative persistence of naturally occurring ambulatory behaviour'3 against an obvious human-scaled unit of time. Therefore, we feel it is appropriate to continue to use the term cadence and its unit of steps/min to efficiently and effectively capture the range of free-living step accumulation patterns that communicate the pace of life.3
Conclusion
Step-counting is now widely accepted in physical activity interventions. Advances in contemporary wearable technologies allow us to also track cadence as a reasonable indicator of ambulatory intensity. Evidence consistently supports a cadence of >100 steps/min as a heuristic threshold value indicative of absolutely defined moderate-intensity ambulatory activity in ostensibly healthy adults. Peak cadence indicators may prove useful for capturing ‘best natural effort’, but the evidence supporting benchmark and threshold values is immature at this time. The prescription and/or evaluation of cadence-based metrics in interventions is preliminary.
What is already known?
Step counting is widely accepted as a valid approach to assessing physical activity.
Cadence (steps/min) is a known temporal gait parameter.
Contemporary wearable technologies are capable of tracking cadence.
What are the new findings?
The heuristic cadence estimate of >100 steps/min is a threshold value of absolutely defined moderate-intensity ambulatory activity in ostensibly healthy adults.
The prescription and/or evaluation of cadence-based metrics in interventions is preliminary.
References
Footnotes
Funding This work was supported by a grant from the National Institute on Aging, National Institute of Health: CADENCE-Adults, 5R01AG049024-03. The content of this manuscript is solely the responsibility of the authors and does not necessarily represent the official views of the National Institutes of Health.
Competing interests None declared.
Provenance and peer review Not commissioned; externally peer reviewed.