Article Text

Abstract
Objective To estimate international and national temporal trends in the cardiorespiratory fitness (CRF) of children and adolescents and to examine relationships between temporal trends in CRF and temporal trends in broad socioeconomic and health-related indicators across countries.
Methods Data were obtained from a systematic search of studies that explicitly reported 20 m shuttle run test (a validated measure of CRF) descriptive data on apparently healthy individuals aged 9–17 years. Following the estimation of relative peak oxygen uptake (mL/kg/min) as a measure of CRF, sample-weighted temporal trends were estimated at the country–sex–age level using best-fitting linear or polynomial regression models relating the year of testing to mean CRF. Poststratified population-weighted mean changes in absolute and per cent CRF were estimated. Pearson’s correlations were used to describe the association between linear temporal trends in CRF and linear temporal trends in broad socioeconomic and health-related indicators.
Results Temporal trends were estimated from 965 264 children and adolescents from 19 high-income and upper middle-income countries between 1981 and 2014, using data from 137 studies. Collectively, there was a moderate decline in CRF of 3.3 mL/kg/min (95% CI −3.5 to −3.1), equivalent to a decline of 7.3% (95% CI −7.8% to −6.7%) over the 33-year time period. This international decline diminished with each decade and stabilised near zero around 2000. The decline was larger for boys than girls and was similar for children and adolescents. Trends also differed in magnitude and direction between countries, with most showing declines. There was a strong negative association between country-specific trends in income inequality (Gini index) and trends in CRF across 18 countries; meaning, countries approaching income equality had more favourable trends in CRF.
Conclusions There has been a substantial decline in CRF since 1981, which is suggestive of a meaningful decline in population health. However, the international trend in CRF has not followed the anticipated trajectory, diminishing and stabilising with negligible change since 2000. CRF data are needed from children in low-income and middle-income countries to more confidently determine true international trends and determine whether temporal trends are similar to those observed in high-income and upper middle-income countries.
- vo2max
- exercise testing
- adolescent
- aerobic fitness
- children
Statistics from Altmetric.com
Introduction
Cardiorespiratory fitness (CRF) is an important marker of good health1 2 and is the fourth leading risk factor for cardiovascular disease.3 In adults, CRF is strongly and independently associated with cardiovascular and all-cause mortality and morbidity,4 ,5 stroke,6 cancer,7 diabetes and many other risk factors and comorbidities.8 A meta-analysis by Kodama et al 9 reported that every metabolic equivalent (3.5 mL/kg/min) decrease in adult CRF was associated with a 15% and 13% increase in cardiovascular and all-cause mortality, respectively. While meaningful associations between CRF and cardiovascular disease risk have been reported in young people,1 10 until recently, the association between CRF and mortality had not been examined directly. Two studies, one that followed-up 1.3 million 18-year-old Swedish men for 29 years11 and another that followed up 510 16-year-old Japanese girls for 64 years,12 found that low CRF in late adolescence was significantly linked with all-cause mortality in adulthood.
Examination of temporal trends in CRF should provide meaningful insight into trends in population health and may help guide and evaluate health programmes, policies and priorities. Although gas analysed peak oxygen uptake ( O2peak) is the criterion measure of children’s CRF,13 it is not practical for mass testing. Properly conducted field-based CRF testing offers a simple, feasible, practical, reliable and valid alternative to gas analysis14 15 and has been widely used on children and adolescents. To date, the most comprehensive summaries of temporal trends in field-based CRF indicate international declines from the mid-1970s to the early 2000s.16 17 Data on 129 882 children and adolescents aged 6–19 years from 11 countries indicated a decline in mean CRF (operationalised as performance on the 20 m shuttle run test (20mSRT)18—a progressive exercise test involving continuous running between two lines 20 m apart in time to recorded beeps) of 4.3% per decade between 1981 and 2000.16 In a follow-up study, mean CRF (operationalised as distance running and 20mSRT performance) was reported to have declined by 3.6% per decade in 25.4 million of individuals aged 6–19 years from 27 countries between 1958 and 2003.17
Unfortunately, little is known about current international and national trends because the data coverage in most studies only extends to 2003, although several (but not all) studies reporting national trends suggest CRF has stabilised in the past decade.19–21 Furthermore, our recent study identified a strong cross-sectional association between country-specific CRF and income inequality (Gini index),22 providing insight into potential population health programmes, policies and priorities. Examining associations between temporal trends in CRF and temporal trends in socioeconomic and health-related indicators could provide further insight into the importance of these indicators and their potential population health implications.
Thus, the present study is a follow-up to several recent studies published using the same dataset.22–24 However, this study provides a unique aim, which was to systematically analyse international and national temporal trends in the CRF among children and adolescents. The secondary aim was to examine relationships between temporal trends in CRF and temporal trends in broad socioeconomic and health-related indicators across countries. We hypothesised that CRF declined since 1981, with the rate of decline possibly slowing over time, and that temporal trends in income inequality would be inversely associated with country-specific temporal trends in CRF.
Methods
Data sources
A systematic review of the scientific literature was prospectively registered (PROSPERO 2013:CRD42013003622) and completed to locate studies that reported descriptive 20mSRT data on individuals aged 9–17 years (see Tomkinson et al 24 for a detailed description of the search strategy). This review was undertaken according to the Preferred Reporting Items for Systematic Review and Meta-Analysis guidelines for systematic reviews.25 Briefly, studies were identified up until October 2015 using the following bibliographic databases: the Cochrane Central Register of Controlled Trials, Embase, MEDLINE, PsycINFO and SPORTDiscus. The search strategy included the terms: shuttle run*, OR beep test, OR multi-stage, OR aerobic, OR cardio*, OR endurance; with child*, adolescen*, pubescen* boy, girl, young and youth as search term modifiers. No search restriction was placed on language. The reference lists of all included studies and personal libraries of the authors were reviewed to identify relevant studies not identified through the search strategy. Email contact with the corresponding authors of studies occurred when necessary, in order to provide clarification, to avoid ‘double counting’ previously reported data and/or to request additional descriptive or raw data.
Inclusion/exclusion criteria
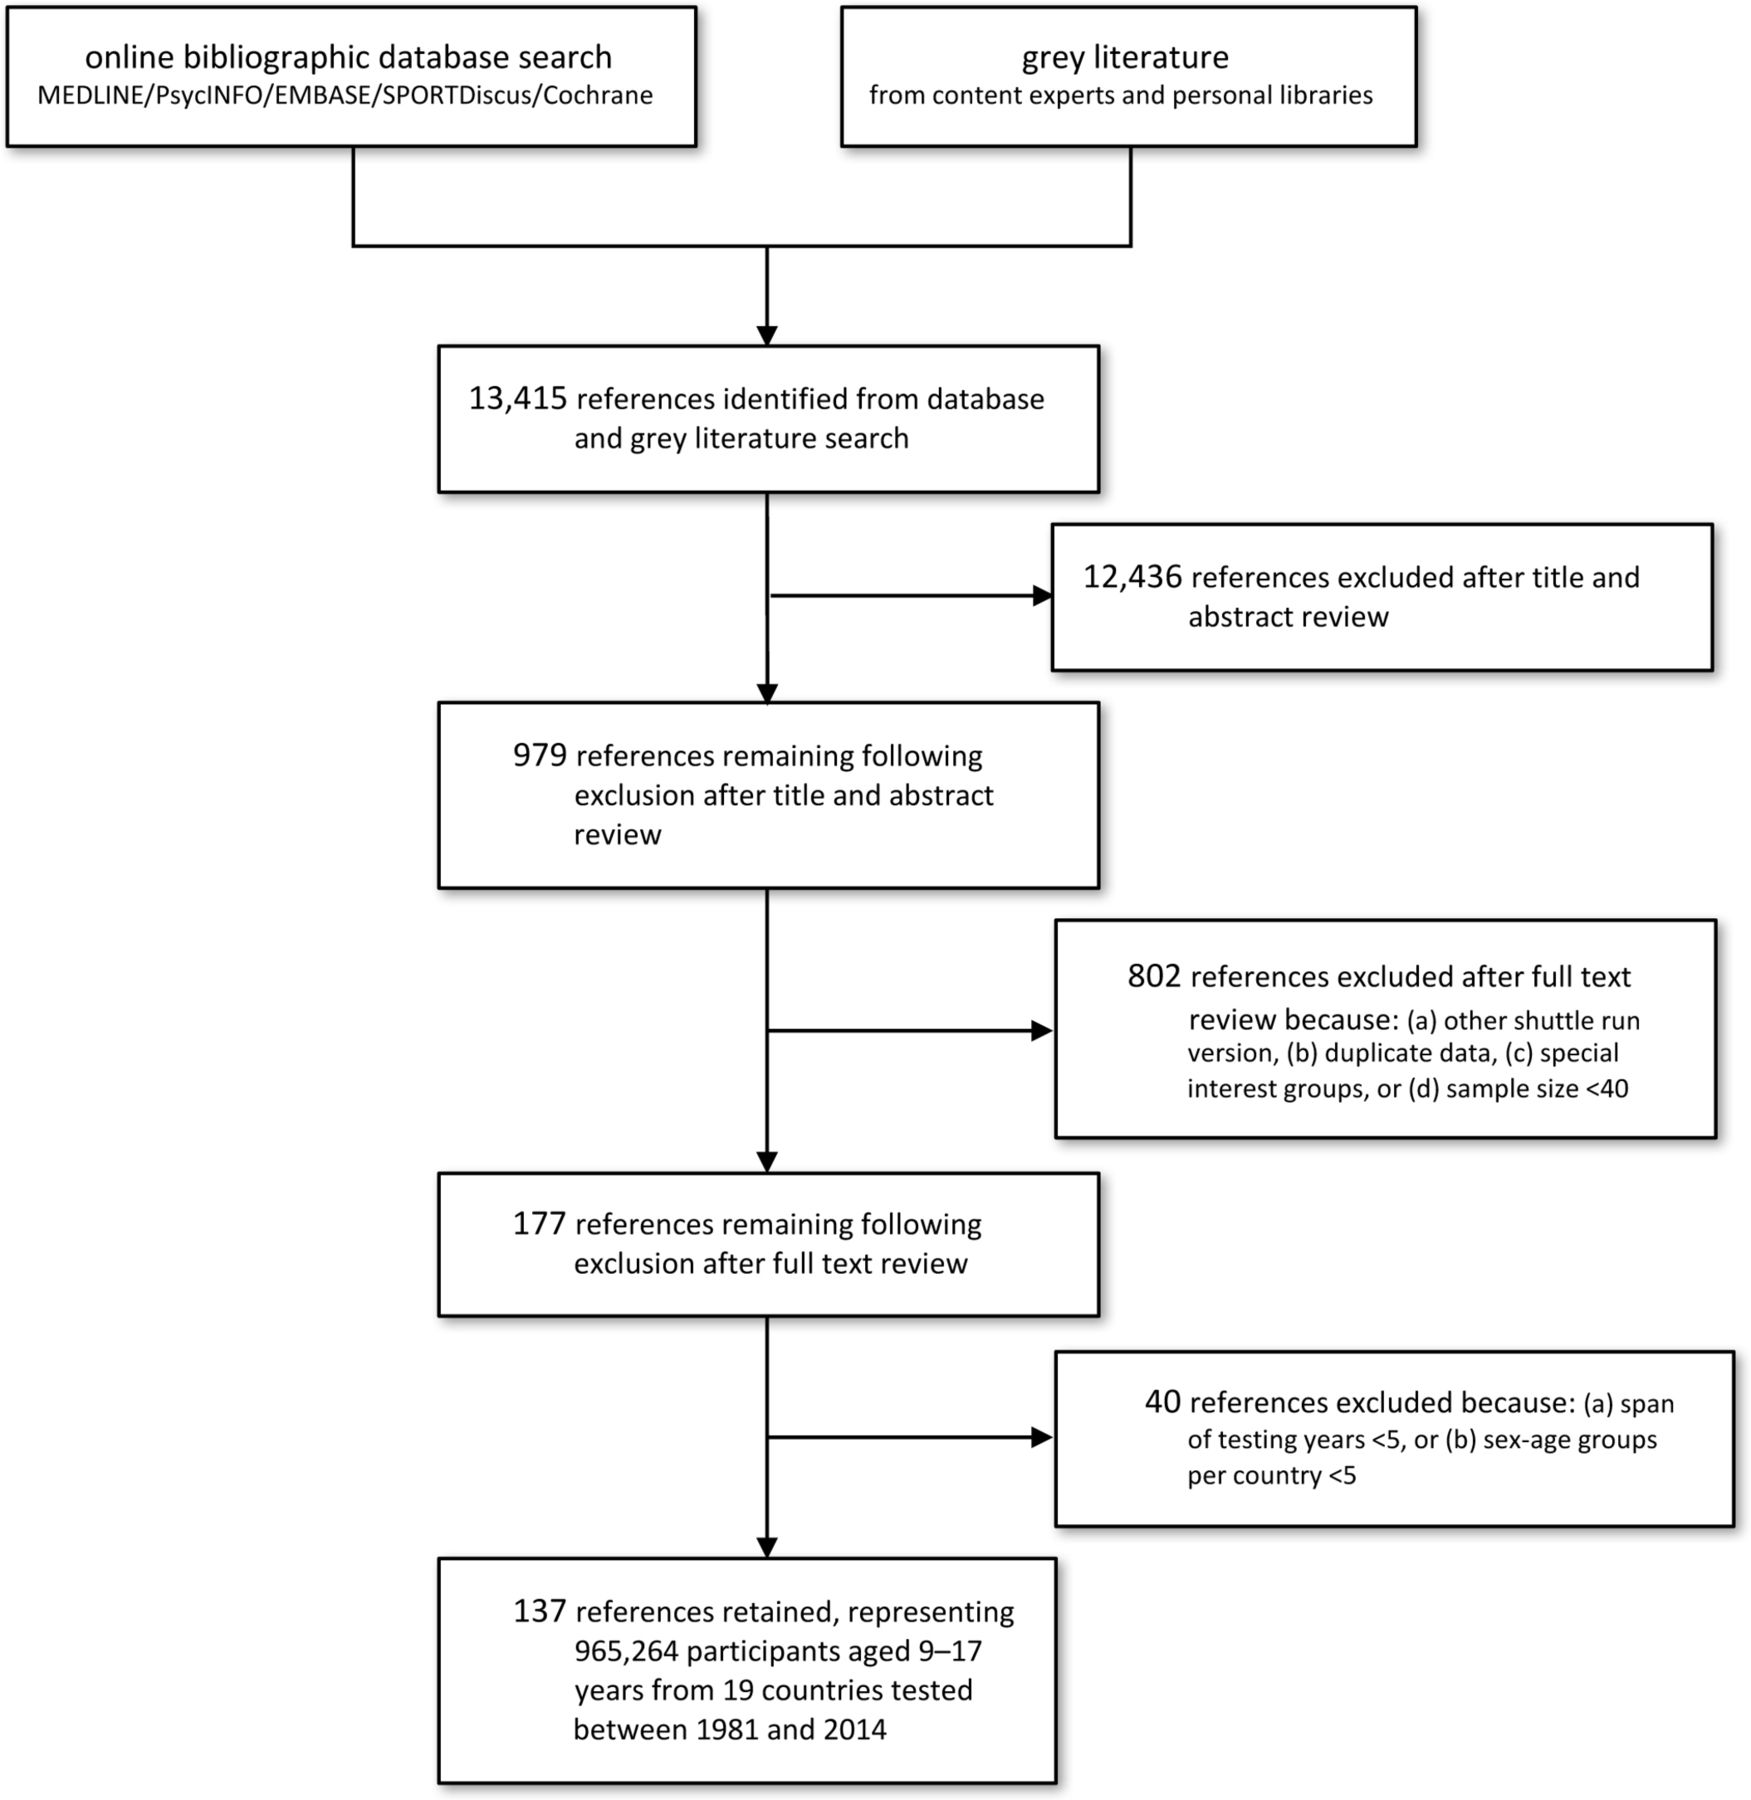
Studies were included if descriptive 20mSRT data were reported on apparently healthy (free from known disease/injury) individuals aged 9–17 years at the country–sex–age–year level from 1981 onwards—the inception year of Léger’s 20mSRT 1 min stage protocol.18 Of the 979 studies identified as relevant, 802 studies were excluded as described in figure 1 (see also Tomkinson and colleagues24 for a detailed description of the inclusion/exclusion criteria). Descriptive data from the remaining 177 studies were extracted by a single author into a spreadsheet using a standardised template, with data checked and corrected by two authors using procedures reported elsewhere.24 Only country–sex–age groups that included data across at least two time points spanning a minimum of 5 years were examined. A minimum of five country–sex–age groups (eg, 9-year-old Australian boys) was required per country for inclusion. These two additional steps resulted in the further exclusion of 40 studies, yielding a final dataset of 137 studies (figure 1; online supplementary file 1).
Supplementary file 1

PRISMA flow chart outlining the flow of studies through the review. PRISMA, Preferred Reporting Items for Systematic Review and Meta-Analysis.
Data treatment and statistical analysis
All 20mSRT data were expressed using a common protocol and result metric (running speed at the last completed stage, km/hour) using a detailed data standardisation procedure reported elsewhere.16 24 The accuracy of this data standardisation procedure is excellent, with differences in means calculated using this standardisation procedure and direct calculation from individual final running speeds, <0.5% at the country–sex–age level.16 CRF was estimated by the widely used Léger18 prediction equation:
 O2peak (mL/kg/min)=31.025 + 3.238 Speed − 3.248 Age +0.1536 Speed • Age
where Speed is the running speed of the last completed stage (km/hour) and Age is age at last birthday. In a sample of Québec children and adolescents, this equation had an SE of estimate of 5.9 mL/kg/min or 12.1%.18
Temporal trends in mean CRF were analysed using an update of the detailed procedure described elsewhere.17 26 Temporal trends at the country–sex–age level were analysed using best-fitting sample-weighted linear or polynomial (quadratic or cubic) regression models relating the year of testing to CRF. Changes in mean CRF were expressed as absolute (mL/kg/min per year) and per cent (% per year) changes. To interpret the magnitude of change, standardised effect sizes (ES) of 0.2, 0.5 and 0.8 were used as thresholds for small, moderate and large, respectively, with ES <0.2 considered to be negligible and ES ≥0.2 considered to be substantial.27 Positive changes indicated increases in mean CRF and negative changes indicated declines.
The temporal trends were described as follows: starting with the first year (Y 1) covered by any study–country–sex–age group, every group including Y 1 in its span of years was located, with every change (dx 1, mL/kg/min or % per year) recorded.17 26 This process was applied to all years for which change data were available (Y 1… Yn ), yielding a series of yearly changes. The poststratified population-weighted mean yearly change was calculated for year (Y 1),28 which was repeated for Y 2, Y 3, Y 4… until the last year covered by any study, Yn . This process yielded a series of population-weighted mean yearly changes (dx 1, …, dxn ) that collectively described the temporal pattern of change, a process that was performed for all children and for different sex, age and country groups. Population estimates were standardised to the mean measurement year of 2000 using United Nations’ data.29 The poststratification population-weighting procedure helped to correct the trends for systematic bias associated with oversampling and undersampling and to standardise the trends to underlying country–sex–age–specific demographics. Temporal trends were estimated using best-fitting population-weighted linear or polynomial regression models relating the year of testing to the yearly changes and were graphically illustrated using an iterative procedure described by Tomkinson and Olds.17
Relationships between linear temporal trends in CRF and linear temporal trends in broad socioeconomic and health-related indicators across countries were quantified using Pearson’s correlation coefficients, with 95% CIs estimated using Fisher’s z-transformation. National trends for three broad socioeconomic/health-related indicators (percentage overweight/obese,30 percentage physically active,31 and Gini index32; table 1) were analysed using linear regression models (as described above for CRF). To interpret the magnitude of correlation, ES of 0.1, 0.3 and 0.5 were used as thresholds for weak, moderate and strong respectively, with ES <0.1 considered to be negligible and ES ≥0.1 considered to be substantial.27
Potential correlates of temporal trends in CRF in children and adolescents
Results
Temporal trends in CRF were estimated from 965 264 children and adolescents aged 9–17 years from 19 countries (1408 country–sex–age–year groups) between 1981 and 2014 (table 2). These countries represented 17 high-income and 2 upper middle-income countries,33 from 6 of 7 continents, and approximately 15% of the world’s population. National surveys provided 64% of all data points, state/provincial studies 24% and community studies 12% (online supplementary file 1). Trends were calculated for 262 country–sex–age groups (boys: 125; girls: 137; children (aged 9–12 years): 107; adolescents (aged 13–17 years): 155), with a median sample size of 1138 (range: 100–54 567) and a median span of 16 years (range: 5–30).
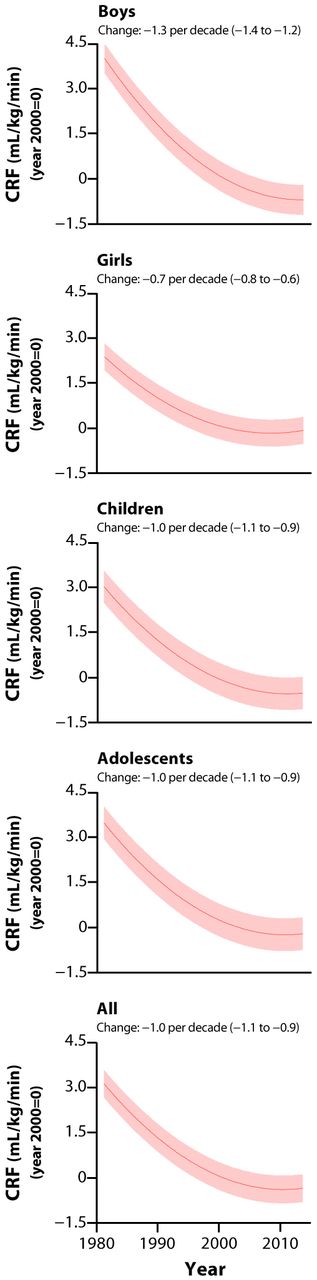
Collectively, there was a moderate decline in mean CRF between 1981 and 2014 (change in means (95% CI): −3.3 mL/kg/min (−3.5 to −3.1) or −7.3% (−7.8 to −6.7)) (figure 2). There was a large collective decline in mean CRF in boys, moderate declines in both children and adolescents and a small decline in girls (figure 2).
Summary of the included studies by country

International temporal trends in mean CRF (mL/kg/min) between 1981 and 2014. Note: data were standardised to the year 2000=0 mL/kg/min, with positive values indicating better CRF and negative values poorer CRF; the solid lines represent the international change in mean CRF, and the shaded areas represent the 95% CIs, with upwards sloping lines indicating increases over time and downwards sloping lines declines; mean (95% CI) absolute changes (per decade) are shown at the top of each panel. CRF, cardiorespiratory fitness.
Internationally, the decline in mean CRF was not uniform over time, with the rate of decline slowing from 1981 to 2000 and stabilising near zero thereafter (figure 2; table 3). The rate of decline in CRF has diminished from −2.2 mL/kg/min per decade (95% CI −2.4 to 2.0; ES: small) in the 1980s, −1.6 mL/kg/min per decade (95% CI −1.7 to 1.5; ES: small) in the 1990s, −0.4 mL/kg/min per decade (95% CI −0.5 to 0.3; ES: negligible) in the 2000s to −0.2 mL/kg/min per decade (95% CI −0.4 to 0.0; ES: negligible) in the 2010s. This trend was consistent across different sex and age groups (figure 2; table 3).
Most countries experienced declines in CRF (17/19 or 89%), ranging from large declines in Australia, Canada, France, Hungary, Lithuania, Poland and Seychelles to negligible declines in Belgium, Estonia and Greece (table 3). The increases in Brazil and Japan were small. While most country trends were approximately uniform (linear), figure 3 indicates non-uniform (curvilinear) changes evidenced by a slowing or stabilising of the rate of decline near to the year 2000 for several countries (Australia, Canada, Greece, South Africa and Spain), a shift from declines to increases in Belgium and a shift from increases to declines in the UK. Between-country trends were very strongly related between boys and girls (r=0.96 (95% CI 0.89 to 0.99)) and between children and adolescents (r=0.86 (95% CI 0.66 to 0.95)).
National and international temporal trends in mean CRF (per decade) from 965 264 children aged 9–17 years from 19 countries between 1981 and 2014

National temporal trends in mean CRF (mL/kg/min) between 1981 and 2014. Note: data were standardised to the year 2000=0 mL/kg/min, with positive values indicating better CRF and negative values poorer CRF; the solid lines represent the national changes in mean CRF, and the shaded areas represent the 95% CIs, with upwards sloping lines indicating increases over time and downwards sloping lines indicating declines; mean (95% CI) absolute changes (per decade) are shown at the top of each panel. CRF, cardiorespiratory fitness.
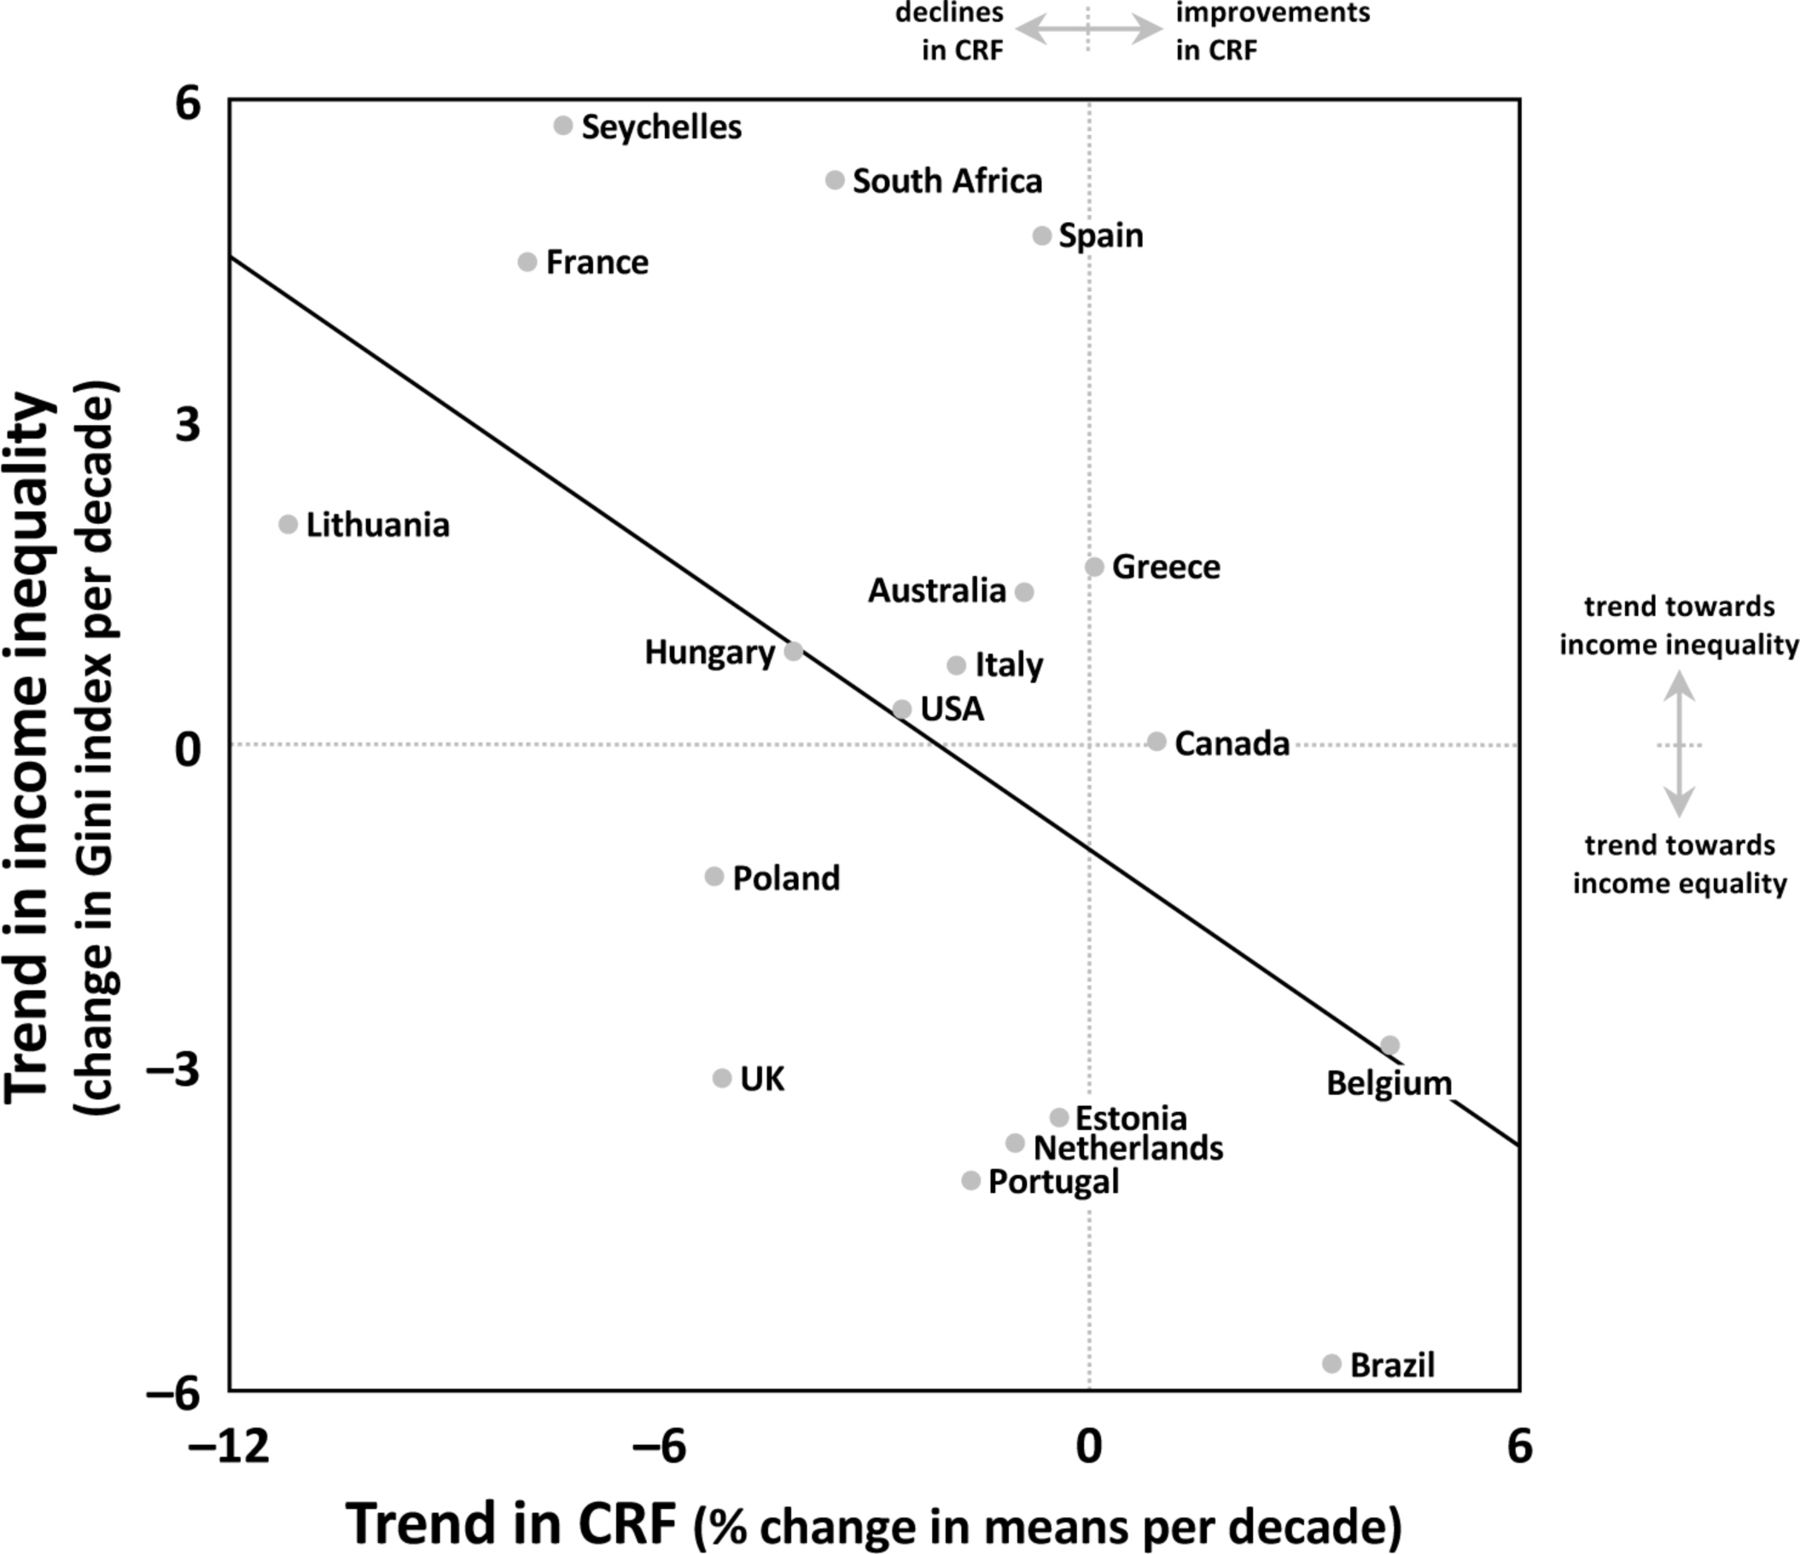
There was a strong negative association between trends in income inequality (Gini index) and trends in CRF, indicating that countries approaching income equality (ie, a reduction in the population spread of income) over the period 2000–2014 had more favourable trends in CRF (ie, improvements or small declines) (figure 4; table 4). Other correlations were negligible to moderate in magnitude and some (eg, percentage overweight/obese) were not always in the expected direction.

The relationship between linear temporal trends in CRF (% change) and linear temporal trends in income inequality (Gini index) between 2000 and 2014. Note: positive changes in CRF indicate increases in mean CRF and negative changes indicate declines in mean CRF. Positive changes in Gini index indicate trends towards perfect inequality and negative changes indicate trends towards perfect equality. The solid diagonal line represents the regression line. CRF, cardiorespiratory fitness.
Pearson’s correlation coefficients (95% CI) between linear temporal trends in CRF and linear temporal trends in socioeconomic and health-related indicators
Discussion
This analysis indicates that since 1981: (1) there has been a substantial international decline in CRF, which has slowed and stabilised with negligible change since 2000; (2) despite most countries experiencing a decline in CRF, both the rate and pattern of change differed between countries; (3) the decline in CRF has been larger for boys than for girls; and (4) countries approaching income equality demonstrated more favourable trends in CRF. As low CRF in late adolescence and adulthood is significantly associated with all-cause mortality later in life,11 12 these temporal declines in CRF are therefore suggestive of meaningful declines in population health. This highlights a cause for concern.
Slowing international decline in CRF
While the declines in CRF observed in the 1980s and 1990s are consistent with those reported in other reviews of temporal trends in CRF,16 17 this study provides evidence that the international decline in CRF has diminished and stabilised with negligible change since 2000, challenging the popular belief that CRF is still declining in children and adolescents. Temporal trends in field-based CRF are probably caused by trends in a network of environmental, social, behavioural, physical, psychosocial and physiological factors.13 17 26 Causes of a temporal decline in CRF are a function of changes in  O2peak, mechanical efficiency and fractional utilisation of oxygen, with psychosocial issues (eg, motivation) also important.34–36 Unfortunately, there are no compelling trend data for these factors. Physiological changes are affected by physical changes, such as increased fatness. There are compelling reasons why increases in fatness will influence declines in field-based CRF (or a stabilisation in fatness will lead to a stabilisation in CRF). First, based on studies using external loading, increased fatness will increase the oxygen cost of running, and therefore reduce running performance for any given absolute aerobic power.37 Second, cross-sectionally, running performance declines with increasing fatness.38 39 Third, in many countries, changes in fatness have coincided with changes in CRF.26 40 There is overwhelming evidence of an international increase in children’s fatness over the past 50 years,41 42 which appears to have stabilised since the mid-to-late 1990s in some high-income countries.43 This increase and recent stabilisation in fatness appears to have coincided with the deceleration and recent stabilisation in CRF trends. Fourth, direct analysis of the causal fitness–fatness connection indicates that increases in fatness explain 35%–70% of the declines in CRF.38 44
Other factors, such as a decline in physical activity or an increase in sedentary behaviours, are probably involved.17 Unfortunately, temporal trends in these behaviours are not clear, because of the difficulty in obtaining accurate measurements and temporal differences in sampling and methodology.45 Recent reviews of temporal trends in self-report and objective measures of physical activity in children suggested that physical activity levels and sport participation have not changed in recent decades.45 46 Given that physical fitness assesses an individual’s physiological response to their total physical activity profile, temporal trends in CRF could therefore suggest that physical activity levels have declined in the 1980s and 1990s and stabilised thereafter, at least predominantly in high-income and upper-middle-income countries.
Furthermore, it is not clear whether the observed decline in mean CRF has been uniform or skewed across the distribution. Several studies have reported that temporal trends are skewed in the distribution of CRF, with declines in distance running performance larger in children with low CRF than in children with average or high CRF.40 47 However, temporal trends in skewness are probably an artefact of expressing CRF in running time and are possibly attenuated when expressed in mL/kg/min, which is typically normally distributed and more appropriate for parametric statistical analysis.
Temporal differences in CRF between countries
Our analysis was largely representative of high-income and upper-middle-income countries that are well along the physical activity and epidemiological transition,48 which may help explain why CRF has recently stabilised. The plateau in CRF may be associated with an increased consciousness (eg, increased media attention, increased health-related research, social marketing campaigns and policy interventions) of the issues around poor CRF. There have been initiatives at the home, school, community and government levels,49 and some country-specific evidence showing concurrent improvements in physical activity and CRF.50 This study examined trends in three possible broad country-specific correlates of trends in CRF in children and adolescents—the distribution of income within a country and country-specific childhood physical activity and overweight/obesity levels.
The Gini index is a population measure of the distribution of income. We observed a strong negative association between trends in income inequality and trends in CRF in children and adolescents across 18 countries; meaning, countries with a widening gap between rich and poor residents had less favourable trends (ie, large declines) in CRF (eg, France, Lithuania and Seychelles). A widening gap between rich and poor residents suggests a trend towards larger subpopulations of poor individuals. Poverty is linked to poor social and health outcomes—one of which is lower CRF levels—including lower physical activity levels, increased obesity levels, lower life expectancy, higher infant mortality, increased risk of cardiovascular and other diseases, impairment of children’s growth, mental illness, drug use and social disintegration.51 52 This finding suggests that policies aimed at reducing the gap between rich and poor might be a suitable population approach to slowing the decline (or stabilising negative trends) in CRF, assuming the observed ecological correlation is causal. Cross-sectionally, country-specific income inequality was a strong negative correlate of CRF across 50 countries22 and a moderate negative correlate of overall physical activity behaviours across 38 countries.53 Our results also support previous research that identified income inequality as the strongest structural determinant of health in adolescents.54
Because physical activity is considered a modifier of CRF, it was expected that trends in population levels of physical activity would be positively related to trends in CRF in children and adolescents.55 Trend analysis of validated self-report survey data from the Health Behaviour in School-aged Children (HBSC) WHO collaborative cross-national study31 suggested a weak positive association between trends in physical activity and trends in CRF in children and adolescents. In other words, countries where the percentage of sufficiently active children increased over the period 2002–2014 tended to have more favourable trends in CRF (eg, Belgium, Estonia and Spain). It was also expected that trends in population levels of overweight/obesity would be negatively associated with trends in CRF in children and adolescents. However, contrary to expectation, there was a moderate positive association between trends in overweight/obesity and trends in CRF prior to 2000, suggesting that countries where the percentage of overweight/obesity increased tended to have more favourable trends in CRF (eg, Brazil, Japan and USA). Post-2000, there was a negligible association between trends in overweight/obesity and trends in CRF. These results may reflect limitations of the HBSC-WHO and the Global Burden of Disease studies that used self-report measures and a mix of self-report and direct measures, respectively, or that trends in overweight/obesity, physical activity and CRF were generated using different data sets of children and adolescents. Alternatively, it may reflect that trends in overweight/obesity and physical activity levels are, in fact, negligible to moderate correlates of trends in CRF.
Because our analysis is representative of only high-income and upper middle-income countries, it is also possible that our correlation estimates were affected by between-country homogeneity, which would theoretically act to reduce the magnitude of the correlations. This also limits our understanding of the true international trend in CRF and the generalisability of our results to low-income and middle-income countries, making it difficult to confidently provide lessons learnt to low-income and middle-income countries that might be in the midst of a physical activity transition. This highlights the need for low-income and middle-income countries to collect CRF data to track trends in population fitness levels in order to help inform policies to prevent declines like those seen in high-income countries in the 1980s and 1990s. Evidence from one low-income country at least indicated that CRF56 has declined substantially over the past two decades. Lang et al recently suggested establishing an international 20mSRT data repository to help monitor CRF.22 This type of data repository would be excellent for tracking trends in CRF in low-income and middle-income countries with minimal finances to support other surveillance efforts.
Temporal differences in CRF between sexes
It is not clear why declines in CRF were larger for boys than for girls across the full sample. Olds41 indicated that increases in percentage body fat were larger for boys (1.0% per decade) than for girls (0.7% per decade) in 30 high-income countries between 1952 and 2003. Cross-sectionally, the negative relationship between fatness (sum of skinfolds) and CRF (20mSRT performance) is stronger for boys than for girls,39 suggesting that any given increase in fatness will result in a greater decline in boys’ CRF. The temporal difference in CRF between sexes may also be a result of a temporal difference in physical activity participation between sexes, which is apparent in elite sport. For example, the 2012 Olympic Games marked the first time a female athlete was part of every competing country’s delegation, with females comprising 44% of all athletes, increasing from 23% in 1984 and 11% in 1960.57 Although this highlights the diminishing gender gap in elite sport, it may reflect that sport participation for girls of all ages has increased internationally. Perhaps the recent promotion of gender equality policies and programmes58 has helped narrow the gender gap in CRF through sport participation and other physical activity areas. Sex-related differences in motivation levels may also be involved.
It is also possible that the sex-related temporal differences in CRF were the result of our use of the Léger18 prediction equation. To examine this, we recalculated trends in CRF using 20mSRT performances (ie, speed (km/hour) at the last completed stage) and estimated  O2peak values from four additional prediction equations59–61 for individuals aged 12–14 years (the common ages across which all equations were validated) from a single country (Japan, because descriptive data were available for all predictor variables across all time points (annually from 1998 to 2014)). There were similar time-related changes (indicating improvements of similar magnitude in Japanese children as shown in figure 3) and similar (negligible) sex-related differences in trends when calculated using speed values (0.4% per decade), estimated
  O2peak values from the Léger equation (0.3% per decade) and estimated
  O2peak values from the four additional equations (range: 0.1%–0.3% per decade). It is therefore unlikely that our trends are an artefact of expressing CRF as
  O2peak estimated by the Léger equation.
Strengths and limitations
Using a systematic search and analytical strategy, this study reviewed data from 137 studies on 965 264 children and adolescents from 19 countries to estimate international and national temporal trends in CRF. Although not the first study examining international trends in CRF, it does update previous comprehensive studies16 17 by: (1) extending the end of the temporal picture from 2003 to 2014, providing the current best available estimate of temporal trends in CRF; (2) reporting absolute, per cent and standardised trends for a single validated measure; (3) reporting trends in  O2peak, which reflect underlying trends in the energetic cost of exercise; (4) describing trends using weighted regression and a poststratification population weighting procedure; and (5) reporting the temporal trend associations between CRF and broad socioeconomic/health-related indicators. Furthermore, a sensitivity analysis showed that the removal of countries with very large sample sizes (Greece, Japan and USA) had a negligible effect (ES <0.2) on the collective trends in CRF, providing further support that our calculations were not biased by the inclusion of these countries.
There are however several limitations. First, the reported trends are representative of high-income and upper middle-income countries, and it is not known whether similar trends exist for low-income countries that may be experiencing a physical activity transition.48 Second, this study pooled data from studies that used different sampling methods (probability and non-probability sampling) and sampling frames (national, state/provincial, and community levels), which raises the issue of representativeness. However, because trends in population-representative samples could not always be estimated, trend estimates across state/provincial and community samples of children were included because they were considered to provide meaningful insight into country-specific trends. Third, differences in testing conditions (eg, climate, altitude, practice and running surfaces) and measurement errors (eg, methodological drift and diurnal variation) might have occurred, although the large number of included data points should have minimised these methodological issues. Future studies should follow the recommendations of Tomkinson et al
24 to improve consistency in the reporting of 20mSRT results across studies to assist future data pooling and the update of international and national temporal trends. Fourth, international and national temporal trends were estimated from available country–sex–age–specific trend data, and therefore may not be representative of all country–sex–age groups or all measurement years. Fifth, while  O2peak was estimated using a prediction equation validated on individuals aged 8–19 years,18 it is not clear whether it was validated across a range of CRF values similar to those estimated from the studies included in this review. Sixth, temporal trends in CRF will be affected by concurrent trends in biological maturation,62 which generally favour children of the same chronological age in more recent years and may underestimate the true temporal declines.16
Conclusion
This study indicates that there has been a substantial decline in CRF in high-income and upper middle-income countries since 1981, which has slowed and stabilised internationally since 2000. While declines in CRF have typically been observed at the national level, variability exists in both the rate and the pattern of change across countries, with countries approaching income equality demonstrating more favourable trends in CRF. Larger declines in CRF were observed for boys than for girls, and while it is not entirely clear why, sex-related temporal differences in physical activity participation may be involved. This study highlights a gap in CRF trend data for low-income and middle-income countries, underscoring the need to improve the international monitoring of CRF across populations because temporal declines are indicative of declines in population health. To most accurately track trends in child and adolescent health, it is recommended that large-scale, harmonised national health and fitness surveys be regularly conducted, especially among low-income and middle-income countries.
What are the findings?
This study estimated that there has been a moderate international decline in cardiorespiratory fitness (CRF) between 1981 and 2000, which has slowed and stabilised with negligible change since 2000.
This study estimated that the decline in CRF was generally larger for boys than for girls and similar for children and adolescents. Trends in CRF also differed in magnitude and direction between countries, with most showing declines.
This study indicated that countries approaching income equality (ie, a reduction in the population spread of income) have experienced more favourable trends in CRF (ie, improvements or small declines).
How might it impact on clinical practice in the future?
Temporal trends in the CRF of children and adolescents should provide meaningful insight into trends in population health, highlighting the need to improve the national, regional and international surveillance of CRF.
Acknowledgments
We would like to thank the authors of the included studies for generously clarifying details of their studies and/or for providing raw and/or additional data.
References
Footnotes
Contributors All authors developed the research question and designed the study. GRT and JJL had full access to all the data in the study and take responsibility for the integrity of the data. GRT led the statistical analysis, synthesis of results and writing of the report. All authors contributed to the interpretation of results, editing and critical reviewing of the final report and approved the final report.
Competing interests None declared.
Provenance and peer review Not commissioned; externally peer reviewed.
Correction notice This article has been corrected since it published Online First. Reference 11 has been corrected.