Article Text

Abstract
Purpose To characterise hydration, cooling, body mass loss, and core (Tcore) and skin (Tsk) temperatures during World Athletics Championships in hot-humid conditions.
Methods Marathon and race-walk (20 km and 50 km) athletes (n=83, 36 women) completed a pre-race questionnaire. Pre-race and post-race body weight (n=74), Tcore (n=56) and Tsk (n=49; thermography) were measured.
Results Most athletes (93%) had a pre-planned drinking strategy (electrolytes (83%), carbohydrates (81%)) while ice slurry was less common (11%; p<0.001). More men than women relied on electrolytes and carbohydrates (91%–93% vs 67%–72%, p≤0.029). Drinking strategies were based on personal experience (91%) rather than external sources (p<0.001). Most athletes (80%) planned pre-cooling (ice vests (53%), cold towels (45%), neck collars (21%) and ice slurry (21%)) and/or mid-cooling (93%; head/face dousing (65%) and cold water ingestion (52%)). Menthol usage was negligible (1%–2%). Pre-race Tcore was lower in athletes using ice vests (37.5°C±0.4°C vs 37.8°C±0.3°C, p=0.024). Tcore (pre-race 37.7°C±0.3°C, post-race 39.6°C±0.6°C) was independent of event, ranking or performance (p≥0.225). Pre-race Tsk was correlated with faster race completion (r=0.32, p=0.046) and was higher in non-finishers (did not finish (DNF); 33.8°C±0.9°C vs 32.6°C±1.4°C, p=0.017). Body mass loss was higher in men than women (−2.8±1.5% vs −1.3±1.6%, p<0.001), although not associated with performance.
Conclusion Most athletes’ hydration strategies were pre-planned based on personal experience. Ice vests were the most adopted pre-cooling strategy and the only one minimising Tcore, suggesting that event organisers should be cognisant of logistics (ie, freezers). Dehydration was moderate and unrelated to performance. Pre-race Tsk was related to performance and DNF, suggesting that Tsk modulation should be incorporated into pre-race strategies.
- thermoregulation
Data availability statement
Data are available upon reasonable request.
This is an open access article distributed in accordance with the Creative Commons Attribution Non Commercial (CC BY-NC 4.0) license, which permits others to distribute, remix, adapt, build upon this work non-commercially, and license their derivative works on different terms, provided the original work is properly cited, appropriate credit is given, any changes made indicated, and the use is non-commercial. See: http://creativecommons.org/licenses/by-nc/4.0/.
Statistics from Altmetric.com
Introduction
The Tokyo 2020 Olympics are expected to be the hottest in history, hence unprecedented countermeasures including the relocation of the athletic road races from Tokyo to Sapporo.1 Despite consensus statements2 and guidelines3 on how athletes should prepare, relatively little is known about the actual strategies elite athletes adopt to cope with the heat4; particularly during major competitions (eg, Olympic Games, World Championships).
An area of contention is hydration. Although 2% dehydration exacerbates heat strain and impairs performance,5 6 leading to the recommendation of minimising body mass losses <2%,7 others suggested that performance may not be altered under real-world conditions until ≥4% of body mass loss.8 9 Pre-cooling is also well discussed. Despite meta-analyses showing that pre-cooling may benefit endurance performance in the heat,10 11 its benefits may be overvalued in laboratory studies (predominately reliant on university students and recreational athletes) compared with outdoor scenarios with appropriate air flow and elite endurance athletes.12 Only half of the athletes planned pre-cooling at the 2015 World Athletics Championships in Beijing.13
The project aimed to survey hydration and cooling strategies, and for the first time characterise the associated body mass loss and core (Tcore) and skin (Tsk) temperatures during the 2019 World Athletics Championships held in hot-humid ambient conditions.
Methods
Participants
Eighty-three athletes (36 women, table 1) completed a pre-race questionnaire; 74, 56 and 49 athletes were also measured for body weight, Tcore and Tsk, respectively.
Participant characteristics and environmental conditions per race
Environmental conditions
Courses were on flat loops. Environmental conditions (table 1) were measured every 30 min using a heat stress monitor (Kestrel 4400, Boothwyn, Pennsylvania, USA) on a tripod ~1.5 m above the floor, ~4 m from the course.
Measures
Questionnaire
Participants completed a pre-competition questionnaire (available in 12 different languages, online supplemental appendix 1) in the days preceding their event. The questionnaire included: (1) demographic data; (2) drinking strategy, quantity, content and knowledge source; (3) pre-cooling strategy and (4) mid-cooling strategy.
Supplemental material
Body mass
A calibrated scale (Seca 769, Hamburg, Germany) was placed before the start (entrance of the call room; pre-race) and upon finishing (before the mixed zone; post-race). Body mass loss was expressed as a percentage of pre-race body mass (both measured from towel-dried athletes wearing their race ensemble).
Skin temperature
High-resolution thermal images (FLIRT600, 480×360 pixel infrared resolution, thermal sensitivity <40 mK; FLIR Systems, Oregon USA) were taken before and after competition from a 4 m distance and processed using commercially available software (Flirt Tools+, FLIR systems, Oregon, USA). Regions of interest (ROIs; head, neck, trunk, shoulder, upper and lower arm, upper and lower leg) were identified posteriorly and anteriorly (both sides when applicable). The camera and software analysis were set for human skin emissivity (ε=0.98) to analyse the temperature of each ROI, with corrections for distance and reflected temperature of the environment applied, as well as a check for camera accuracy (using two 20×20 cm reference plates—mat black and crumpled aluminium foil connected to a thermistor). Skin was towel dried before measurement. The average of the 26 ROIs was computed and included in the analysis as mean Tsk.14
Core temperature
Tcore (precision 0.1°C, 1 recording every 30 s) was recorded using e-Celsius ingestible capsules (BodyCap, Caen, France) along with instructions to ingest 4–6 hours pre-race.
Performance
Ranking and finishing times were extracted from the official race results. Times were normalised to the personal best of the athletes (%PB, obtained from World Athletics’ official database).
Statistical analyses
Data were analysed in Wizard (V.1.9.41, Evan Miller). Categorical variables were compared using Χ2 tests (eg, effect of event on planning to use electrolytes). The effect of a category on a continuous variable was analysed through a two-tailed t-test (eg, effect of sex on body weight loss). A Spearman’s rank correlation (ρ) was used to analyse the relationship between multiple level category on continuous data (eg, effect of hydration strategy on body weight loss). Answers to different questions were compared as repeated measures using a McNemar test (eg, pre-cooling vs mid-cooling strategy). Sidak adjustments for multiple comparisons were applied for post-hoc analyses. A p value of <0.05 was used for statistical significance.
Results and discussion
Drinking strategy
Debate regarding drinking to thirst versus a pre-planned hydration strategy is ongoing.15 16 The present data indicate that regardless of the event (p≥0.108), personal experience (91%) is the major determinant for athletes’ hydration strategy rather than a coach (38%), nutritionist (28%), scientist (27%), further reading (20%) or expected fluid availability (9%) (all p<0.001 compared with experience). The present data did not differentiate whether personal experience meant ‘having spent years developing a hydration plan’ (potentially guided by science) or familiarity/confidence in ‘relying on thirst’. Thus, any strategy/intervention requires piloting away from competition before adoption within a race. Coach recommendations were more influential than personal reading (p=0.011), suggesting that practitioners should communicate evidence-informed practice through the coach. Athletes relying on a ‘scientist’ achieved higher ranking than those who did not (15±12 vs 24±13, p=0.013). This may however be a function of the top-ranked athletes having superior access to sport science support as the relative individual performance was not different (112±4 vs 114%±7%PB, p=0.310). No effect of planned hydration volume, nor using electrolytes or carbohydrates, was evident on %PB (all p>0.100).
Given the large variability in sweat rates (interindividual differences, acclimatisation, clothing, environmental conditions, etc.),4 17 most consensus statements recommend minimising fluid deficit, but do not mention specific fluid amounts.2 18 The current data provide insight into these amounts and how they depended on event (figure 1, p=0.033). Athletes intending to drink >2 L were most frequent in the 50 km race-walk (50KRW) compared with other events (82% vs 41%, p<0.001), likely due to the longer 50KRW duration (4 hours 30 min 01 s±17 min 42 s) compared with the 20 km race-walk (20KRW) (1 hour 36 min 49 s±5 min 22 s) and marathon (2 hours 32 min 27 s±18 min 47 s). However, despite the marathon lasting longer than the 20KRW, the absence of difference in hydration strategy (p=0.678) suggests that marathoners plan to drink less than their 20KRW counterparts, with an estimation of 0.7±0.3 L.h−1 for marathon vs 1.1±0.4 L.h−1 for 20KRW (p<0.001). While this may partly be due to fluid access (20KRW: 2 stations per 1 km loop; marathon: 4 stations per 7 km loop), fluid availability was high during all races, and the difference is likely more related to the physiological/practical challenge to absorb/consume fluids while running at ~20 km.h−1. Indeed, a previous study estimated fluid intake of elite marathoners to be 0.55±0.34 L.h−1 in a range of environmental temperatures between 0°C and 30°C.9

Drinking strategy during the World Athletics Championships. Left panel: percentage of athletes declaring to include the described drink in their strategy. Right panel: drink quantity planned by race (in % of athletes). *P<0.05. 20KRW, 20 km race-walk; 50KRW, 50 km race-walk.
Hydration and nutrition recommendations prescribe sodium and carbohydrate ingestion, alongside/with appropriate fluid intake during prolonged endurance exercise in the heat.2 18 19 The present data suggest these recommendations are well translated into practice (independent of event p≥0.288), with 83%, 81% and 85% of the road race athletes planning to use electrolytes, carbohydrates and water during their race, respectively (figure 1). In comparison, 59% and 31% of the long distance athletes (5000 m and above) reported drinking electrolytes and carbohydrates during the 2015 World Athletics Championships,13 and 72% and 69% of the road race cyclists planned electrolytes and carbohydrates during the 2016 World Cycling Championships,20 respectively. This suggests that consumption of electrolytes and carbohydrates during competition has become highly prevalent in elite endurance athletes. Conversely, ice-slurry ingestion during the race remained modest within the present data (11% overall, no marathon runners) and at the 2016 World Cycling Championships road races (10%).20 This is perhaps a reflection of the lack of external validity regarding some ice slurry research, as well as its limited performance benefit in some studies,21 with a potential decrease in sweat rate.22 There are also logistical/practical challenges as ice slurry machines can be difficult to transport, and ice slurry ingestion may induce gastrointestinal discomfort in some athletes.
Pre-cooling strategy
Several reviews (with and without meta-analyses) have suggested pre-cooling as an ergogenic strategy for endurance exercise performance in hot ambient conditions.10 11 23 Fifty-six per cent of the long distance athletes (5000 m and above) planned pre-cooling before the 2015 World Athletics Championships,13 and 72% of the cyclists planned pre-cooling before the 2016 World Cycling Championships road races.20 The current data show that 80% of the athletes planned to use pre-cooling in 2019 (although less common than mid-cooling, p=0.004, figure 2). While pre-cooling effects may be overvalued in laboratory studies,12 particularly when externally valid air flow is not incorporated within the experimental design,2 99% of athletes planning pre-cooling were also planning mid-cooling, likely prolonging its benefits.

Pre-cooling and mid-cooling strategy during the World Athletics Championships. Upper panel: percentage of athletes declaring to plan a pre/mid-cooling strategy. Lower panel: details of the strategy declared (in per cent of athletes). Right panel: example of water dousing plus neck collar, and ice in cap with neck flap. Getty images for World Athletics.
In 2015, before the World Athletics Championships long distance events, the most common pre-cooling methods were ice slurry (26%), ice vests (17%) and cold towels (12%).13 The current data showed that in 2019, the most common pre-cooling methods were ice vests (53%) and cold towels (45%), followed by neck collars (21%) and ice slurry (21%) (figure 2). It appears that athletics followed the trend already observed in cycling20 in adopting ice vests as a common pre-cooling strategy. Pre-cooling strategies were independent of event (p≥0.218), except for ice vests (p=0.012) with a higher prevalence in race-walk (65%) than marathon (31%, p≤0.028). We also observed a slight reduction in leg cold water immersion which was planned by 11% of the athletes in 2015, 9% of the cyclists in 2016 and 6% of the athletes in the current study. Given the potential detrimental effect of leg cooling on muscle function,8 20 the increase in ice vest and decrease in leg cooling usage is in line with current recommendations.1 20
The ranking of athletes planning to use ice vests (18±4) and cold towels (17±12) was better than those who did not (26±14 and 25±14, respectively, p≤0.027), while athletes planning leg cooling were lower ranked than others (43±7 vs 20±13, p=0.001). This may be due to the best athletes having superior access to sports science expertise/support,20 as the pre-cooling strategy did not influence the relative performance of the athletes (%PB, all p≥0.236). While there was no clear effect of any specific pre-cooling method compared with others (acknowledging that most athletes used at least one method), performance was related to pre-race Tsk (as subsequently discussed). Perceptual methods such as menthol mouth rinse and applications were nominal (figure 2).
Mid-cooling strategy
Most athletes (93%, independent of event p=0.244) planned to use mid-cooling, predominately head/face water dousing (65%) and cold water ingestion (52%). Other strategies including menthol-based interventions (2%) were less frequently reported (figure 2), likely due to the challenges of mouth rinsing during high-intensity running and the possibility to use ‘real’ rather than perceptual cooling. However, position statements proposing menthol as an ergogenic aid for endurance in hot ambient conditions have been published in 2020,18 24 and more commercial products are becoming available, suggesting that this proportion may change in the future. Yet, most of the data used in these position statements are obtained from moderately trained athletes, in laboratory settings.25 Whether these perceptual ergogenic effects26 27 translate into performance improvements in elite athletes is not widely accepted. Lastly, several athletes replied to an open question that they were also planning to use cold towels and/or various methods to apply ice on the hands, head, face and neck (eg, neck ice socks, caps and bespoke legionnaire hats, figure 2). Recent data report some race-walkers may use a misting shower,28 but this was not available during the 2019 World Championships.
Pre-race temperatures
Pre-race Tsk and Tcore were 32.7°C±1.5°C and 37.7°C±0.3°C, respectively (independent of event, p≥0.346), representing the first reference for an outdoor World Championships. For comparison, a ~31.5°C Tsk was previously observed using a similar thermography protocol post warm-up in elite Olympic amateur boxing athletes,14 and a 37.7°C±0.3°C Tcore was observed before a half marathon in amateur athletes.29 However, Tcore was also reported to increase from 37.3°C to 38.2°C during warm-up in elite rugby sevens athletes,30 suggesting that the current athletes attempted to minimise their Tcore increase during warm-up as recommended before competing in the heat.31 Indeed, the current athletes using an ice vest had a lower pre-race Tcore than the ones not using one (37.5°C±0.4°C (n=19) vs 37.8°C±0.3°C (n=22), p=0.024). Pre-race Tcore was not statistically related to performance or did not finish (DNF) rate (p≥0.240). Conversely, pre-race Tsk was correlated (although with small/moderate association) with a faster race (r=0.32, p=0.046, figure 3) and DNF athletes had a higher pre-race Tsk than finishers (33.8°C±0.9°C vs 32.6°C±1.4°C, p=0.014). Cooling Tsk has been suggested to reduce the cardiovascular strain by improving the core to skin temperature gradient.2 Notable within/between participant and ROIs variance was evident (figure 4); and the variety of pre-cooling methods, doses and warm-ups prevents statistically associating pre-cooling with performance (all p≥0.259).

Core and skin temperature in finishers, disqualified and did not finish (DNF). Pre-race skin temperature was correlated to the relative finishing time (in % if personal best, r=0.32, p=0.046). DNF had a higher pre-race skin temperature than finishers (*p=0.017). Square, diamond and triangle represent marathon, 20 km and 50 km race-walks, respectively. Blue and pink symbols represent men and women, respectively. %PB, percentage of personal best.

Example of different pre-cooling strategies and their repercussion on pre-race skin temperature.
Race temperatures
Post-race Tsk (32.9°C±1.6°C) depended on event (p<0.001) and was lower post-marathon (31.8°C±2.2°C) than post-20KRW (33.6°C±0.7°C) and 50KRW (33.4°C±0.5°C) (both p≤0.020). However, the lowest Tsk marathon values were specific to men (30.3°C±0.9°C vs 34.4°C±1.0°C for women, p<0.001) as this race was undertaken in less stressful environmental conditions (table 1). Overall, the post-race Tsk measured in this study should be considered with extreme caution as athletes used various mid-cooling approaches during the race and/or on crossing the finish line. Moreover, Tsk during or after running may be affected by the vasoconstrictor response.32 Peak Tcore (39.6°C±0.6°C, independent of event p=0.499) correlated to the pre-race Tcore (r=0.42, p=0.006) but was not related to performance or ranking (p≥0.225). As shown previously, World Championships medallists do reach extremely high Tcore (41.5°C).33 Final Tcore and Tsk were not statistically related to any mid-cooling strategies, with most athletes using at least one such approach.
Body mass loss
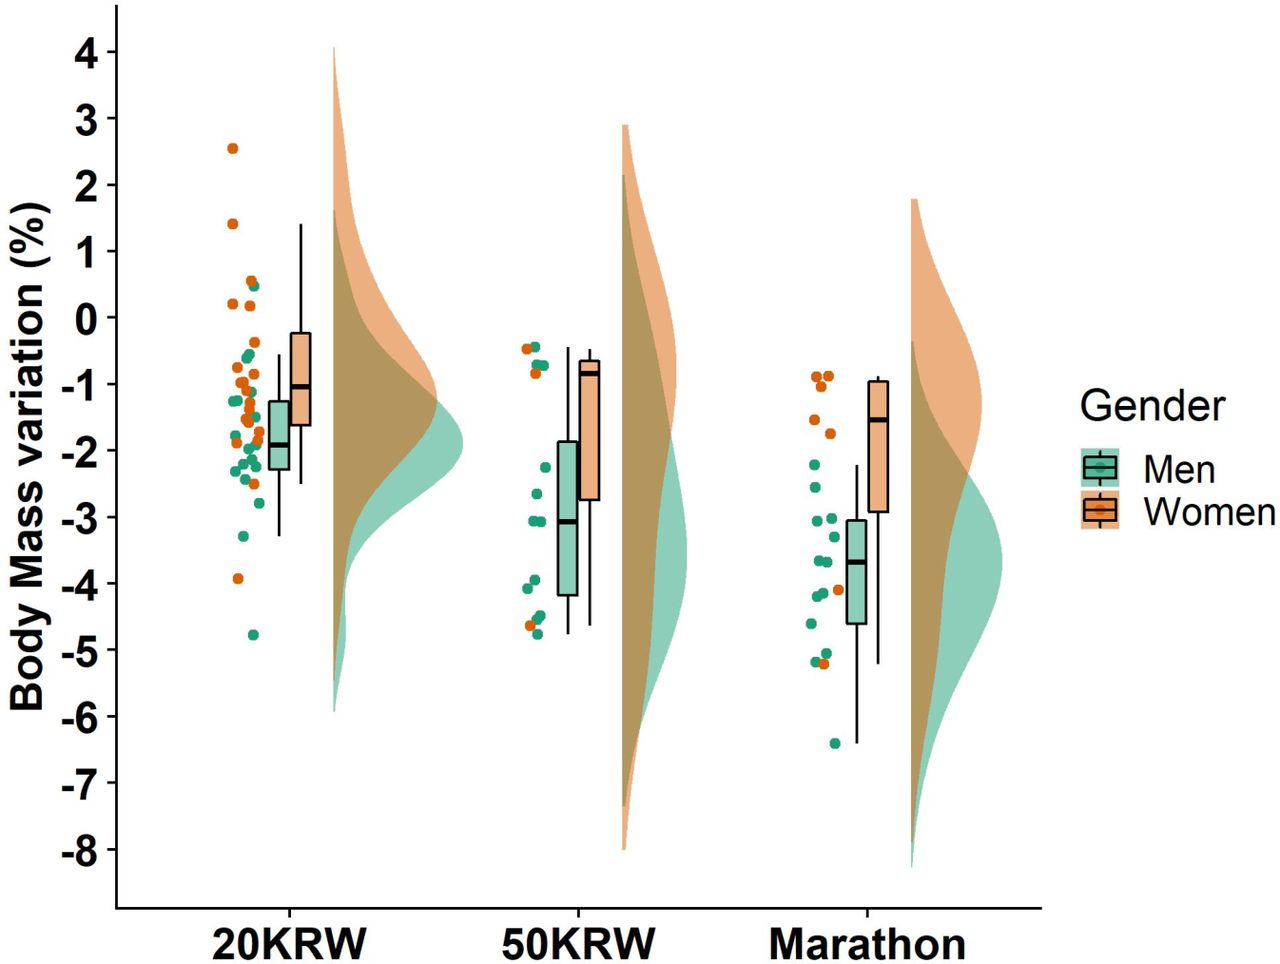
Average body mass loss (2.2%±1.7%) was dependent on event (p<0.001) with the smallest reduction in the 20KRW (−1.4±1.3%) alongside greater reductions in the 50KRW (−2.7±1.7%, p=0.007) and marathon (−3.3±1.6%, p<0.001) (figure 5). The difference between the 20KRW and 50KRW may partly be explained by the event duration, while the largest decrease during the marathon is likely due to the lower drinking strategy (see above). These observations were confirmed at the individual level, where the greatest body mass losses were observed during the marathon (−6.4% marathon vs −4.8% in 20/50KRW, figure 5). These values are lower than the 8.8%±2.2% body mass loss previously estimated for elite marathoners.9 Some surprising individual data were seen in the 20KRW where an athlete gained +2.5% of her body mass during the race due to excessive fluid intake, a strategy not conducive to performance gains and not recommended due to the risks for hyponatraemia.2 The body mass loss may however have been underestimated due to sweat (or water dousing) being trapped in clothing, despite athletes towel drying and wearing minimal clothing (online supplemental appendix 1). Body mass loss has been previously shown to be inversely related to performance during mass participation marathons, with the best runners losing more weight than the slower runners.34 Yet, the current data do not support this relationship in elite runners, as body mass loss was not correlated to ranking (r=−0.17, p=0.198) or relative completion time (r=0.18, p=0.171).
Individual body mass variation from pre-race to post-race. Values in percentage of pre-race body mass. 20KRW, 20 km race-walk; 50KRW, 50 km race-walk.
Effect of sex
The current nutritional recommendations for exercising in the heat are not sex specific, but suggest that men could be at higher risk of dehydration, due to their larger muscle mass and water content.18 The current data partly support this concept by showing higher body mass losses in men than women (−2.8±1.5% vs −1.3±1.6%, p<0.001, figure 5). One could argue that this may be linked to the singular environmental conditions during the marathons (table 1), but this difference persists when analysing the race-walks only (p=0.003). There were also sex differences in hydration strategies. The current data showed that less women than men planned electrolyte (72% vs 91%, p=0.029) and carbohydrate (67% vs 93%, p=0.003) consumption, although these strategies remained popular for both sexes. When pooled data were analysed, although higher in men, dehydration values remained reasonable in both sexes (figure 5). Five of the six athletes ‘overdrinking’ and gaining weight during their event were women.
The prevalence of planning pre-cooling (p=0.731) or mid-cooling (p=0.755), nor cooling intervention-type selection (all p≥0.164), did not depend on sex, aside from ice slurry consumption for pre-cooling purposes, which was more prevalent in women than men (31% vs 13%, p=0.047); an observation already reported during the 2015 World Athletics Championships.13 There was no effect of sex on Tcore or Tsk (p≥0.088, figure 3), confirming that the impact of sex on thermoregulation may be lower than originally believed, especially within athletes with a similar anthropometry.35
Strategic nuances of African athletes
Athletes from 28 countries participated in the study. Although only eight African athletes completed the questionnaires, some responses were specific. For example, two of the seven marathon runners from Africa (ie, 29%) planned no fluid intake, whereas none of the 22 other marathon runners who completed the questionnaire declared so. Although such limited fluid intake is in line with previous observations in elite African runners,9 those two runners ranked in the second half of the finishers. Similarly, less African (40%) compared with European (86%, p=0.033) and North American (91%, p=0.058) athletes planned to use electrolytes. Reflective of these adopted strategies, body mass losses were −3.9±1.7% in the seven African athletes measured vs −2.0±1.6% in the other athletes (p=0.001).
Likewise, only 25% of the African athletes planned to use pre-cooling compared with 85% in other athletes (p=0.004), and only 50% of the African athletes planned mid-cooling compared with 97% in other athletes (p<0.001). It is unclear if these differences are a tactical choice or self-imposed by logistical issues.
Methodological considerations
The 83 questionnaires reported in the current study represented (only) 26% of the 326 road race participants, but it covered from first (ie, gold medal) to last position during the World Championships. Planned strategy may not correspond to the actual strategies implemented on race day, but elite athletes are usually advised not to deviate from familiarised race day plans.36 Tsk may have been influenced by numerous external factors (eg, pre-cooling and mid-cooling strategy), including ice or water dousing after the race, despite the thermography occurring <10 m from the finish line (online supplemental appendix 1).
Conclusions
Most athletes (93%) had a pre-planned drinking strategy based on personal experience, and a pre-cooling plan (80%), predominately an ice vest (53%). Mid-cooling (93%) was more prevalent than pre-cooling, with water dousing (65%) and cold water ingestion (52%) being the most popular. Ice slurry ingestion was not common and menthol-based strategies atypical. Body mass loss was higher in men than women (−2.8±1.5% vs −1.3±1.6%) and was not related to performance. Higher pre-race Tsk (33.8°C±0.9°C) was observed in DNF athletes compared with those athletes who finished (32.6°C±1.4°C). Within finishers, a lower pre-race Tsk was correlated with faster race completion. These data provide guidance for event organisers to support athlete needs (eg, freezers for ice vests) in minimising their temperature increase during a warm-up.
What are the findings?
Most (93%) endurance athletes had a pre-planned drinking strategy including water (85%), electrolytes (83%) and carbohydrates (81%).
Pre-cooling (80%; mainly ice vests 53% and cold towels 45%) and mid-cooling (93%; mainly head/face water dousing 65% and cold water ingestion 52%) were commonly pre-planned by athletes.
Ice slurry ingestion (pre-cooling 21%, mid-cooling 11%) and menthol-based interventions (pre-cooling 1%, mid-cooling 2%) were less common in athletes.
Although potentially underestimated due to wet clothing, relative body mass loss was higher in men than women (−2.8±1.5% vs −1.3±1.6%), and not associated with performance outcome (eg, race time, ‘did not finish’ (DNF) or placing).
Athletes who used ice vests had a lower pre-race core temperature (Tcore, 37.5°C±0.4°C vs 37.8°C±0.3°C), but this did not translate into a statistical performance benefit.
DNF had a higher pre-race skin temperature (Tsk; 33.8°C±0.9°C vs 32.6°C±1.4°C), while within finishers a lower pre-race Tsk was moderately associated with faster race completion (r=0.32).
How might it impact on clinical practice in the future?
Drinking strategies were based predominately on personal experience, indicating the importance of piloting such strategies/interventions away from competition.
Pre-race temperature management, including Tsk, is important for prolonged endurance exercise in hot-humid conditions.
Event organisers should consider the logistical facilities required (ie, freezers) to facilitate ice vest usage at warm-up, as this is a common choice by athletes with good evidence to minimise Tcore increase during warm-up.
Data availability statement
Data are available upon reasonable request.
Ethics statements
Patient consent for publication
Ethics approval
The project was approved by the Anti-Doping Laboratory Qatar ethics committee (E2019000302). All procedures complied with the Declaration of Helsinki and written informed consent was obtained.
Acknowledgments
The authors thank the World Athletics Health and Science Department for their endorsement, financial and operational support. The authors also thank the local organising committee for their operational support and Dr Marine Alhammoud for her help with data representation.
References
Supplementary materials
Supplementary Data
This web only file has been produced by the BMJ Publishing Group from an electronic file supplied by the author(s) and has not been edited for content.
Footnotes
Twitter @ephysiol, @Ihsan_mo, @Marco_Cardinale, @paolo_emilio, @DrJuanMAlonso, @goipergormance, @DrNathanT
Contributors SR designed the study. All authors contributed to data collection and data analyses. All authors revised the manuscript and approved the final version.
Funding This study was supported by World Athletics (formerly International Association of Athletics Federations, IAAF).
Competing interests None declared.
Provenance and peer review Not commissioned; externally peer reviewed.
Supplemental material This content has been supplied by the author(s). It has not been vetted by BMJ Publishing Group Limited (BMJ) and may not have been peer-reviewed. Any opinions or recommendations discussed are solely those of the author(s) and are not endorsed by BMJ. BMJ disclaims all liability and responsibility arising from any reliance placed on the content. Where the content includes any translated material, BMJ does not warrant the accuracy and reliability of the translations (including but not limited to local regulations, clinical guidelines, terminology, drug names and drug dosages), and is not responsible for any error and/or omissions arising from translation and adaptation or otherwise.