Article Text

Abstract
Objective The study aimed to assess the associations of physical activity (PA) trajectories across a 25-year span with coronary artery calcium (CAC) progression, and subsequent risk of cardiovascular disease (CVD) events.
Methods We included 2497 participants from the Coronary Artery Disease Risk Development in Young Adults study who had computed tomography-assessment of CAC at baseline (year 15: 2000–2001) and follow-up (year 20 or 25) and at least three measures of PA from year 0 to year 25. Long-term PA trajectories were determined by latent class modelling using a validated questionnaire.
Results Among the included participants, 1120 (44.9%) were men, 1418 (56.8%) were white, and the mean (SD) age was 40.4 (3.6) years. We identified three distinct PA trajectories based on PA average levels and change patterns: low (below PA guidelines, n=1332; 53.3%); moderate (meeting and slightly over PA guidelines, n=919; 36.8%) and high (about three times PA guidelines or more, n=246; 9.9%). During a mean (SD) follow-up of 8.9 (2.1) years, 640 (25.6%) participants had CAC progression. Participants in the high PA trajectory group had a higher risk of CAC progression than those in the low PA trajectory group after adjustment for traditional cardiovascular risk factors (HR 1.51; 95% CI 1.18 to 1.94). However, high PA trajectory was not associated with an increased risk of incident CVD events (HR 1.01; 95% CI 0.44 to 2.31) and the incidence of CVD events in participants with CAC progression was similar across all three PA trajectory groups (p=0.736).
Conclusion Long-term PA about three times the guidelines or more is independently associated with CAC progression; however, no additional risk of incident CVD events could be detected.
- physical activity
- cardiovascular diseases
Data availability statement
Data are available on reasonable request. Data may be obtained from a third party and are not publicly available. Data may be obtained from a third party and are not publicly available. Data are available upon request and data use agreement with the CARDIA study (https://www.cardia.dopm.uab.edu/).
Statistics from Altmetric.com
Introduction
Physical activity (PA) is defined as any bodily movement resulting from the contraction of skeletal muscle that increases energy expenditure above the basal level.1 Mounting evidence has demonstrated the benefits of regular PA on retarding the development of atherosclerotic cardiovascular disease (CVD) via multiple mechanisms, including achieving and maintaining a healthy weight, and improving cardiovascular risk factors (blood pressure, lipid profiles and blood sugar, etc), and better cardiorespiratory fitness.1 2 A meta-analysis of 33 cohort studies involving 883 372 participants reported risk reductions of 30% to 50% for cardiovascular mortality and 20%–50% for all-cause mortality with increasing volumes of PA.3 Current guidelines recommend that healthy adults should perform a minimum of 150 min of moderate-intensity exercise or 75 min of vigorous-intensity exercise weekly.4 5 On the other hand, there is growing concern that excessive exercise, such as that undertaken by endurance athletes, may be deleterious to cardiovascular health. Several studies suggested a U-shaped or reverse J-shaped dose–response relationship between lifetime PA exposure and cardiovascular morbidity,6 7 indicating that there is an exercise threshold beyond which some of the aforementioned cardiovascular benefits of PA are lost.
Coronary artery calcium (CAC) assessed by CT, an established marker of subclinical coronary atherosclerosis, is a strong predictor of cardiovascular morbidity and mortality and a potent CVD risk stratification tool.8 9 Studies examining the relationship between PA and CAC have revealed discordant results during the past decades; with an inverse relationship in several studies10 11 but positive relationship in others,12–14 and U/J-shaped relationship,15 16 or no relationship in some studies.17 18 One of the important flaws existing in most previous cohort studies is that only a single measure of self-reported PA was taken. It is obvious that individuals’ PA measured at baseline does change over time, as PA can vary greatly throughout the life cycle.19 A recent study using the Coronary Artery Disease Risk Development in Young Adults (CARDIA) study data examined the association of long-term PA patterns with CAC prevalence13; however, the cross-sectional nature of the analysis limited its ability to make a direct casual inference. The relationships of the PA trajectories from young adulthood onwards with CAC progression, and future CVD incidence in later life have not been searched for. Given the importance of primary prevention of CVD, there remains a need to better understand whether diverse PA behaviours from an earlier age can have different impacts on cardiovascular health outcomes. Therefore, the aims of this study were to describe the longitudinal changes in PA levels over a 25-year span among individuals free of CVD in the CARDIA study, and to evaluate the prospective associations of PA trajectories with subsequent CAC progression and incident CVD events.
Methods
Study population
The CARDIA study is the multicentre, prospective longitudinal study designed to investigate the evolution of CVD risk from the young adulthood to midlife. Between 1985–1986 (year 0 of the cohort), a total of 5115 black and white men and women aged 18–30 years, from four urban US sites (Birmingham, Alabama; Chicago, Illinois; Minneapolis, Minnesota; and Oakland, California), were recruited in the study. Until now, participant data have been collected across nine examination cycles including the initial CARDIA cohort and the follow-ups at years 2, 5, 7, 10, 15, 20, 25 and 30 of the cohort. Details of the CARDIA study design and examinations have been reported previously.20 21
For the purpose of the present analysis, we included all the participants at year 15 (n=3671), since the initial measurement of CAC by CT scans was conducted at year 15 (2000–2001). Eight PA evaluations of the participants in the cohort were available: at the beginning of the cohort (1985–1986) and 2, 5, 7, 10, 15, 20 and 25 years later, respectively. As figure 1 shows, participants were then excluded if one of the following data was not available: baseline CAC data (n=629), follow-up CAC data (n=267) or covariates data (n=273) during the observation period. Five subjects who had CVD events before year 15 were also excluded. The final study sample for this analysis was 2497 adults (figure 1).

Flow chart for selecting the Coronary Artery Risk Development in Young Adults (CARDIA) study participants for analysis. CAC, coronary artery calcium; CVD, cardiovascular disease.
Measurements of PA levels
At each of the eight examinations between years 0 and 25, self-reported PA was assessed with the validated CARDIA Physical Activity History questionnaire,22–24 an interviewer-administered of questionnaire of participation in 13 specific categories of recreational sports, exercise, leisure, and occupational PA in the past 12 months.25 The 13 specific categories contained 8 vigorous-intensity activities (jogging or running; vigorous racket sports; bicycling faster than 10 miles/hour; swimming; vigorous exercise class or vigorous dancing; non-work activity such as shovelling, weightlifting and moving heavy objects; vigorous work activity such as lifting, carrying or digging; other strenuous sports such as basketball, football, skating, and skiing) and five moderate-intensity activities (non-strenuous sports such as softball, shooting baskets, volleyball and ping-pong; walking and hiking; bowling or golfing; home exercise or callisthenics; and home maintenance or gardening).
Each activity was scored according to whether it was performed for at least 1-hour total time in any month during the past year, how many months it was performed at that level, and how many months it was performed at least 2–5 hours/week.22 A validation study showed that the activity score has a test–retest correlation of 0.77–0.84 over 2 weeks and was related to skinfold thickness, caloric intake, duration on treadmill exercise test, and high-density lipoprotein cholesterol (HDL-C) level,22 which is comparable to that of other surveys.26 27
The exercise score was computed by multiplying the number of months of infrequent activity (2–5 hours/week) plus three times the number of months of frequent activity (≥6 hours/week) by intensity of the activity (3–8 metabolic equivalent of tasks (METs)), the score was expressed in ‘exercise units’ (EU).27 The total PA score was the sum of over all activities. For reference, a total PA score of 300 EU approaches to Health and Human Services recommendations of approximately 150 min/week of moderate-intensity PA.28 As PA behaviours are complex and vary over the life course,19 assessing within-person trajectories of PA over time would better characterise the association between PA and CAC progression. PA trajectories were identified and categorised based on average PA levels and their change patterns across a 25-year span.
CAC measurements
CAC was measured at years 15, 20 and 25 using a standardised protocol.29 At years 15 and 20, the CARDIA study conducted either a cardiac-gated electron-beam CT or a multidetector CT depending on the study site to detect CAC. At year 25, given the high reproducibility at previous examinations, a single CT scan was performed using only multidetector CT scanners. The comparability of electron-beam CT and multidetector CT has been demonstrated previously.30 Scans were read centrally by a trained reader who was blinded to the participant’s characteristics.
CAC was scored using the Agatston method,31 which was calculated for each calcified lesion; and the scores were summed across all lesions within a given artery and across all arteries (left main, left anterior descending, circumflex and right coronary artery) to obtain the total calcium score. Baseline CAC severity were categorised into three levels based on the Agatston scores: no detectable (CAC=0), mild (0<CAC≤100), and moderate to severe CAC (CAC >100). CAC progression was defined as one of the followings: (1) CAC >0 at follow-up among participants with baseline CAC=0; 2) an annualised change of ≥10 at follow-up among those with 0<baseline CAC <100; 3) an annualised percent change (annualised change in CAC score divided by the baseline CAC score)≥10% among those with baseline CAC≥100.21 32
Incident CVD events
The CARDIA Endpoints Surveillance and Adjudication Subcommittee (ESAS), consisting of clinicians from the participating CARDIA field centres, used pre-established criteria to classify CVD events.33 Incident CVD events obtained through 31 August 2014 of annual event ascertainment were used in this analysis.
Participants were contacted annually to inquire about interim hospitalisations or outpatient medical records; vital status was assessed by participant or by database searches at 6 month contacts between annual examination. The incident CVD events contained fatal and non-fatal coronary heart disease, hospitalisation for heart failure, stroke, transient ischaemic attack or intervention for peripheral artery disease.33 34 Two physician members of the ESAS independently reviewed medical records to classify events using specific definitions and a detailed manual of operations. Disagreements were resolved by full committee review.
Measurements of other covariates
The demographic, lifestyle and education characteristics of participants (eg, age, race, sex, smoking status, alcohol consumption, levels of educational attainment and medication use) were assessed during interviews. Educational attainment was categorised as ≤12 years (representing ≤high school degree), 13–16 years (representing college degree or similar level of education), and ≥17 years (representing >college degree, such as MSc, MD, JD, PhD). Smoking status was classified as current, former, or never. Diabetes was defined as fasting plasma glucose (FPG) ≥126 mg/dL or a history of hypoglycaemic medication use. Hypertension was defined as taking antihypertensive medications, having a diagnosis of hypertension or having three consecutive systolic blood pressure (SBP) readings≥140 mm Hg or diastolic blood pressure readings ≥90 mm Hg. Body mass index (BMI) was calculated as weight divided by the square of height (kg/m2). Laboratory tests were also performed. Briefly, overnight fasting blood samples were drawn using the EDTA vacutainers, plasma was isolated and frozen at −70℃ until shipment on dry ice to the laboratory.21 35 Detailed descriptions of measurements of total cholesterol, low-density lipoprotein cholesterol (LDL-C), HDL-C, triglycerides, serum creatinine and FPG of the participants have been published previously.32
Statistical analysis
Normally distributed continuous data were expressed as mean (SD), and the non-normally distributed continuous data, otherwise, were expressed as the median (IQR). Categorical data were expressed as numbers (percentage). Clinical characteristics at the year 15 examination (the baseline examination for this analysis) by PA trajectory groups were compared using χ2 tests for categorical variables and analysis of variance or Kruskal-Wallis h-test when appropriate for continuous variables. The follow-up period was defined as the time from 2000 to 2001 (year 15) to the incidence of CAC progression, or lost to follow-up, whichever occurred first. We used latent class models to identify different patterns of longitudinal change in PA from year 0 to year 25. Models were fit using R V.3.6.1 based on R package tidyLPA. Group-based trajectory analysis was used to identify clusters of individuals with similar patterns of change over time.36 The optimal number of trajectory groups was determined using a combination of Bayesian information criterion and number of observations in each group. Participants were assigned to the trajectory group for which they had the greatest posterior predictive probability. To estimate the association of PA trajectory groups with CAC progression, PA trajectory group was included as an independent variable in a Cox proportional hazard model examining predictors of follow-up CAC progression. We estimated the risk of CAC progression or CVD events by calculating HRs and 95% CIs. The adjusted model included baseline age, alcohol consumption, antihypertensive medication use, BMI, diabetes, education level, LDL-C, race, serum creatinine, SBP and smoking status. We further performed specified subgroup analysis by sex, race, BMI, status of hypertension, diabetes, and baseline CAC. Moreover, we used a restricted cubic spline regression model with three knots to assess the dose–response association between the single PA measured at year 0 or year 15 of the cohort and CAC progression.
All analyses were conducted in SPSS V.23 (SPSS) and R V.3.6.1. A two-sided p<0.05 was considered statistically significant.
Patient and public involvement
The CARDIA study is a pre-existing resource. Patients or the public were not involved in the design, conduct, reporting or dissemination plans of our research.
Results
Baseline characteristics according to PA trajectory groups
As shown in table 1, of the 2497 eligible participants at baseline, 1120 (44.9%) were men, and 1418 (56.8%) were white. The mean (SD) age was 40.4 (3.6) years, 375 (15.0%) had hypertension, 126 (5.0%) had diabetes, and 230 (9.2%) had detectable CAC. In general, PA showed an age-related decline from early adulthood to midlife. However, three distinct PA trajectory groups were identified by using latent class models (figure 2): group 1 (n=1332, 53.3%) was characterised by individuals who engaged in PA below the guidelines, with a median PA level at year 0 approaching 78% of the minimum recommended by the guidelines; in this group, PA levels decreased during early adulthood and then slightly increased over time. Group 2 (n=919, 36.8%) was characterised by individuals who engaged in PA meeting or slightly over the guidelines; in this group, a consistent rate of decline in PA levels was observed over time. Group 3 (n=246, 9.9%) was characterised by individuals who engaged in PA about three times the guidelines or more; in this group, PA levels increased steadily during early adulthood, reached a peak at year 5 and then decreased. These three groups are designated as ‘low’, ‘moderate’ and ‘high’ PA trajectory groups in the subsequent descriptions. The mean posterior probability of group membership was high for each trajectory group (low PA, 94.3%; moderate PA, 94.4% and high PA, 94.4%). The median (IQR) changes in PA levels from the year 0 to year 25 examinations by trajectory group were −60.0 (−203.5 to 52.0) EU in low PA, −84.0 (−304.0 to 140.0) EU in moderate PA, and −91.0 (−461.0 to 225.0) EU in high PA trajectories (online supplemental table 1), respectively.
Supplemental material

Trajectories of physical activity (PA) over 25 years.
Baseline characteristics of participants at year 15 stratified by PA trajectory groups
The baseline characteristics of participants by trajectory groups are summarised in table 1. Compared with the participants in the low PA trajectory, those in the high PA trajectory were younger, more often male and white. Additionally, levels of DBP, BMI, prevalence of hypertension, diabetes and antihypertensive medication use were lower in the participants in the high PA trajectory than in those in the low PA trajectory. Higher levels of alcohol consumption, education, serum creatinine and baseline CAC severity were found in the high PA trajectory group than in the low PA trajectory group. However, there were no significant differences for smoking status, SBP, serum lipid profiles, FPG and lipid-lowering medication use among the three PA trajectory groups.
PA trajectories, CAC progression and incident CVD events
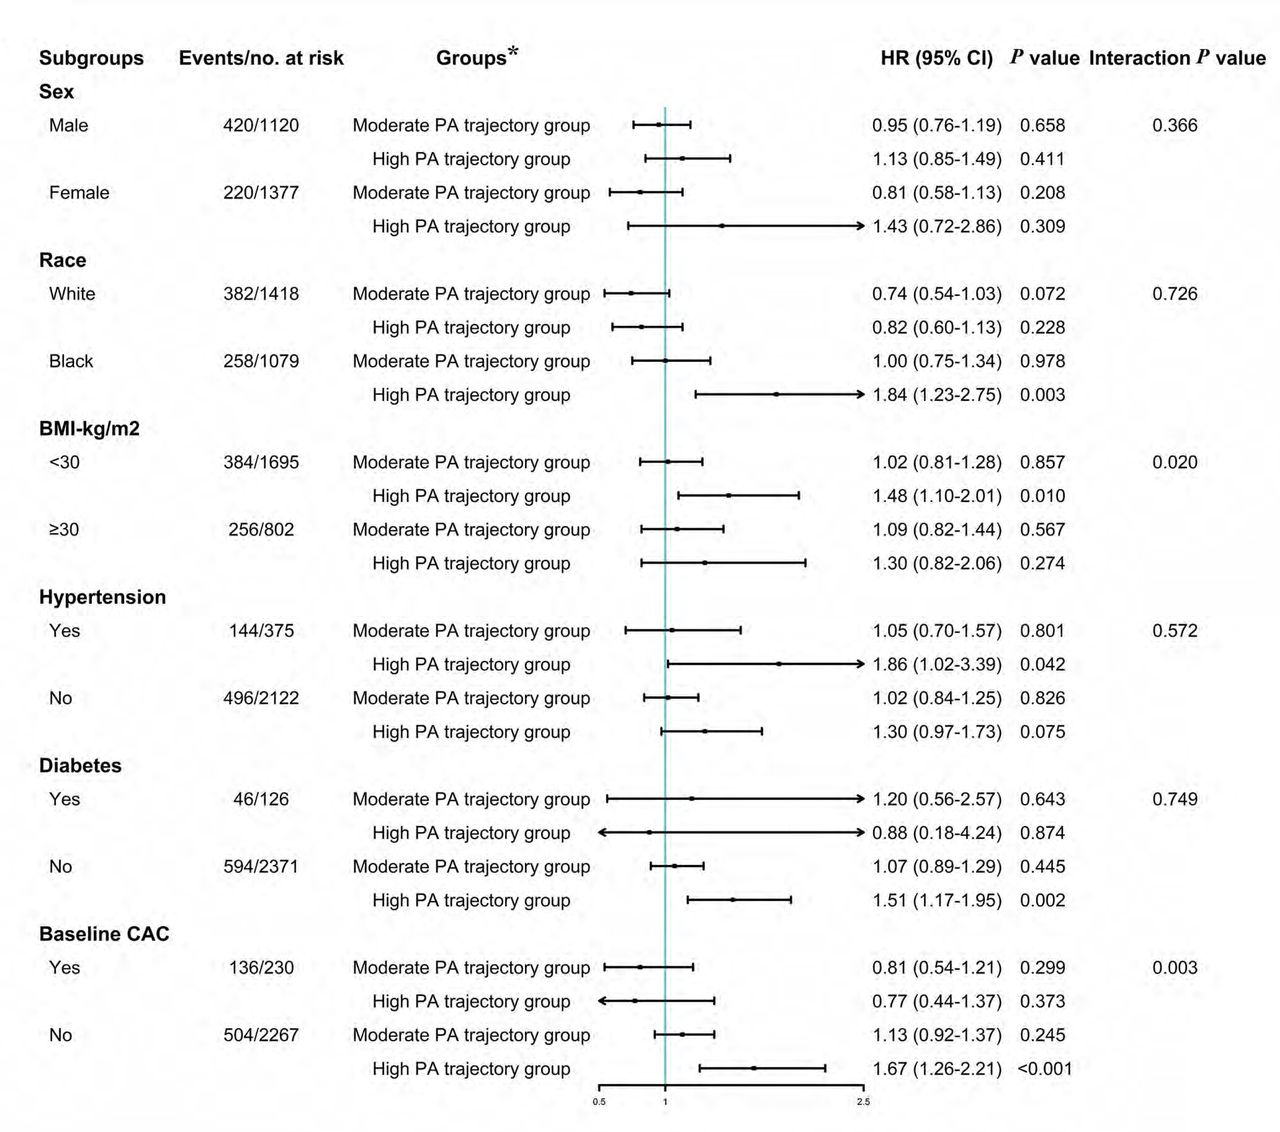
No relationship was found between a single measure of PA (year 0 or year 15) and CAC progression using a spline regression model (online supplemental figure 1). We then evaluated the association between PA trajectories and CAC progression. During a mean (SD) follow-up of 8.9 (2.1) years, 640 (25.6%) participants had CAC progression. As shown in table 2, the prevalence of CAC progression was 321 (24.1%), 235 (25.6%) and 84 (34.1%) in the low, moderate and high PA trajectory groups, respectively. In the unadjusted model, the risk of CAC progression was significantly higher in the high PA than in the low group (HR 1.39; 95% CI: 1.10 to 1.77, table 2), and a statistically significant increase of the risk of CAC progression remained even after adjusting for demographics and cardiovascular risk factors (HR 1.51; 95% CI 1.18 to 1.94) and additionally adjusting for a single PA level measured at year 0 or year 15 (both p<0.05, table 2). However, the risk of CAC progression was similar between the low and moderate PA groups in unadjusted as well as in the adjusted models (table 2, all p>0.05). When participants were stratified by sex, race, status of hypertension and diabetes, the association between the high PA trajectory group and CAC progression remained similar (figure 3). However, when BMI and baseline CAC were taken into account, the relationship was stronger in participants with BMI <30 kg/m2, and those without detectable CAC at baseline (both interaction p<0.05, figure 3). Of note, the risk of CVD events was not significantly different among the three PA trajectory groups in the unadjusted and adjusted models (both p>0.05, table 3).
Subgroup analysis of the association between physical activity (PA) trajectories and CAC progression. Cox regression was performed after adjustment for age, alcohol consumption, antihypertensive medication use, BMI, diabetes, education level, low-density lipoprotein cholesterol, race, serum creatinine, systolic blood pressure, and smoking status. *HR and 95% CI were derived from Cox regression models and low PA trajectory group was used as the reference in each subgroup analysis. BMI, body mass index; CAC, coronary artery calcium.
Risk of CAC progression for PA trajectory groups
Risk of CVD events for PA trajectory groups
We then explored the association between PA trajectories, stratified by CAC progression status, and incident CVD events. As shown in online supplemental figure 2, after a subsequent mean (SD) follow-up of 6.9 (2.1) years, a significantly higher incidence of CVD events was observed in participants with CAC progression than in those without among all three PA trajectory groups (27/321 (8.4%) vs 8/1011 (0.8%), 20/235 (8.5%) vs 3/684 (0.4%) and 5/84 (6.0%) vs 2/162 (1.2%) in the low, moderate and high PA trajectory group, respectively, all p<0.05). However, the incidence of CVD events in participants with CAC progression was identical across all three PA trajectory groups (p=0.736).
Discussion
In this longitudinal analysis of the CARDIA cohort, we describe heterogeneous patterns of change in PA over a 25-year span from young adulthood (18–30 years) into midlife. We identify three distinct PA trajectories which encompasses an average level of PA (below the guideline recommendations, meeting and slightly over the guidelines and about three times the guidelines or more) and specific time course/change patterns over the 25 years of observation. We demonstrate that, high levels of PA trajectory beginning at a young age are independently associated with a higher risk of CAC progression in later midlife; whereas, a bit paradoxically, it does not carry a correspondingly higher risk of incident CVD events.
Health benefits of regular PA and exercise have been well established, and PA is a cornerstone of maintaining and improving cardiovascular health.4 5 The association between the amount of moderate to vigorous PA and cardiovascular risk is continuous with no known lower limit. This means that even engaging in some PA, even if less than the recommended amount, is still beneficial.5 Whereas, controversy exists about the upper limit, as to whether extreme levels of PA and exercise may lead to potential adverse cardiovascular outcomes.37 CAC scanning is one of the most powerful emerging risk assessment tools, with a wealth of data supporting its ability to enhance cardiovascular risk estimation.8 9 It should be noted that high levels of PA were reported to potentially increase prevalence of CAC and subclinical atherosclerosis.12–14 38 However, descriptions of this relationship mostly relied only on a single-valued PA measurement and focused on endurance athletes, which is not representative of the general population and includes associated parameters (such as specific life habits, nutrition, supplement food or even medication) difficult to disentangle from the effect of the PA per se. Through serial PA measurements, we identified three distinct trajectory groups that better summarise subjects’ behaviour over a 25-year period of time in early adulthood than a single measure of PA at year 0 (beginning of the cohort) or year 15 (date of CAC first measurement). In addition, unlike previous studies focusing on elite and amateur athletes,37–39 we recruited a general population of young adults free of CVD events at baseline. Among the participants in this general population cohort, our model did identify a group of adults with a trajectory which combines a PA three times the guideline recommendations or more, in average, and a particular pattern of change in their PA from early adulthood for a 25-year observation period. And for the first time we show that high levels of PA are associated with CAC progression in midlife after adjustment for traditional risk factors. Plausible explanations could account for this paradox. Prolonged high levels of PA-induced increase in cardiac output may increase mechanical stress on the epicardial coronary arteries, leading to vessel wall injury and accelerated atherosclerosis.39 Furthermore, high levels of PA increase blood pressure, parathyroid hormone levels, and several pro-inflammatory factors, all of which are involved in CAC progression.2 Another interesting result of our study was that the association of long-term, high-volume PA trajectory with CAC progression was especially observed in participants with fewer traditional risk factors, including individuals with lower BMI and subjects without detectable CAC at baseline. It is speculated that the potential role of high levels of PA on CAC progression may be overwhelmed in the individuals who are otherwise prone to vascular calcification, for example, individuals with obesity.40 Similarly, an attenuated tendency between high PA trajectory and CAC progression was observed among those individuals who already had documented CAC at baseline in this study. All these points should be confirmed by further studies.
Once CAC has been discovered, a great clinical concern is whether continued high levels of PA accelerate the transition to clinical disease, including nonfatal and fatal cardiovascular events.9 Although a few previous studies raised the possibility that long-term, high-volume endurance exercise may actually be deleterious to cardiovascular health,6 7 38 extensive evidence has demonstrated substantial all-cause and CVD-related mortality benefits to individuals with regular PA, even above the recommended target range.41–44 In the postanalysis of 14 599 participants from the European Prospective Investigation into Cancer and Nutrition-Norfolk cohort, it was shown that maintaining at least the minimum PA recommendations (150 min/week of moderate-intensity PA) would potentially prevent 46% of deaths associated with physical inactivity.45 Additionally, a pooled data analysis of six studies in the National Cancer Institute Cohort Consortium demonstrated a benefit threshold on mortality at approximately 3–5 times the recommended minimum PA and no excess risk at 10 or more times the minimum.42 In a large meta-analysis of 48 studies comparing the recommended PA level (750 MET min/week) with higher levels of PA, Blond et al reported that mortality risk was lower at PA levels exceeding the recommendations, at least until 5000 MET min/week for all-cause mortality (HR 0.86, 95% CI 0.78 to 0.94) and for CVD mortality (HR 0.73, 95% CI 0.56 to 0.95).41 Thus, there is little evidence suggesting that high levels of long-term PA increase the risks of mortality and adverse cardiovascular outcomes in the general population. Although a significant increased risk of incident CVD events is observed in participants with CAC progression compared with those without in all three PA trajectory groups, we demonstrate that the long-term trajectory of high-volume PA shared a similar risk of incident CVD events compared with the lowest PA trajectory despite having a greater CAC progression.
We cannot totally exclude the random effect of a relatively small sample size and short follow-up period on the incident CVD events after CAC progression, as well as the combined effect of fewer cardiovascular risks (such as hypertension and diabetes) in this CARDIA study sample, especially for the high PA trajectory group. In the general and patient populations, prevalence and severity of CAC and atherosclerotic plaques are strongly associated with the 5-year and 10-year risk of CVD events,9 yet there is strong evidence that endurance athletes live longer than the general population.46 It is speculated that the most active athletes have more often only calcified plaques and fewer mixed plaques, which are more stable and less likely to rupture47 48; this in turn would lead to a lower risk of CVD mortality.49 Likewise, high-intensity statin therapy increases CAC (at a level similar to that observed in our high PA group), but decreases coronary atheroma volume and cardiovascular risk.50 Studies on atherosclerotic plaque features in athletes and/or in those with high-intensity statin treatment have shown a more stable, less inflamed plaque phenotype compared with their sedentary counterparts.50 51 Permanent and sustained exercise may also help develop collateral circulation which might participate in the prevention against the occurrence of CVD events, including heart and peripheral artery diseases.1 Based on these findings, we do not recommend routine CAC screening for individuals purely because of their PA volumes. Instead, overall risk factors for CVD should be assessed comprehensively before starting on any interventions, including symptoms of myocardial ischaemia, family history of atherosclerotic coronary artery disease and other factors affecting cardiovascular risk.2 52
Strengths
Several strengths of this study are noteworthy. The ongoing CARDIA study represents a biracial cohort beginning in young adulthood that has monitored participants for over 30 years, providing a unique opportunity to examine the association between PA trajectories of early adulthood and health outcomes later in midlife. Based on the comprehensive data, our findings add to our understanding of the association between PA trajectories and CAC progression with incident CVD events.
Limitations
Nevertheless, the inherent limitations should not be underestimated. Since accelerometer-based PA data was only obtained at years 20 and 30,53 up to 5 years after the initial CAC measurement, PA trajectories in this study were derived from measurements by a self-reported questionnaire. However, the CARDIA study used a validated questionnaire for assessing PA,22–24 and we adopted repeated assessments of PA to minimise the possible effect of single measurement error. Similarly restricted by the CARIDA data collection,22 we cannot discriminate PA trajectory types in more detail (eg, leisure time/occupational PA), which was recently reported to have contradictory impacts on mortality.54 The study included a general population of young adults whose upmost PA volumes seldomly reached the extent taken by recreational and competitive athletes as previously reported.38 Therefore, we cannot do a further subgroup analysis in the high PA group to detect an upwards turn in CAC progression, because there were only 9 (3.7%) participants in this group whose PA levels were comparable to elite athletes. In addition, with the relatively low number of total participants and incident CVD events in the high PA group, our results may be affected by sparse data bias and underpowered to make definitive conclusions.55 Moreover, as for the nature of any observational studies, we cannot completely exclude the possibility of residual confounders completely despite our careful adjustment for the well-known and suspected risk factors.
Conclusion
We identified three distinct trajectories of PA in this prospective cohort study of young adults, and provided new evidence that nearly permanent PA three times the usual guideline recommendations or more beginning from early adulthood is independently associated with CAC progression in midlife; but carries a similar risk of incident CVD events compared with the lowest PA trajectory, particularly notable in participants without obvious traditional risk factors. We suggest that the presence of CAC among individuals engaging in long-term, high-volume PA early in adult life represent a clinically benign phenotype. The underlying pathophysiological mechanisms and interpretation of CAC scores in patients with high PA deserve further study.
Key messages
What is already known on this topic?
Regular physical activity (PA) confers a series of cardiovascular benefits by achieving and maintaining a healthy weight, and reducing the risk of cardiovascular disease (CVD).
➢A high level of moderate-intensity to vigorous-intensity PA has been reported to be at an increased risk of coronary artery calcium (CAC), which seems contradictory to its cardioprotective effects.
What this study adds?
In this cohort study of 2497 black and white young adults, 3 distinct PA trajectories were identified over a 25-year span.
Long-term PA trajectory about three times the usual guideline recommendations or more, with typical patterns of changes over a 25-year period, carried no correspondingly higher risk of CVD events despite its association with CAC progression.
How this study might affect research, practice or policy?
The findings suggest that in the general population, as is suggested in professional athletes, high volumes of PA are independently associated with CAC progression, while no increased cardiovascular risk could be detected, which may represent a clinically benign phenotype.
While CAC screening can add to a comprehensive CVD risk assessment in adults, CAC scores should be interpreted along with conventional risk factors for CVD and possibly PA levels. More research is needed to guide interpretation of CAC screening in adults with high PA.
Data availability statement
Data are available on reasonable request. Data may be obtained from a third party and are not publicly available. Data may be obtained from a third party and are not publicly available. Data are available upon request and data use agreement with the CARDIA study (https://www.cardia.dopm.uab.edu/).
Ethics statements
Patient consent for publication
Ethics approval
The CARDIA study was approved by the institutional review boards at each participating institution (Birmingham, Alabama; Chicago, Illinois; Minneapolis, Minnesota; and Oakland, California). Participants gave informed consent to participate in the study before taking part.
Acknowledgments
We thank the investigators, the staffs and participants of the CARDIA study for their highly valued contributions.
References
Supplementary materials
Supplementary Data
This web only file has been produced by the BMJ Publishing Group from an electronic file supplied by the author(s) and has not been edited for content.
Footnotes
J-WG and Q-YH contributed equally.
Contributors J-WG and P-ML had full access to all of the data in the study and take responsibility for the integrity of the data and the accuracy of the data analysis. J-WG, Q-YH and P-ML were responsible for the study concept and design. Q-YH, J-WG and J-JH conducted the statistical analysis and interpreted the data. Q-YH and J-WG drafted the manuscript. J-WG, DAV and P-ML contributed to critical revision of the manuscript for important intellectual content. S-LZ and P-ML were responsible for the study supervision. P-ML was the guarantor and responsible for the overall content. All authors approved the final version of the manuscript.
Funding This work is supported by grants from National Natural Science Foundation of China (82170457, 81900379, 81870315, 81970683). The CARDIA study is conducted and supported by the National Heart, Lung and Blood Institute in collaboration with the University of Alabama at Birmingham (grants HHSN268201800005I and HHSN268201800007I), Northwestern University (grant HHSN268201800003I), University of Minnesota (grant HHSN268201800006I) and Kaiser Foundation Research Institute (grant HHSN268201800004I), of the USA.
Competing interests None declared.
Patient and public involvement Patients and/or the public were not involved in the design, or conduct, or reporting, or dissemination plans of this research.
Provenance and peer review Not commissioned; externally peer reviewed.
Supplemental material This content has been supplied by the author(s). It has not been vetted by BMJ Publishing Group Limited (BMJ) and may not have been peer-reviewed. Any opinions or recommendations discussed are solely those of the author(s) and are not endorsed by BMJ. BMJ disclaims all liability and responsibility arising from any reliance placed on the content. Where the content includes any translated material, BMJ does not warrant the accuracy and reliability of the translations (including but not limited to local regulations, clinical guidelines, terminology, drug names and drug dosages), and is not responsible for any error and/or omissions arising from translation and adaptation or otherwise.