Article Text

Abstract
Objective For transgender women (TW) on oestrogen therapy, the effects of prior exposure to testosterone during puberty on their performance, mainly cardiopulmonary capacity (CPC), while exerting physical effort are unknown. Our objective was to evaluate CPC and muscle strength in TW undergoing long-term gender-affirming hormone therapy.
Methods A cross-sectional study was carried out with 15 non-athlete TW (34.2±5.2 years old), 14 cisgender men (CM) and 13 cisgender women (CW). The TW received hormone therapy for 14.4±3.5 years. Bioimpedance, the hand grip test and cardiopulmonary exercise testing on a treadmill with an incremental effort were performed.
Results The mean VO2peak (ml/min) was 2606±416.9 in TW, 2167±408.8 in CW and 3358±436.3 in CM (TW vs CW, p<0.05; TW vs CM, p<0.0001; CW vs CM, p<0.0001). The VO2peak/fat-free mass (ml/kg/min) was 47.3±5.1 in TW, 53.3±8.3 in CW, and 52.4±5.8 in CM (TW vs CW p>0.05; TW vs CM p>0.05; CW vs CM p>0.05). The O2 pulse in TW was between that in CW and CM (TW vs CW, p<0.05, TW vs CM, p<0.0001). There was a high correlation between VO2peak and fat-free mass/height2 among TW (r=0.7388; p<0.01), which was not observed in the other groups. The mean strength (kg) was 35.3±5.4 in TW, 29.7±3.6 in CW and 48.4±6.7 in CM (TW vs CW, p<0.05; TW vs CM, p<0.0001); however, adjusted for fat-free mass there was no difference between TW (0.6±0.1) and CW (0.7±0.9; p<0.05).
Conclusion Absolute CPC in non-athlete TW showed an intermediate pattern between that in CW and CM; however, relative CPC adjusted for fat-free mass showed no difference between TW and CW or CM. Similarly, the mean strength in non-athlete TW was higher than those in non-athlete CW but not when adjusted for fat-free mass.
- Body composition
- Exercise Test
- Women
- Cardiology
Data availability statement
All data relevant to the study are included in the article or uploaded as online supplemental information. Not applicable.
Statistics from Altmetric.com
WHAT IS ALREADY KNOWN ON THIS TOPIC
The performance of transgender women during physical effort is not well known. There are no data on cardiopulmonary capacity in transgender women.
WHAT THIS STUDY ADDS
These are the first scientific data on the cardiopulmonary capacity of transgender women undergoing long-term gender-affirming hormone therapy. The absolute mean VO2 peak of non-athlete transgender women while performing physical exertion was higher than that of non-athlete cisgender women and lower than that of cisgender men, but there were no differences in relative VO2 peak when adjusted for fat-free mass.
HOW THIS STUDY MIGHT AFFECT RESEARCH, PRACTICE OR POLICY
This study was in non-athletes and findings may not apply to policy decisions about the participation of transgender women in sporting activities.
Future studies involving transgender athletes that account for and quantify variable exposure times to pubertal development and assess muscle cell metabolism are needed to elucidate the effects of long-term gender-affirming hormone therapy on transgender women sports performance.
Introduction
Sex differences determined by sex steroids during puberty and maintained throughout reproductive life promote different physical performance between males and females.1 Testosterone in males induces changes in muscle mass, strength, anthropometric variables and haemoglobin levels.1
The maximal oxygen consumption (VO2 peak) score is 25%–30% or even 50% lower in cisgender women (CW) than in cisgender men (CM) matched for age.1 These differences are a consequence of the lower arteriovenous oxygen difference (a-vO2diff) and lower cardiac output (CO) in females.2 3 Transgender women (TW) are treated with oestrogen therapy with or without antiandrogenic agents to reduce endogenous levels of testosterone. Hormone treatment in younger TW aims to mimic oestradiol levels in premenopausal CW to promote the development of female characteristics and reduce androgen-related features.4
We hypothesised that TW who have had prior androgen exposure and are undergoing long-term gender-affirming hormone therapy (GAHT) have different cardiopulmonary capacity (CPC) and muscle strength from CW and CM.
This study intends to elucidate aspects of the sporting abilities of TW after long-term GAHT through the use of gold standard methodologies for the analysis of cardiopulmonary and strength capacities.
Objectives
To evaluate CPC and muscle strength in TW undergoing long-term GAHT and correlate these findings with body composition (BC).
Methods
The evaluators were not blinded, with the exception of those who evaluated the results of the cardiopulmonary exercise tests.
Definitions
Transgender group
A cross-sectional study was carried out with 15 TW (average age of 34.2 years old, SD±5.2) followed at the Gender Dysphoria Unit of the Division of Endocrinology of Hospital das Clínicas da Faculdade de Medicina da Universidade de São Paulo (figure 1). The criteria for gender dysphoria diagnosis were in accordance with the Diagnostic and Statistical Manual of Mental Disorder/International Classification of Diseases guidelines.

Selection of transgender women (A) and the control group subjects (B). Methods (C). DSM V, Diagnostic and Statistical Manual of Mental Disorders; Hb, haemoglobin; Ht, haematocrit; ICD-10, International Classification of Diseases 10th edition. HCFMUSP, Hospital de Clínicas dA Faculdade de medicina dA Universidade de São Paulo.
Retrospective data about the TW, such as age at the beginning of hormone therapy, were collected from their respective medical records (online supplemental table 1). Among them, 11 were non-gonadectomised subjects and were on oestrogen plus cyproterone acetate therapy, and 4 were gonadectomised and were receiving isolated oestrogen therapy. Comparative study of TW gonadectomised versus not gonadectomised was done, and no significant differences were observed (online supplemental table 2). The median age at GAHT initiation was 17 (range 12–35) years, and the average duration of GAHT was 14.4±3.5 years. None of them used a GnRh (gonadotropin-releasing hormone) analogue at any time. The volunteers were not athletes.
Supplemental material
Control groups
The cisgender control group consisted of 27 healthy and asymptomatic subjects, with 13 CW (35.6±4.1 years of age) and 14 CM (36.7±3.8 years of age) (online supplemental table 1), who were matched by age and physical activity level to the TW group according to the International Physical Activity Questionnaire (IPAQ) (online supplemental tables 3 and 4).
The following conditions were evaluated by clinical and laboratory assessment and considered to be exclusion criteria for the cisgender control group: smoking, chronic renal failure (creatinine >1.4 mg/dL), hepatic failure, systemic arterial hypertension (blood pressure (BP) >140/90 mm Hg or patient on antihypertensive medication), inflammatory diseases, neoplasia, diabetes mellitus and hypogonadism of any aetiology, haematologic diseases, peripheral vascular diseases, dyslipidaemia (or patient on lipid-lowering medication), cardiomyopathies, valvular heart diseases and congenital diseases. Information was collected through an interview carried out by the researchers.
Laboratory analysis
Laboratory blood tests were collected on the same day, immediately before bioimpedance, ergospirometry and strength tests. Haemoglobin and haematocrit levels (electronic, automatic counter, morphological evaluation in stained smears), follicle-stimulating hormone (electrochemiluminometric), luteinising hormone (electrochemiluminometric), oestradiol (electrochemoimmunoassay) and total testosterone (TT) (electrochemoimmunoassay) were analysed in blood samples.
Although the analyses in this manuscript were made based on TT levels at the time of the study, we also analysed the mean TT levels of the TW during the last year before the start of the study and compared them with the TT levels measured on the day of the study. These data represent one more measure to demonstrate the extent of suppression of TT values in this group of individuals over time (online supplemental figure 1).
Level of physical activity assessment
The IPAQ was used to measure the level of physical activity. The IPAQ was developed by the WHO in association with the North American Centers for Disease Control and Prevention (CDC).5 6 The short-IPAQ version was chosen because it has been validated in the Brazilian population.5 In 2002, a consensus between the Center for Studies of Physical Fitness Laboratory of São Caetano do Sul and the Atlanta CDC was used to analyse data collected with the IPAQ, taking into account the criteria of frequency and duration of activities.5
The subjects (TW, CW and CM) were classified into five categories (sedentary, insufficiently active A and B, active and very active) according to IPAQ recommendations5 (online supplemental table 3).
Anthropometric measurements
The anthropometric data were evaluated by using the following parameters: height, body weight and body mass index (BMI, weight/(height)2; (kg/m2).
BC assessment
BC was assessed by an InBody 720 device (Biospace, Korea) with an 8-point reading through a tactile electrode.
The parameters evaluated were weight, BMI, total body fat mass (FM), percentage of body fat mass (%FM), skeletal muscle mass (SMM) and fat-free mass (FFM). The Baumgartner Index (appendicular skeletal muscle mass (ASM) adjusted by height squared), fat mass/height2 (FM/Hgt2) and fat-free mass/height2 (FFM/Hgt2) were calculated to eliminate height as a determinant factor in fat body mass and muscle mass.
Muscle strength testing
The hand grip strength (HGS) test was carried out using the Smedley/Stoelting Hand Dynamometer with adjustable hand size, USA, as recommended by the American Society of Hand Therapists (ASHT).7
The tests were performed with the dominant hand of each individual three consecutive times. Participants were instructed to perform a maximum contraction for 3 s in each test. There was a 30 s rest period between each test. To analyse the parameters associated with the measurement of HGS in each individual, the mean values of the three tests were used according to the ASHT. The maximum strength of each individual was also analysed.
Cardiopulmonary assessment
Ergospirometry test: All individuals underwent cardiopulmonary exercise testing (Sensor Medics—Vmax Analyser Assembly, Encore 29S) on a treadmill (Ergoline—Via Sprint 150 P) with incremental effort until exhaustion (ramp protocol). During cardiopulmonary exercise testing, cardiovascular performance was continuously evaluated through electrocardiography (Micromed—Cardio PC 13) with twelve leads simultaneously. Heart rate was recorded at rest with the individual positioned on the treadmill, at the end of each minute of the cardiopulmonary exercise test and in the first, second, fourth and sixth minutes of the recovery period. BP was always measured by the same examiner at rest, in the final 30 s every two stages of exercise and in the first, second, fourth and sixth minutes of the recovery period. Any observed electrocardiographic alteration that might compromise the experimental protocol excluded the individual from the study. The maximum functional capacity was determined by peak oxygen consumption (VO2peak) evaluated at the maximum exercise intensity. The criteria used to consider the ergospirometry test as maximum were a respiratory exchange ratio (RER) >1.10 and/or maximum heart rate (HRmax) >95% of the age-predicted HRmax. The anaerobic threshold (AT) was determined at the time the individual presented the lowest ventilatory equivalent value for O2 (VEO2) and partial oxygen pressure at the end of expiration (PO2) (PetO2), before these parameters started to progressively increase, and a non-linear increase in the RER value. The respiratory compensation point (RCP) was determined at the time the individual presented the lowest value of ventilatory equivalent for CO2 (VECO2), before this parameter started to progressively increase, and the maximum value of partial pressure for CO2 at the end of expiration (PCO2) (PetCO2), before initiating a progressive decrease in this response.
Ergospirometry tests were carried out by the Cardiovascular Rehabilitation and Exercise Physiology Unit of Instituto do Coração, Hospital das Clinicas da Faculdade de Medicina da Universidade de São Paulo.
Statistical analysis
Statistical analysis was performed using GraphPad Prisma V.8.4.2. The D’Agostino and Pearson test was used to evaluate whether the variables were parametric or non-parametric. For parametric variables, comparison among the three groups was done through analysis of variance, and for comparative subanalyses of every two groups, the Tukey’s test was used. The Kruskal-Wallis test was used for non-parametric variables, and Dunn’s multiple comparison test was used for comparative subanalyses of two groups. A p<0.05 was considered indicative of statistical relevance in all tests.
Results
Laboratory analysis
The haemoglobin levels (g/dL) of the TW, CW and CM were 14.0±0.6, 13.8±0.6 and 15.3±1.1, respectively (table 1).
Comparative analysis of age, BMI and laboratory tests among the transgender woman, cisgender woman and cisgender man groups
Hormonal data
On the day of sporting ability analysis, the mean TT (ng/dL) levels of the TW, CW and CM were 92.5 (range 12–637), 20.1 (12–41) and 524.3±169.0, respectively.
One of the participants had a high level of testosterone at the time of the study. Although she was not blocked on the test day (TT=637 ng/dL), her value was 79 ng/dL 6 months before the study (online supplemental figure 1). In addition, this point did not interfere with her VO2 results (online supplemental figure 2).
Level of physical activity
There was no significant difference in the level of physical activity between the groups (TW vs CW, p>0.05; TW vs CM, p>0.05; CW vs CM, p>0.05), with most participants being active or very active in all groups (online supplemental table 4).
Metabolic and cardiopulmonary analysis
At rest, the TW VO2 was not significantly different from the CM VO2 (p>0.05), and both were significantly higher than the CW VO2 (TW vs CW, p<0.05; CM vs CW, p<0.05). A similar pattern was observed at the AT despite the lack of significance in the TW vs CW analysis (p>0.05). From the RCP onwards, the TW VO2 rates began to drop and were lower than the VO2 rates of CM (TW vs CM, p<0.01 at RCP and p<0.0001 at peak) (table 2).
Comparative analysis of metabolic aspects, cardiopulmonary capacity and strength among the transgender woman, cisgender woman and cisgender man groups
In the comparison between TW and CW at effort, the maximum HR was higher in TW (p<0.05), as was the % maximum HR predicted per age (p<0.01) (table 2).
Figure 2 shows the metabolic pattern of all groups from rest to maximal effort and the correlation between fat-free mass and VO2peak.

Comparative analysis of aerobic capacity of transgender women, cisgender women and cisgender men during incremental effort from rest to exhaustion. Top: from left to right, VO2 at rest (A), aerobic threshold (AT) (B), respiratory compensation point (RCP) (C) and peak (D) of transgender women, cisgender women and cisgender men. Middle: E: representation of the VO2 performance of the three groups from rest to exertion. Bottom: correlations of VO2 peak and fat-free mass (FFM)/height2 (Hgt2) among transgender women (F), cisgender women (G) and cisgender men (H). VO2, oxygen consumption. AT, anaerobic threshold; FFM, fat-free mass; NS, non-significant; RCP, respiratory compensation point. *p<0.05, **p<0.01, ****p<0.0001.
Analysis of muscle strength
The measurement of mean muscle strength evaluated using the HGS test in the three groups, and the results were as follows: TW, 35.2±5.4 kg; CW, 29.6±3.6 kg and CM, 48.4±6.7 kg. The comparative subanalyses of every two groups by means of Tukey’s multiple comparisons test showed a significant difference in mean strength between TW and CW (p<0.05) (table 2).
BC analysis
The %FM of TW was lower than that of CW (29.5±5.7 vs 32.9±5.7; p>0.05) and higher than that of CM (20.2±5.7; p<0.001). The SMM of the TW was intermediate between the CW and the CM, as well as in the analyses that adjusted for height as a confounding factor, the Baumgartner Index and FFM/Hgt2 ratio (table 3).
Comparative analysis of body composition among the transgender woman, cisgender woman and cisgender man groups
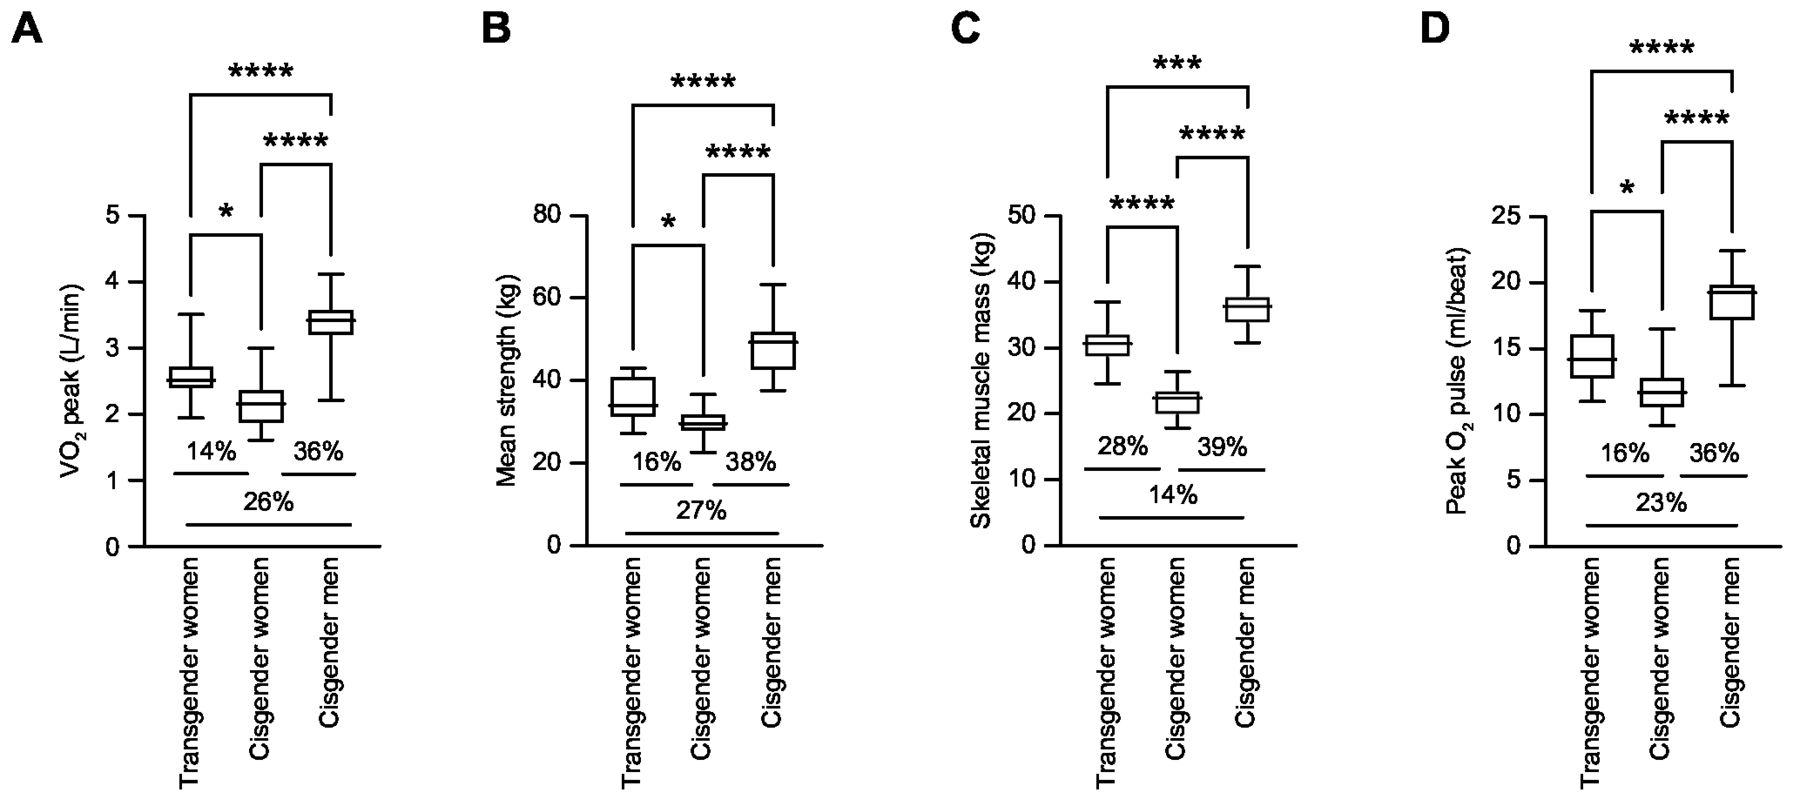
In figure 3, we present the main aspects that impact physical performance and the percentage difference between the analysed groups.
Comparative analysis of the main determinants of physical performance in transgender women, cisgender women and cisgender men. from left to right, peak VO2 (A), strength (B), skeletal muscle mass (C) and peak pulse O2 (D). The lower portion of each graph shows the percentage differences among the groups. VO2, oxygen consumption. *p<0.05, **p<0.01, ****p<0.0001.
Discussion
Physical performance is determined directly by anthropometric characteristics, strength and CPC.8 The gross amount of muscle mass, strength and VO2 enables some CM to have greater performance, whether at an amateur or elite level.8 Such knowledge has implications for sport regulation.8
This study describes the first data in the literature on VO2peak in non-athlete TW undergoing oestrogen hormone therapy, as well as other parameters of physical performance evaluated through an ergospirometry test. Since only data on BC and muscle strength, mainly in the first 2 years of GAHT, have been presented in the recent literature,1 8 our study also differs by showing these aspects in a population after long-term exposure to hormone therapy. Importantly, our findings represent non-athlete TW who mostly started GAHT after prior androgens exposure.
Cardiometabolic aspects
The results showed similarity between parameters of CM and TW undergoing GAHT at rest and differences between those of CW and TW. These data suggest that the CP physiology of TW was partially maintained in the male pattern at rest. However, during activity, there was a progressive distancing of the TW parameters from CM performance and an approximation of CW characteristics.
Studies in sports physiology demonstrate an average difference of 25%–35% VO2peak between CM and CW,4 data that were corroborated by our results. For the first time in literature, we present the absolute VO2peak value of TW, which was intermediate between the values of the CW and CM groups. Notably, relative VO2 peak differences between TW and CW were not present when adjusted for FFM or body weight.
To justify some of the results of the ergospirometry tests in the TW group, it is necessary to return to the basis of sport physiology and reinforce some elements. The %FM in CW is a factor that contributes to the reduction in VO2peak indices,7 as well as diminishing haemoglobin levels.8 Alterations in both of these parameters start in the first year after initiation of GAHT.8 However, it is important to emphasise that, according to the literature, CO is the main determining factor of VO2peak during strenuous exercise.9 10
Regarding VO2peak/FFM, in this study, we observed that the three groups were statistically equal in this regard, but the index of TW was slightly lower than that of the others (table 2).
For the first time, we described a direct correlation of the oxygen pulse with FFM/Hgt2 (figure 2) in TW, which should be investigated in depth by other studies to assess whether if it could be linked to haemodynamic changes and/or muscle mass alterations.
The expiratory volume (VE) values of the control groups in our series were compatible with those described in the literature.1 11 In this study, we described that TW without a history of pulmonary and/or cardiac diseases on prolonged use of hormone therapy have a VE (table 2) with an intermediate value between the values of CM and CW. One explanation for this different VE pattern identified in TW would be a possible reducing effect on the calibre of the airways by oestrogen, described as a potential bronchoconstrictor in the literature.9
Studies have shown that HRmax on exertion is the same for age-matched CW and CM,1 and the results are similar to those observed in our control groups. In the analysis of HR and %HRmax predicted for age, TW had higher values than individuals in the other groups (table 2).
The higher number of very active CW, despite the lack of significance, is a reasonable datapoint that could explain the lower maximum HR and %maximum HR predicted per age compared with those of TW (table 2).
Body composition
The SMM, FFM, Baumgartner Index and FFM/Hgt2 analyses showed that TW after GAHT presented an intermediate muscle mass value between those of CW and CM. Thus, long-term oestrogen exposure and testosterone suppression were not enough to completely shift BC of TW to the female pattern, despite their direct and indirect effects on fat and lean mass.11 12
Increased body weight among TW after starting GAHT is often reported as an adverse effect.8 The increases in gross weight, FM and %FM as well as the decrease in SMM among TW on oestrogen therapy alone or in association with antiandrogens have been described in several studies in the literature. However, the majority of these data were collected after only 12–24 months of hormone therapy.13 14 Greater weight gain was observed with the use of a higher dose of oestrogen.14
Our results demonstrated that the mean HGS was greater in TW than in CW, which was also observed in other data that studied the first year of hormone therapy.15
Generally, the scores of the strength ratio based on body mass (weight) or FFM considerably reduce (or even eliminate) important absolute differences in strength between the sexes,16 which was seen in our control groups. Nonetheless, TW showed a lower index than the other subjects, which was statistically significant in the comparison with CM. This finding suggests that TW can produce less force per muscle area.
The median age reported by TW for the initiation of hormone therapy was 17 (range 12–35) years (online supplemental table 1). These data have some limitations, since the medications and doses used, as well as the regularity and periods of cessation of hormonal use, are recall data and are often inaccurate. None of the subjects had received GnRH analogues or supervised therapy at that stage of life. However, on physical examination, these individuals presented a set of clinical signs that indicated the effects of pubertal androgens (adult penile length and male patterns of body and facial hair) prior to the introduction and regular use of supervised female hormone therapy.
Despite the known limitations of cross-sectional studies, these data are useful for establishing preliminary evidence and planning a future advanced study. Larger study is needed, ideally with multiple time points, for more definitive results. This study also did not examine athletes, and thus our findings may not be applicable to populations that engage in regular intensive exercise.
Conclusion
In this small cohort of non-athlete TW, who were previously exposed to male pubertal development and underwent long-term oestrogen therapy, we identified higher absolute grip strength and VO2 peak levels than in non-athlete CW, but these same parameters were lower compared with non-athlete CM. However, when adjusting for FFM, there were no differences in relative VO2 peak or strength between TW and CW.
These findings add new insights to the sparse information available on a highly controversial topic about the participation of TW in physical activities. Future studies involving transgender athletes that account for and quantify variable exposure times to pubertal development and assess muscle cell metabolism are needed to elucidate the effects of long-term GAHT on TW sports performance.
Data availability statement
All data relevant to the study are included in the article or uploaded as online supplemental information. Not applicable.
Ethics statements
Patient consent for publication
Ethics approval
This study was approved by the Ethical Committee of Clinics Hospital of the Medical School of the University of São Paulo (CH-MSUSP). Written informed consent was obtained from all patients (CAAE 17138719.0.0000.0068).
Acknowledgments
The authors are grateful to the Gender Dysphoria Unit of the Division of Endocrinology of Hospital de Clínicas da Faculdade de Medicina da Universidade de São Paulo (HCFMUSP), Laboratório de Hormônios LIM42 do HCFMUSP and Instituto do Coração (InCor) do HCFMUSP. We are grateful to biorender.com, the instrument we used to create figure 3.
Supplementary materials
Supplementary Data
This web only file has been produced by the BMJ Publishing Group from an electronic file supplied by the author(s) and has not been edited for content.
Supplementary Data
This web only file has been produced by the BMJ Publishing Group from an electronic file supplied by the author(s) and has not been edited for content.
Footnotes
Correction notice This article was corrected online only to provide additional clarity and balance to the presentation of results.
Contributors Study conception and design: LAMA and SD. Data acquisition and analysis: LAMA, MRS, FRS, LMS and M-JNNA. Manuscript drafting: LAMA and SD. Critical revision: SD, EMFC and BBM. Guarantor: LAMA.
Funding This research was supported by grants from the Coordenação de Aperfeiçoamento de Pessoal de Nível Superior (CAPES/PNPD; institutional fellowship Grant 88887.362860/2019-00 to LAMA), and by Conselho Nacional de Desenvolvimento Científico e Tecnológico (CNPq) Grants 308873/2018-1 (to SD).
Competing interests None declared.
Patient and public involvement Patients and/or the public were not involved in the design, or conduct, or reporting, or dissemination plans of this research.
Provenance and peer review Not commissioned; externally peer reviewed.
Supplemental material This content has been supplied by the author(s). It has not been vetted by BMJ Publishing Group Limited (BMJ) and may not have been peer-reviewed. Any opinions or recommendations discussed are solely those of the author(s) and are not endorsed by BMJ. BMJ disclaims all liability and responsibility arising from any reliance placed on the content. Where the content includes any translated material, BMJ does not warrant the accuracy and reliability of the translations (including but not limited to local regulations, clinical guidelines, terminology, drug names and drug dosages), and is not responsible for any error and/or omissions arising from translation and adaptation or otherwise.