Article Text

Abstract
Background We evaluated the lower limb status of athletes after anterior cruciate ligament reconstruction (ACLR) during the propulsion and landing phases of a single leg hop for distance (SLHD) task after they had been cleared to return to sport. We wanted to evaluate the biomechanical components of the involved (operated) and uninvolved legs of athletes with ACLR and compare these legs with those of uninjured athletes (controls).
Methods We captured standard video-based three-dimensional motion and electromyography (EMG) in 26 athletes after ACLR and 23 healthy controls during SLHD and calculated lower limb and trunk kinematics. We calculated lower limb joint moments and work using inverse dynamics and computed lower limb muscle forces using an EMG-constrained musculoskeletal modelling approach. Between-limb (within ACLR athletes) and between-group differences (between ACLR athletes and controls) were evaluated using paired and independent sample t-tests, respectively.
Results Significant differences in kinematics (effect sizes ranging from 0.42 to 1.56), moments (0.39 to 1.08), and joint work contribution (0.55 to 1.04) were seen between the involved and uninvolved legs, as well as between groups. Athletes after ACLR achieved a 97%±4% limb symmetry index in hop distance but the symmetry in work done by the knee during propulsion was only 69%. During landing, the involved knee absorbed less work than the uninvolved, while the uninvolved knee absorbed more work than the control group. Athletes after ACLR compensated for lower knee work with greater hip work contribution and by landing with more hip flexion, anterior pelvis tilt, and trunk flexion.
Conclusion Symmetry in performance on a SLHD test does not ensure symmetry in lower limb biomechanics. The distance hopped is a poor measure of knee function, and largely reflects hip and ankle function. Male athletes after ACLR selectively unload the involved limb but outperform controls on the uninvolved knee.
- ACL
- biomechanics
- sporting injuries
- knee injuries
- injury prevention
Data availability statement
Data are available on reasonable request. All publicly available data are included in the article or uploaded as online supplemental information.
Statistics from Altmetric.com
Introduction
Functional hop testing is traditionally used to determine readiness to return to sport (RTS) after anterior cruciate ligament reconstruction (ACLR).1 2 Typically, functional symmetry between legs is assessed with a hop test battery.3 4 The primary hop tests are in forward direction and the outcome of interest is distance in three of them—single hop, triple hop and cross-over hop for distance.5 With these tests, Limb Symmetry Index (LSI) of >90% in distance hopped is recommended as a cut-off point for safe RTS.6 The use of >90% LSI thresholds for functional hop tests has previously been questioned because of the potential risk of masking information about movement deficits and different strategies employed.7 8
Despite the advances in ACLR techniques and the use of criteria to RTS, graft failure and contralateral ACL injury risk on returning to sport are reported as 9%–19% and 18%–22%, respectively.9–11 In addition, more than a third of individuals after ACLR are unable to return to pre-injury levels of activity,12 justifying the high burden of an ACL injury.13 More recent evidence indicates that re-injury rates can be reduced by 50% for every month RTS is delayed up to 9 months, with no further reductions in risk shown after this point.3 After ligamentisation, it can be assumed that the reconstructed ACL has sufficient integrity to cope with sporting demands. The strength of the ACL in the uninjured leg should similarly be capable of withstanding normal sporting loads. These high failure rates therefore suggest that these patients experience abnormally high, potentially injurious loads in the previously uninjured leg which eventually causes injury.
The single leg hop for distance (SLHD) is most frequently reported14 and has been argued to be the only ‘clinician-friendly’ test able to evaluate knee function after ACLR.15 During a SLHD test, despite achieving symmetry in hop distance performance, athletes after ACLR still present between-limb kinematic and kinetic asymmetries,16 which might explain the unacceptably high rate of secondary injuries after RTS. Distance hopped during a performance test, such as the SLHD, indirectly assesses the total work done by the athlete’s lower leg kinetic chain, specifically the hip, knee and ankle joints during the propulsion phase.17 The work done during the propulsion phase of the hop then needs to be absorbed by the same limb during the landing phase. Examining the work during propulsion and landing, as well as the contribution of the different joints may reveal motor strategies associated with aberrantly high, potentially injurious, loads. The relative contributions of each part of the kinetic chain likely vary depending on the individual’s motor strategy. Protectively off-loading one joint might result in higher compensatory loading at another.
For all the above-stated reasons, an in-depth biomechanical analysis of the movement quality during the SLHD is imperative to conclude on its suitability to identify movement deficits or compensatory strategies after ACLR. Accordingly, we sought to describe in depth the biomechanical performance (kinematics, kinetics, work, and individual muscle forces) of athletes at the time they had met all criteria for RTS and compare with healthy controls during the propulsion and landing phases of the SLHD. The objective of this study was to evaluate biomechanical components during the propulsion and landing phases of the SLHD test in athletes with ACLR who had passed criteria for RTS, compared with contralateral knees and uninjured athletes.
Methods
Study design and setting
This laboratory study involved a case–control comparative analysis of an ACLR and a healthy cohort. All participants provided informed consent.
Participants, inclusion and exclusion criteria
We included 49 male participants in this study, 26 eligible patients after primary ACLR and 23 control subjects (figure 1, table 1). Patients with ACLR were enrolled after completion of a standardised rehabilitation protocol in our hospital and after receiving clearance to RTS. The RTS process employs a shared decision making strategy18 which includes consideration of key RTS criteria including (1) clearance by both their surgeon and physiotherapist, (2) completion of a sports specific on-field rehabilitation programme, (3) quadriceps strength LSI>90%, and (4) hop test battery LSI>90%0.4 ACLR individuals were athletes (preinjury Tegner score ≥7) aged between 18 and 35 years with a complete, unilateral ACL injury, either with an autologous ipsilateral bone-patellar-tendon-bone or a hamstrings graft (semitendinosus and gracilis) as clinically decided by the treating surgeon and athlete. Subjects with concomitant meniscal injury that did not significantly impede the rehabilitation course were also included in the study. Participants were excluded if they had concomitant grade III knee ligament injury (other than ACL), full thickness articular cartilage lesion, history of other lower extremity surgery (in either leg), back pain or lower extremity injury (other than primary ACL) in the prior 3 months. Twenty-three male control participants were also recruited by contacting healthcare providers and sports club doctors. Inclusion criteria were an age of 18–35 years, Tegner score ≥7, participation in level I or II sports three times a week or more, and no history of musculoskeletal injury of the lower limb 3 months prior to testing.
Participants information
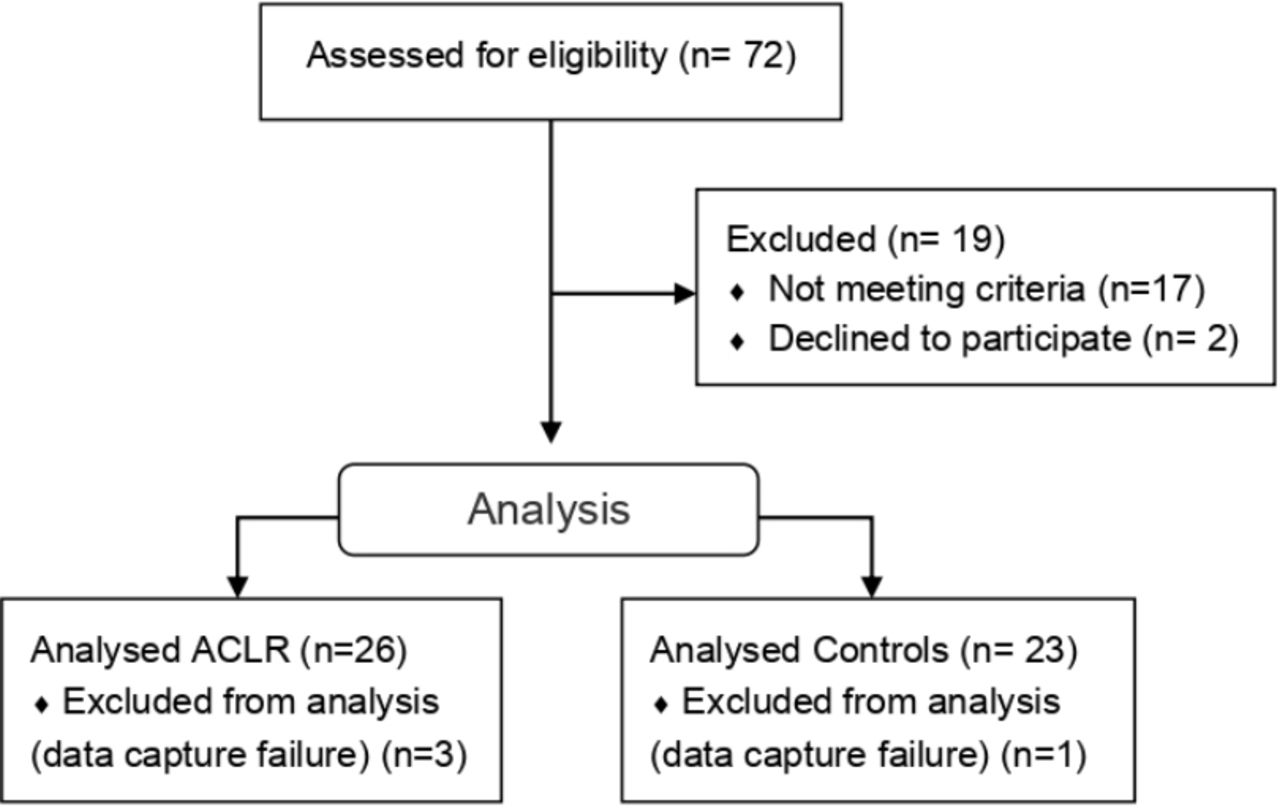
Study flow diagram. ACLR, anterior cruciate ligament reconstruction.
Equipment, participant preparation and marker set
Forty-two reflective markers were placed according to a full-body Plug-in-Gait marker-set, extended with additional anatomical markers on the sacrum, medial knee and medial ankle.19 Three marker clusters replaced the single maker laterally on each thigh and shank.20 The markers’ motion was captured with a 14-camera motion capture system (Vicon, Oxford, UK, 250 Hz). Ground reaction forces (GRFs) were collected synchronously with marker trajectories using five ground-embedded force plates (Kistler, Switzerland, 1000 Hz). Electromyographic (EMG) activity was collected simultaneously (Delsys Myomonitor IV, USA, 2000Hz) from the vastus lateralis and medialis, rectus femoris, biceps femoris, semitendinosus, medial and lateral gastrocnemius, and tensor fasciae latae (TFL).21
Experimental setup, procedure and testing
All participants were evaluated at the same location by the same examiner and wore athletic shorts and standard shoes. They performed a 7 min warm up session including running, side running, deep squats and double leg jumps. Then they performed a series of maximal voluntary isometric contractions to obtain maximum EMG values for each measured muscle. The first MVIC was performed to familiarise the participant with the procedure. The MVIC was assessed for TFL in standing, for quadriceps in a sitting position (60° of knee flexion), for hamstrings in prone position (knee flexion at 30°) and for gastrocnemius in standing. Each subject performed two maximum effort isometric contractions of each muscle group, where each lasted 5 s with 30 s rest between each trial.22 23 Test limb order was randomised using a coin toss.
Subsequently, participants practised SLHD until they felt comfortable, while verbal feedback on their performance was provided. For the execution of SLHD, participants stood on a force plate, placed their hands over their hips and started from an upright single leg standing position before countermoving to a self-selected depth and then jumped horizontally as far as possible, landing on the same leg. Data were collected bilaterally during four successful trials. A successful trial required participants to hold the final landing for at least 2 s. Test limb order was also randomised. Limb dominance was determined by asking the participants with which limb they would prefer to kick a ball.24
Data processing
Data were processed in Visual 3D (C-Motion, Germantown, MD). Marker trajectories and GRFs were low-pass filtered using a zero-lag, fourth order, Butterworth filter with the same 15 Hz cut-off frequency. Propulsion phase was defined as 0.4 s prior to take off until take off—to include hip concentric phase which occurs before peak knee flexion, and landing phase from initial contact to peak knee flexion.
Joint angles were calculated using a Visual 3D hybrid model with a Cardan X-Y-Z (mediolateral, anteroposterior, vertical) rotation sequence.25 Ankle, hip, and knee joint angles were defined as the angle between the distal and the proximal segment. Pelvis was defined using the Coda model.26 Pelvis and trunk segment angles were determined with respect to the global coordinate system. Joint internal moments were resolved in the proximal coordinate system. We calculated kinematics for trunk and pelvis, and also kinematics and kinetics for hip, knee, and ankle joints, bilaterally. The variables of interest were: peak joint angles, joint angles at toe-off and initial contact, peak internal joint moments. For lower limb joints, work generation and absorption were determined as the time integral of the net positive and negative joint power, respectively. Joint power was calculated by using all three components. The joint contribution was then determined as a percentage contribution to the summed work of all three lower limb joints during the propulsion and landing phases. Work and joint moments were normalised to body mass. LSI was determined as the percentage of the involved limb divided by the uninvolved limb.5 14 All variables were extracted for the propulsion and landing phase separately.
Muscle force calculation
We used a generic musculoskeletal model for deep squatting27 and followed a standard musculoskeletal modelling workflow implemented in Opensim V.3.328 to calculate muscle forces. We included knee varus, valgus, and knee internal–external rotation degree of freedom, and we defined the major knee ligaments following Xu et al,29 using host mesh fitting for registering origin and insertion points between models. The maximum isometric force of each muscle was multiplied by 3 to allow generation of high forces required to perform the dynamic movements.30 31 The foot was modelled as one rigid segment. An EMG-constrained static optimisation approach that omitted the force-length and force-velocity behavior32 was used to determine the muscle forces balancing the external joint moments. For this, EMG signals were first processed with a 20–400 Hz bandpass fourth order Butterworth filter, then rectified and filtered with a 10 Hz low-pass second order Butterworth filter, and finally, normalised to the peak processed EMG value measured for the subject across all activities performed during data collection, which included maximum voluntary contractions, running, jumping, cutting, and hopping for maximum distance.33 To account for participant-specific mass, muscle forces were normalised to body weight. Finally, we calculated the contribution of the individual muscle force impulse during the SLHD tests as a percentage of the overall muscle force impulse (30 in total for each leg), for landing and propulsion phase separately.
Power analysis
As there are no data comparing work done for ACLR injured, uninjured and comparison groups we were unable to conduct an a priori power analysis to determine our sample size. Based on previous research examining biomechanics of similar cohorts,34 35 we arbitrarily planned for a sample size of 25 per group.
Statistical analysis
Descriptive statistics were used to summarise the characteristics of the participants and measurements, using the average of the four trials collected. Normality of distribution of data was checked using Shapiro-Wilk normality tests.36 There were no outliers in the data, as assessed by inspection of a boxplot and there was homogeneity of variances, as assessed by Levene’s test for equality of variances.37 Preliminary between-limb analyses of the control group for all parameters of interest indicated no significant differences, therefore, dominant and non-dominant limbs were combined and included independently for subsequent comparisons with the injured cohort. In order to ensure this approach was valid, the analysis was rerun using only one (randomly selected) control limb from each control subject with no meaningful change observed in outcomes (online supplemental file 1). We used paired-samples t-tests for between-limb analyses and independent t-tests for between-group analyses. Bonferroni adjustment of p values was performed to adjust for the post hoc comparisons (p<0.017). Non-normally distributed data were compared using non-parametric tests; Wilcoxon for between limbs38 and Mann-Whitney for between groups39 comparisons. Effect sizes were calculated using the pooled40 (between-limb) and the pooled weighted41 (between-group) SD. Values of 0.2, 0.5 and 0.8 were used as the lower thresholds for small, moderate, and large effects, respectively.40 All analyses were performed using SPSS V.26, (IBM).
Supplemental material
Results
Participants were tested within 2 weeks of clearance to RTS at 9.5±2.7 months following surgery. The ACLR group achieved a 97%±4% LSI and the control group 100%±5% LSI in hop distance during the SLHD. Hop distance normalised to leg length (ASIS to lateral malleolus) was 1.76±0.14, 1.82±0.16 and 1.79±0.16 for the involved limb, uninvolved limb and control group, respectively. Kinematics, kinetics, and joint contribution to total work done results, for athletes after ACLR and the control group are presented in table 2.
Comparison between groups during the propulsive and landing phases of the single leg hop for distance
Propulsion phase
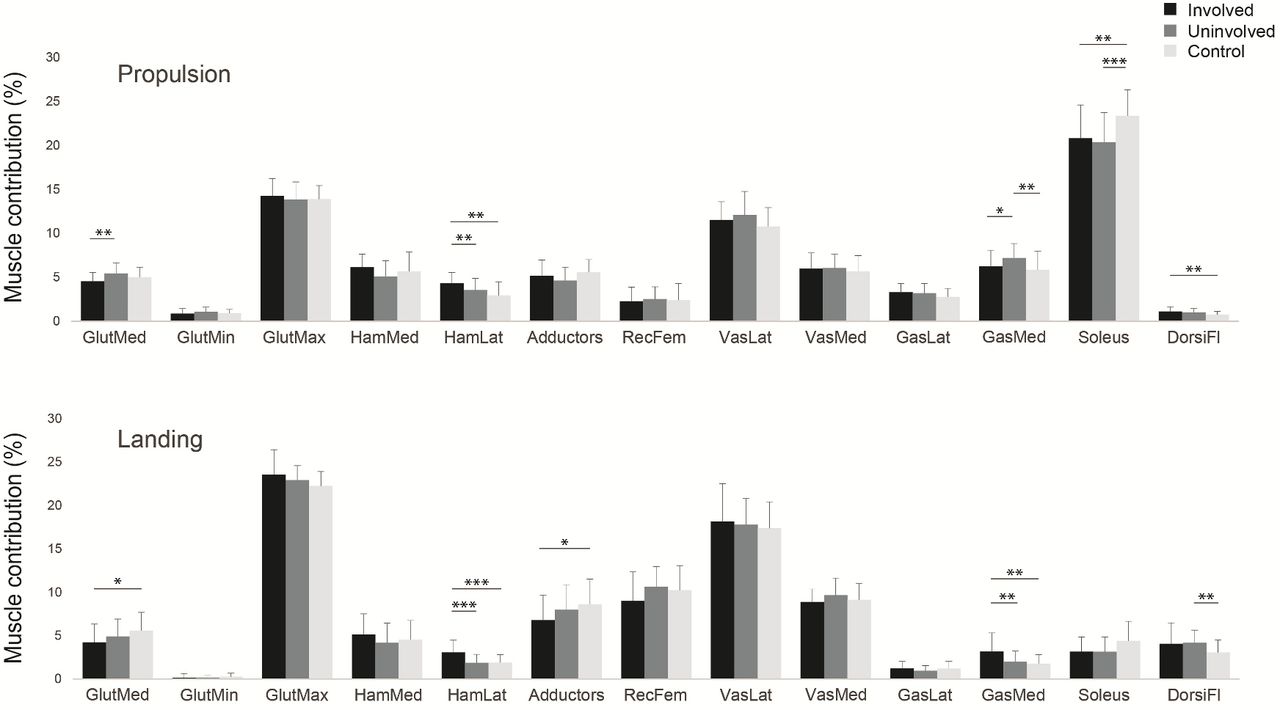
During propulsion, the involved knee generated significantly less work than the uninvolved (d=1.08, p<0.001) and the control group (d=0.63, p=0.010) (figure 2). In terms of joint contribution to the total work, the involved had less contribution from the knee and significantly more from the hip than the uninvolved limb (figure 3). In addition, more hip and knee flexion in the involved than the uninvolved limb and controls was seen at take-off. Regarding muscle force distribution, the involved limb had a greater contribution of the lateral hamstrings (d=0.93, p=0.001) and soleus (d=0.76, p=0.003) than the controls and lower gluteus medius contribution (d=0.81, p=0.002) than the uninvolved limb (figure 4).

Hip, knee, and ankle work during propulsion and landing of the single hop for distance task for the involved limb, the uninvolved limb and controls. Violin plots represent the smoothed distribution of the data. Box plots represent the distribution of the work values for each joint. Work is positive during propulsion and higher positive values represent more work generation. Work is negative during landing, so higher negative values represent more work absorption. *Significant difference involved-uninvolved, †Significant difference involved-controls, ‡Significant difference uninvolved-controls.

Average percentage work contributions from the hip, knee, and ankle joints during the propulsion and landing phases of the single leg hop for distance. During propulsion, hip and ankle predominantly drive the movement, while knee joint has only a small contribution. During landing the knee joint is the main work absorber performing 65% of the total work. The involved knee has less contribution in both phases, with compensatory increases at the hip joint.
Individual muscle forces impulse contribution for the involved leg (black), the uninvolved (grey) and the controls (white), during the propulsive (top) and landing phases (bottom) of the single leg hop for distance. *P<0.05, **p<0.01, ***p<0.001.From left to right: gluteus medius, gluteus minimus, gluteus maximus, medial hamstrings, lateral hamstrings, hip adductors, rectus femoris, vastus lateralis, vastus medialis, gastrocnemius lateral head, gastrocnemius medial head, soleus, dorsiflexors.
Landing phase
During landing, the uninvolved knee had more work done than the involved knee (d=1.12, p<0.001) and the control group (d=0.76, p=0.003), whereas the involved ankle did less work than both the uninvolved (d=0.96, p=0.007) and the controls (d=0.77, p=0.001) (figure 2). The involved limb presented with more hip flexion and ankle plantarflexion compared with the uninvolved and controls at initial contact. Furthermore, the involved limb had higher peak hip flexion, peak pelvis anterior tilt and peak trunk flexion than the uninvolved and control subjects and lower peak knee flexion than the uninvolved limb. Regarding muscle forces, the involved limb had greater contribution of lateral hamstrings and medial gastrocnemius than the uninvolved (d=1.02, p<0.001 and d=0.68, p=0.007, respectively) and controls (d=1.07, p<0.001 and d=0.94, p=0.004, respectively), and less contribution of gluteus medius and adductors than controls (figure 4).
Discussion
Despite passing strict testing criteria to RTS, differences in biomechanics were identified between the injured and uninjured limbs of athletes after ACLR, as well as with the healthy comparison group.
Hop distance as a metric of knee function needs reappraisal
Athletes after ACLR were almost symmetrical in terms of hop distance (97%), but they still exhibited moderate to large differences in knee function. The ACLR group achieved 69% symmetry in knee work done during propulsion. This relatively large between-leg difference is more easily understood when we recognise that the knee joint contributes little (about 12%) to the propulsive phase of a SLHD. With 88% of the distance hopped being determined by the hip and ankle joint, deficits at the knee joint are easily missed. Simply put: the distance hopped is a poor measure of knee joint function, and largely reflects hip and ankle function (figure 3). Consequently, it may not be the appropriate metric to use for testing an athlete with a knee injury and its relevance is questionable.
Our data supplements previous arguments that questioned SLHD as a metric of knee function in ACL injured athletes. While hop distance has been correlated with self-reported measures of knee function42 and fear avoidance,43 there are more appropriate tools to measure these patient-reported outcomes.44 45 Clinicians have used hop tests to estimate lower limb muscular strength,46 although they are seen to have a low correlation with quadriceps strength: aspects of knee strength can explain 13%–25% of the variance of horizontal hop performance.47–49 Symmetry in hop distance is achieved earlier during rehabilitation than symmetry in isokinetic knee strength,14 47 suggesting that emphasising hop distance LSI risks overestimating rehabilitation status.50 Furthermore, hop tests are still being used as criteria to RTS, not due to specificity, but mainly because passing a battery of tests is associated with lower risk of reinjury.3 4 However, a more detailed analysis of the data indicates that only strength measures were associated with reinjury rates and not the hop tests3 4 and its predictive validity cannot be established based on available literature.51 In accordance with our results, the use of >90% LSI thresholds for functional hop tests has previously been questioned because of the potential risk of masking information about movement deficits and different strategies employed.7 8 Our results add that the knee’s contribution is limited in achieving the outcome parameter (hop distance) which is largely a function of the hip and ankle joints.
Differences in loading
During the landing phase, knee joint work and work contribution (%) were not different between the involved knee and the control group; however, knee work was significantly larger in the uninvolved knee compared with the involved leg and control group. This finding is in agreement with previous research showing higher loading of the uninvolved healthy limb compared with a control group for performance and knee strength,52 as well as for knee extension moments53 in individuals after ACLR at the time of RTS. Similar findings are reported also in other tasks including drop vertical jump,54 gait and stair ambulation,55 in both male and female populations,52–55 indicating that task or gender might not have an influence. A possible explanation might be the comprehensive rehabilitation protocol employed (that addressed loading of not only the involved limb but also the uninvolved limb), improved the deconditioning commonly seen in individuals after ACLR.7 56 However, caution is needed with an adoption of a movement pattern that shifts the mechanical demands away from the reconstructed knee during bilateral tasks,57 and towards overuse of the contralateral limb during the long rehabilitation period as a compensatory and protective mechanism.55 This maladaptive asymmetry might place the intact contralateral leg at an increased risk for injury compared with the involved leg and may offer a possible explanation for contralateral ACL injuries58 and for the higher post-traumatic osteoarthritis prevalence in the contralateral knee.59
Whole-body adaptations
Athletes after ACLR deployed a whole-body adaptation strategy to account for the between limb difference in knee function. During the landing phase, the knee and ankle contributed less to the total work on the involved leg, with more work observed at the hip. The total energy absorption was less in the involved leg than the controls, by adopting a different upper body compensatory mechanism to reduce lower limb loading. Individuals landed on the involved limb with more hip flexion, anterior pelvis tilt, and trunk flexion maintaining a more extended knee position—a mechanism commonly seen in individuals after ACLR to reduce the knee load.50 53 At initial contact, individuals preferred to land with a forefoot strike with their involved leg instead of using a heel strike pattern, probably as an additional technique to reduce knee loading.60 61 There are conflicting findings in the literature for the intralimb adaptations. Some patients used their hips as a compensatory strategy,35 while others offloaded the knee compensating at the ankle.34 35
Differences between limbs were also found for muscle function and percentage contributions. The ACLR group had greater hamstrings contribution on the involved leg, acting as a protective mechanism. Hamstrings have a posterior line of pull in a flexed knee and might thus act as an ACL agonist, counteracting high anterior tibial shear forces.62 63
Clinical implications
Hop distance symmetry is commonly used as a criterion for an athlete to RTS after ACLR. The results of this study indicate that during a SLHD, symmetry in hop distance does not ensure symmetry in lower limb biomechanical parameters, especially for the knee joint. Future research might explore if these results can be generalised to the other common tests like the triple hop64 and the cross-over hop for distance and whether they measure similar constructs. Measuring hop distance, or its symmetry, risks overestimating rehabilitation status in terms of the knee joint, may lead to erroneous progression, and offers little additional clinical information in the RTS-readiness decision. Conversely, the SLHD task, and specifically the landing phase, can offer valuable information on the status of the knee joint, but requires three-dimensional biomechanical analysis—an apparatus not frequently available in clinical setting. Consequently, future research should focus on identifying proxy variables of these loading measures, perhaps from wearable technology or other approaches, which would allow monitoring these parameters in a clinical setting. In the absence of this technology, we suggest tasks other than SLHD, and variables other than hop distance may be more appropriate to capture the differences between legs and offer a more accurate estimation of the status of the knee.
Methodological considerations
The recruitment of only males from a single site suggests interpretation of these results with caution in females and other populations. Importantly, we note that there were baseline differences in age (5 years older) and activity level (1.3 lower on the Tegner scale) for our control subjects compared with the professional athletes in the ACLR cohort. We did not adjust for these differences during the analyses and these findings should be extrapolated and generalised with caution until such confirmatory research has been done. We did not measure quadriceps strength in the control group. However, it is assumed that they were symmetrical (>90% LSI) for the quadriceps strength.65 Although musculoskeletal modelling allows for the prediction of in vivo muscle forces without invasive methods, it is not without limitations. Since measuring muscle forces in vivo during jumping is not feasible, we do not have a direct test for the accuracy of the computed muscle forces. By using EMG activation patterns to constrain the muscle force estimations, we limited the error in predicting the timing of activations. Additionally, we used a generic model and not a subject-specific modelling approach that incorporates each subject’s lower limb anatomy.
Conclusion
Symmetry in performance of single leg hop distance masks important deficits in knee joint work in male athletes after ACLR. Specifically, they appear to underload their reconstructed knee during landing (while compensating at their hip) and overload their uninjured knee compared with healthy controls.
What are the findings?
Hop distance may not be the appropriate metric to use for testing male athletes with a knee injury.
Male athletes after anterior cruciate ligament (ACL) reconstruction during landing underload their reconstructed knee by compensating mostly at their hip.
The tendency to overload the uninjured knee compared with healthy controls might explain the increased rates of contralateral injuries.
How might it impact on clinical practice in the future?
Our findings suggest that symmetry in hop distance may not mean knee function is also symmetrical. Thus, using hop distance as a discharge criterion in male athletes after ACL reconstruction may not be appropriate.
Data availability statement
Data are available on reasonable request. All publicly available data are included in the article or uploaded as online supplemental information.
Ethics statements
Patient consent for publication
Ethics approval
Ethics approval was granted from the Anti-Doping Lab Qatar Institutional Review Board (F2017000227).
Acknowledgments
The authors thank the physiotherapists (ACL Group) of Aspetar Rehabilitation Department for assisting with subjects’ recruitment.
References
Supplementary materials
Supplementary Data
This web only file has been produced by the BMJ Publishing Group from an electronic file supplied by the author(s) and has not been edited for content.
Supplementary Data
This web only file has been produced by the BMJ Publishing Group from an electronic file supplied by the author(s) and has not been edited for content.
Footnotes
Twitter @RoulaKotsifaki, @RodWhiteley, @SamVanRossom, @KorakakisV, @RoaldBahr, @vasilisbme, @PhilipGrahamSm2, @IJonkers
Correction notice This article has been corrected since it published Online First. Table 2 has been corrected.
Contributors AK, RW, SVR and IJ participated in the design and conception of the study. AK, VS and PG-S were responsible for data collection. AK, RW and VK performed the data analysis and table designs and all the authors contributed to the interpretation. AK drafted the manuscript and all the authors revised it critically and gave their approval of the final version.
Funding The authors have not declared a specific grant for this research from any funding agency in the public, commercial or not-for-profit sectors.
Competing interests None declared.
Provenance and peer review Not commissioned; externally peer reviewed.
Supplemental material This content has been supplied by the author(s). It has not been vetted by BMJ Publishing Group Limited (BMJ) and may not have been peer-reviewed. Any opinions or recommendations discussed are solely those of the author(s) and are not endorsed by BMJ. BMJ disclaims all liability and responsibility arising from any reliance placed on the content. Where the content includes any translated material, BMJ does not warrant the accuracy and reliability of the translations (including but not limited to local regulations, clinical guidelines, terminology, drug names and drug dosages), and is not responsible for any error and/or omissions arising from translation and adaptation or otherwise.