Article Text

Abstract
Objectives To describe and compare 20 m shuttle run test (20mSRT) performance among children and youth across 50 countries; to explore broad socioeconomic indicators that correlate with 20mSRT performance in children and youth across countries and to evaluate the utility of the 20mSRT as an international population health indicator for children and youth.
Methods A systematic review was undertaken to identify papers that explicitly reported descriptive 20mSRT (with 1-min stages) data on apparently healthy 9–17 year-olds. Descriptive data were standardised to running speed (km/h) at the last completed stage. Country-specific 20mSRT performance indices were calculated as population-weighted mean z-scores relative to all children of the same age and sex from all countries. Countries were categorised into developed and developing groups based on the Human Development Index, and a correlational analysis was performed to describe the association between country-specific performance indices and broad socioeconomic indicators using Spearman's rank correlation coefficient.
Results Performance indices were calculated for 50 countries using collated data on 1 142 026 children and youth aged 9–17 years. The best performing countries were from Africa and Central-Northern Europe. Countries from South America were consistently among the worst performing countries. Country-specific income inequality (Gini index) was a strong negative correlate of the performance index across all 50 countries.
Conclusions The pattern of variability in the performance index broadly supports the theory of a physical activity transition and income inequality as the strongest structural determinant of health in children and youth. This simple and cost-effective assessment would be a powerful tool for international population health surveillance.
- Endurance
- Children
- Adolescent
- Aerobic fitness
Statistics from Altmetric.com
Background
Cardiorespiratory endurance (CRE) is described as a trait that is partly determined by genetic factors1 and modifiable by physical activity.2 There is growing evidence of an inverse relationship between CRE and a variety of important health markers in children and youth.3–6 Being a trait, CRE is less labile than physical activity,7 and thus tracks moderately well from childhood to adulthood.8–10 In addition, longitudinal studies have identified a significant graded association between low CRE in late adolescence and an increase in the risk of cardiovascular disease11 and early death12 in adulthood. Taken together, these findings indicate that the population status of CRE in children and youth may help predict future non-communicable disease burden. As a result, there have been recent calls in North America,13 ,14 South America,15 Europe16 and Oceania17 to monitor CRE in children and youth through continuous surveillance efforts.
The 20 m shuttle run test (20mSRT)18 ,19 is considered the best and most popular field-based measurement of CRE in children and youth because of its low cost, simplicity and ability to test large groups of children simultaneously.20–22 In 9–17 years, it demonstrates moderate-to-high criterion-related validity, indicating that it is a good surrogate measure of maximal oxygen uptake,23 the underlying construct of CRE. Novel data standardisation techniques also allow for meaningful international comparisons of 20mSRT performance in youth.24 Recent studies have identified large variability in children's 20mSRT performance within and between countries,6 ,15 ,25–27 which may be associated with broad population-level socioeconomic, cultural and policy factors (henceforth referred to as socioeconomic indicators). Consequently, as a surveillance instrument, the 20mSRT could help identify populations with high CRE and provide insights into broad socioeconomic indicators that may inform intervention, programme and/or policy targets to help improve CRE in other populations, especially those with low CRE.
In 2006, Olds et al 27 published a seminal study describing the worldwide variability in 20mSRT performance in children and youth across 37 countries. That study represented an effort to describe and rank the international state of CRE in children and youth, serving as a comparison standard for countries. As a result, some countries were motivated to assess and verify their international 20mSRT performance rank28 and others to establish country-specific normative data to determine their international rank compared to the standard.17 ,29 However, since 2006 it is possible that the variability in 20mSRT performance has changed due to temporal trends in children's CRE that have been reported to differ in magnitude and direction at the country level.22 ,24 These findings support the need for a 10-year update of Olds et al's initial study.
Thus, the objectives of this paper were threefold: (1) to update, describe and compare the 20mSRT performance of children and youth across countries; (2) to explore broad, country-level, socioeconomic indicators that correlate with 20mSRT performance in children and youth and (3) to evaluate the utility of the 20mSRT as an international population health indicator for children and youth.
Methods
Data source
A systematic review of literature was conducted to locate studies that reported descriptive 20mSRT data on apparently healthy (free from known disease/injury) 9–17 year-olds. The search strategy for this study is reported in detail by Tomkinson et al.30 Briefly, researchers conducted a search of five databases, including MEDLINE (1946–2015), PsycINFO (1806–2014), EMBASE (1947–2014), SPORTDiscus (1949–2014) and Cochrane Central Register of Controlled Trials (2005–2014). The search strategy included the following terms: shuttle run*, OR beep test, OR multi-stage, OR aerobic, OR cardio*, OR endurance; with child*, adolescen*, pubescen* boy, girl, young and youth as search term modifiers. No search restriction was placed on language. Studies were excluded if they reported data on special interest groups (eg, elite athletes and mentally/physically disabled) or unhealthy/injured groups. Consequently, studies were included if participants were broadly representative of their source population and if descriptive data were provided for 20mSRT performance (using the 1-min stage protocol) at the sex by age by country level. The reference lists for all included studies were reviewed for additional manuscripts not identified through the database search. When needed, attempts were made to contact study authors to clarify study details, to request raw data and/or to ask if they knew of other relevant studies. In addition, the personal libraries of the study authors were reviewed for relevant studies.
Inclusion/exclusion
A total of 979 studies were identified as relevant. Of these, 802 studies were excluded for one or more of the following reasons: (1) an unknown version of the 20mSRT; (2) descriptive data were combined for girls and boys into a single group; (3) study participants were atypical of the general population (eg, elite athletes or physically delayed); (4) the study reported duplicate data already reported in another included study and (5) sample size at each sex by age by study group was <40 participants as the means and SDs for smaller samples were too labile. All 20mSRT performance data from the remaining 177 studies were extracted into Excel (Microsoft Office 2010, USA) using a standardised template (see online supplementary material 1 for a description of the studies).
Supplemental material
Standardisation of data and statistical analysis
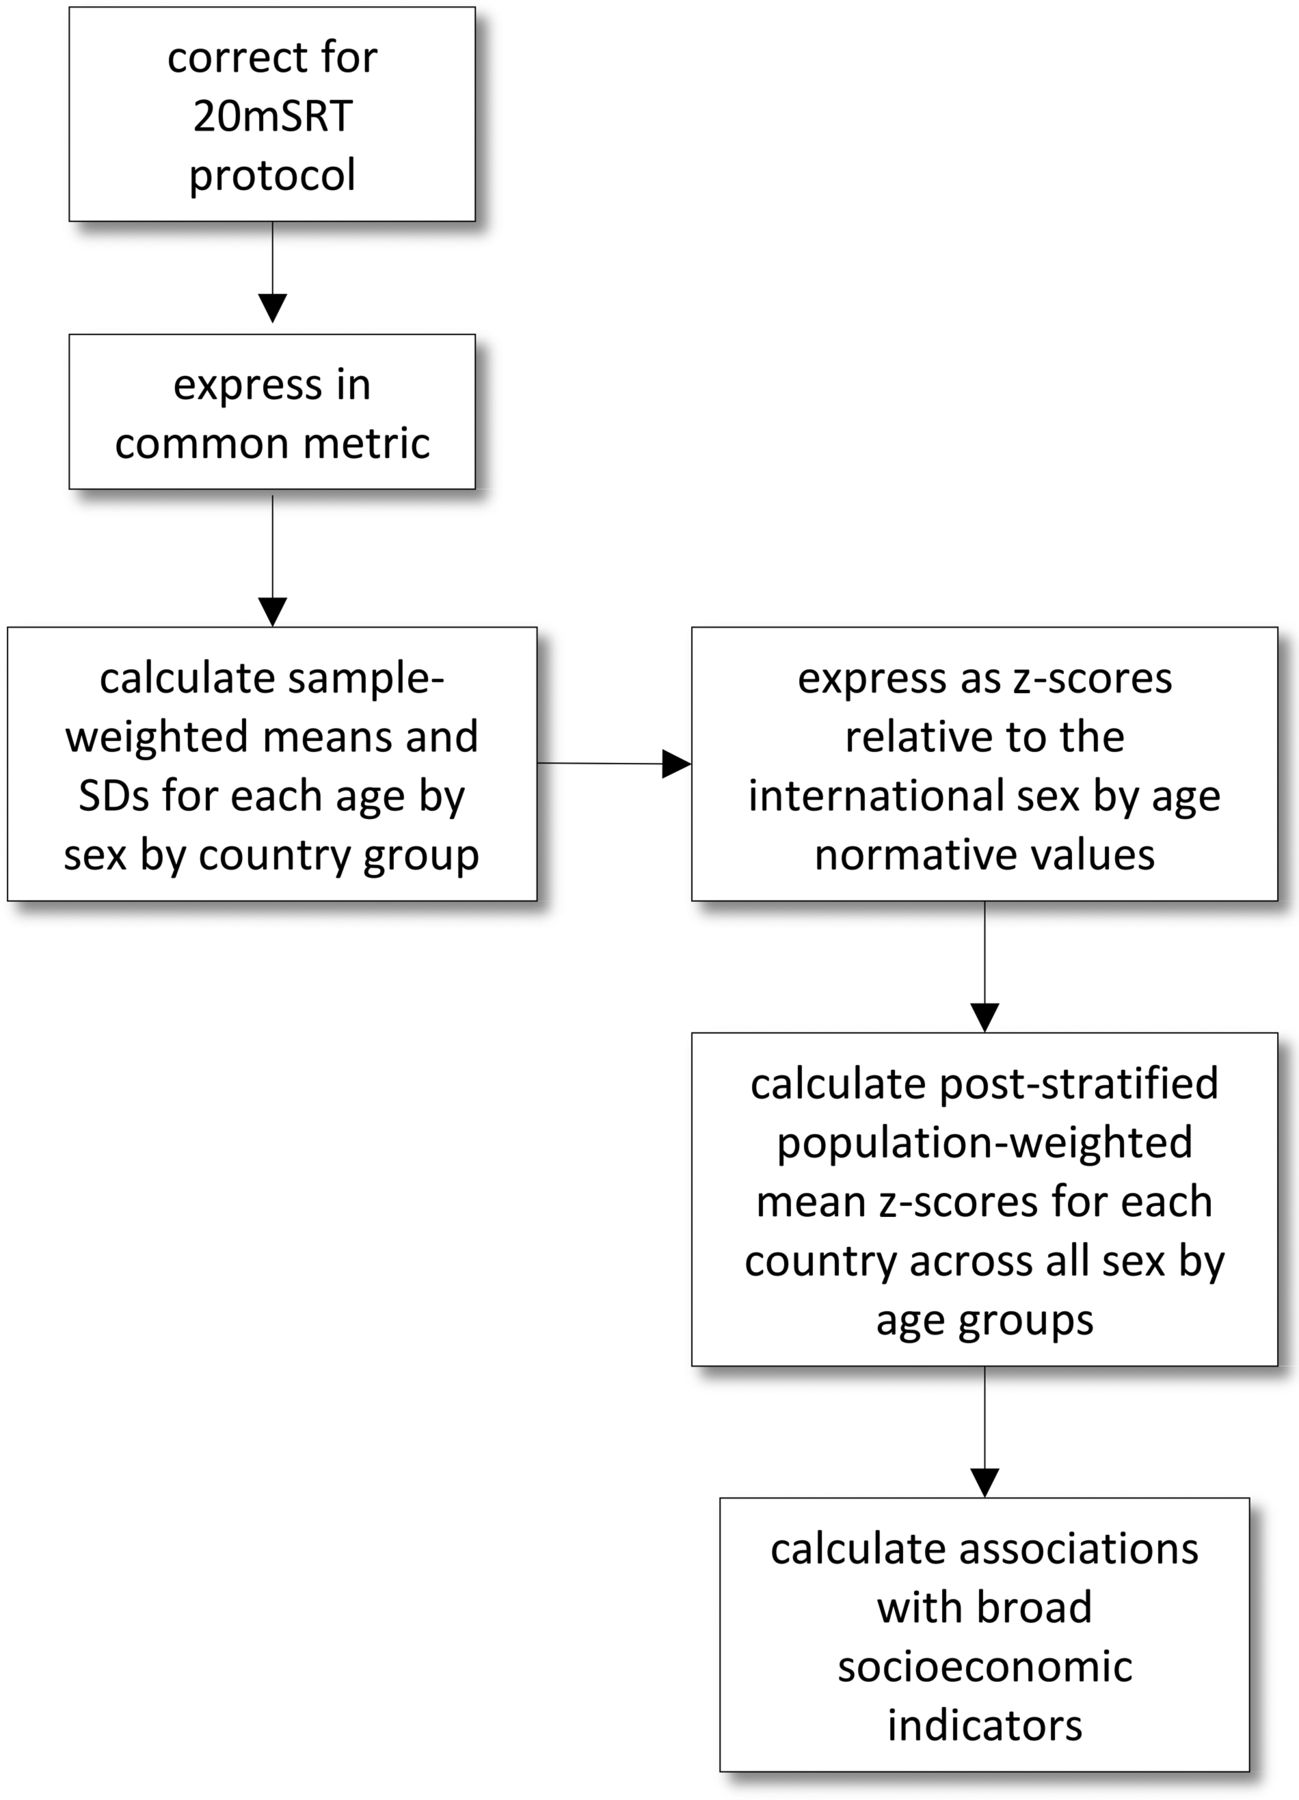
The goal of data standardisation was to express all 20mSRT performance scores as a common protocol and result metric to facilitate cross-country comparisons. Figure 1 describes the general methodological approach used in this study. In brief, three common protocol variants for the 20mSRT were identified,24 with all performances standardised to the Léger protocol.19 This protocol begins at a speed of 8.5 km/h for the first stage (min) and increases by 0.5 km/h every stage thereafter. Furthermore, 20mSRT performances were reported in one of the six different result metrics (speed at the last completed stage, completed stage or minutes, distance, completed laps within final stage, total laps or estimated  ) with all results standardised to running speed (km/h) at the last completed stage. Details on data standardisation procedures are described by Tomkinson et al.24 ,30

Flow chart describing the general methodological procedure for this study. All protocol results (Léger, Eurofit or Queen's University of Belfast) were corrected to reflect the Léger protocol. All results were then corrected to reflect speed (km/h) at the last completed stage as a common result metric. Next, sample-weighted mean 20mSRT performance score and SD were calculated for each sex by age by country group. Then z-scores were generated relative to the international norms for each sex by age by country group to calculate the mean country specific z-score, described as the ‘performance index.’ Each country specific performance index was corrected using a poststratified population-weighted technique. Finally, a correlation analysis took place to analyse associations between the performance index and broad socioeconomic indicators. 20mSRT, 20 m shuttle run test.
The main objective of this study was to compare 20mSRT performances across countries. To achieve this, sample-weighted mean and SD 20mSRT performance values were calculated for each sex by age by country group and used to calculate sex- by age- by country-specific mean z-scores using the international 20mSRT performance norms (table 1) reported by Tomkinson et al.30
 where
where  is the country sample-weighted mean sex- by age-specific performance score, µ is the international mean performance score for the given sex- by age-specific group and σ is the international SD for the given sex- by age-specific group (see table 1).
International 20mSRT norms for running speed (km/h) at the last completed stage30
Positive z-scores indicated that 20mSRT performances were better than the international mean and negative z-scores that 20mSRT performances were worse than the international mean. Population-weighted mean z-scores and corresponding 95% CIs were calculated for each country, across all sex by age groups for which data were available, using a poststratification population-weighting procedure described by Levy and Lemeshow.31 Population estimates standardised to the mean measurement year of 2000 were extracted from the United Nations World Population Prospective report, that's what we mean by mean measurement year.32 These population-weighted z-scores represented the country-specific ‘performance index’, that is, the overall standardised deviation of a country's children 20mSRT performance from the international age- and sex-specific means. The index served as a method to rank and compare the overall performance of each country.
The secondary objective was to explore correlates between the 20mSRT performance index and broad socioeconomic indicators. An internet search of publicly available databases was conducted to identify socioeconomic indicators that, based on the literature, would be meaningful to explore. In total, six indicators were identified (table 2), and data were extracted at the country level. The association between the 20mSRT performance index and each socioeconomic indicator was quantified using Spearman's rank correlation coefficient with the 95% confidence limits calculated using Fisher's z-transformation. Holm–Bonferroni sequential correction was used to adjust for α slippage.39 Correlations of 0.1, 0.3 and 0.5 were used as thresholds for weak, moderate and strong, respectively, with correlations <0.1 considered to be trivial.40 In addition, countries were grouped by the human development index (HDI) into developed (HDI of 0.741–0.943) and developing (HDI of 0.286–0.740) nations using the 2011 inequality-adjusted United Nations Human Development Report.36 The association between the 20mSRT performance index and each indicator was further explored by HDI status to identify potential interactions. Combined, the first two objectives of this study helped inform and evaluate the utility of the 20mSRT as an international population health indicator for children and youth.
Potential correlates of 20mSRT performance in children and youth
Results
Cross-country variability
Standardised 20mSRT performance indices are presented across 50 countries, representing 1 142 026 children and youth aged 9–17 years. The 50 countries represented six of the seven continents (North and South America, Europe, Africa, Asia and Oceania), and a wide range of HDI (0.400 (Côte d'Ivoire) to 0.943 (Norway)).36 The performance index values for each of the 50 countries are presented in table 3 along with their respective 95% CI and centile rank. Confidence in our performance index scores varied substantially between countries based on country-specific sample size. Performance indices ranged from +1.85 for Tanzania (the best performing country) to −0.96 for Mexico (the worst performing country). Countries from Central and Northern Europe and Africa accounted for 9 of the top 10 performing countries. South American countries were consistently among the worst performing countries, with all countries except Colombia and Suriname, falling below the international mean (mean±95% CI: centile 40±11; z-score −0.27±0.32). Collectively, Africa (mean±95% CI: centile 68±8; z-score 0.53±0.32) was typically the best performing continent, closely beating Europe (mean±95% CI: centile 63±7; zscore 0.37±0.21). However, when dividing Europe into two segments, similar to that performed by Ortega et al,193 a performance gradient existed where Central-Northern European countries (mean±95% CI: centile 66±7; z-score 0.48±0.23) consistently outperformed countries from Southern Europe (mean±95% CI: centile 45±7; z-score −0.12±0.19).
Descriptive data for countries presented in rank order of by 2016 performance index
Correlates of 20mSRT performance
The Gini index was a moderate to strong negative correlate of 20mSRT performance, regardless of country development status (table 4). Other correlations across the sample ranged from trivial to moderate. Mean climate was a strong positive correlate for only developed countries. In contrast, HDI was a strong negative correlate for only developing countries. Furthermore, a potential interaction existed where some socioeconomic indicators were positively correlated with 20mSRT performance in developed countries, but negatively associated in developing countries.
Spearman's rank correlation coefficients (95% CI) between 20mSRT performance index and socioeconomic indicators
Discussion
This study represents the largest international surveillance effort to describe the status of CRE in children and youth by presenting standardised 20mSRT performance indices across 50 countries. The aim of the present study was to update, describe and compare 20mSRT performance in children and youth across countries; to explore associations between 20mSRT performance and broad country-level socioeconomic indicators and to assess the utility of the 20mSRT as an international population health indicator for children and youth.
International variability in 20mSRT performance
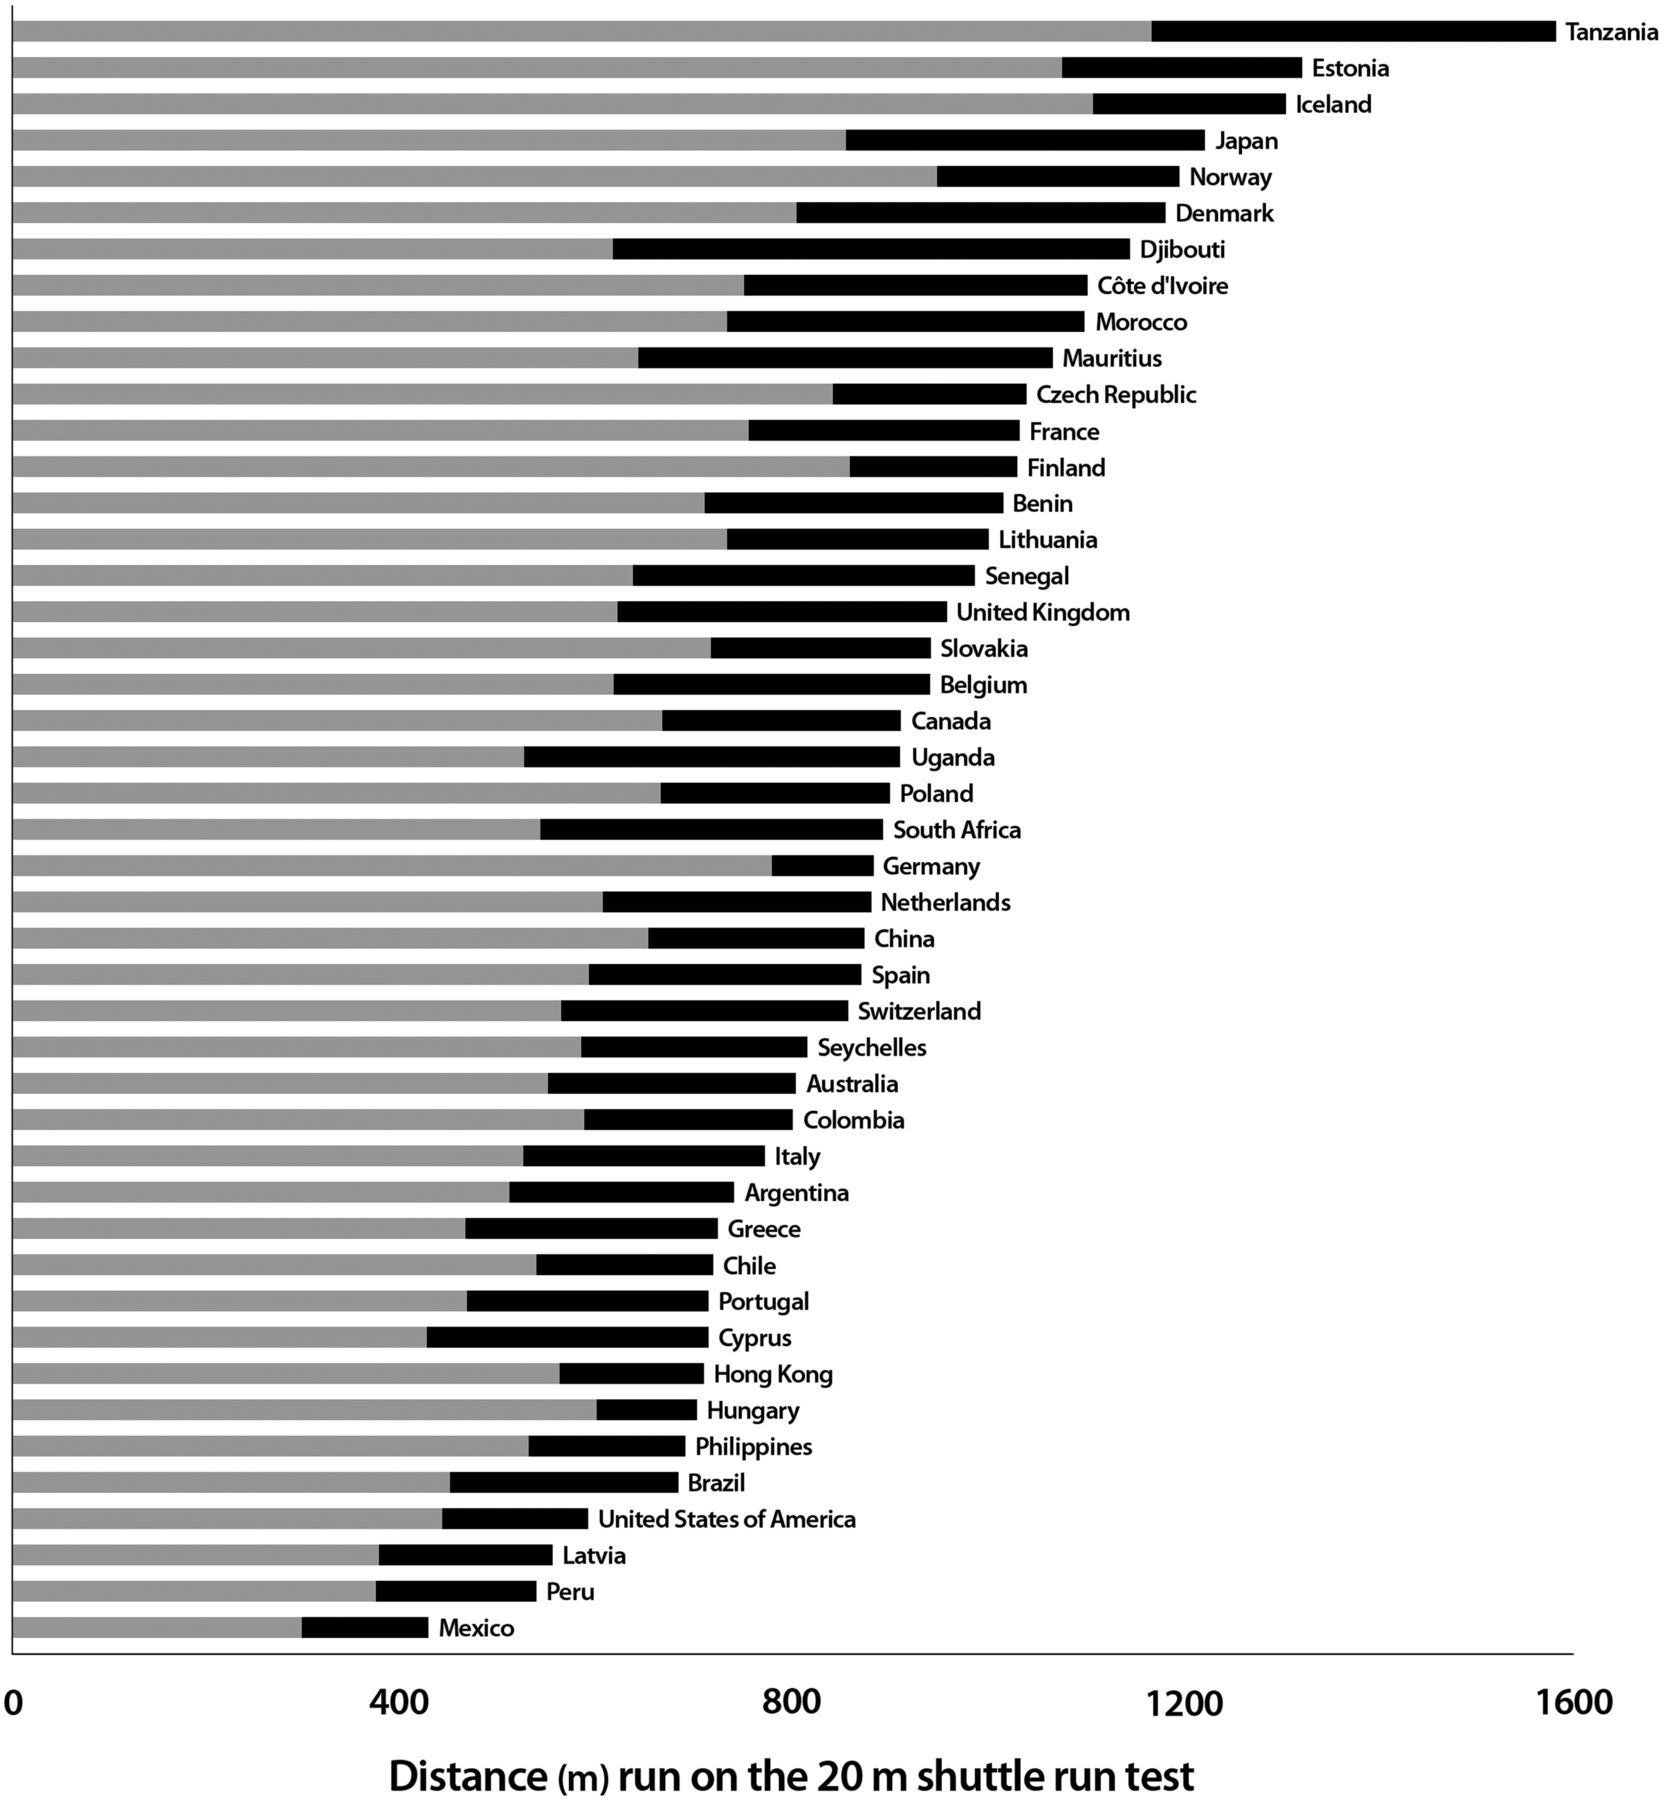
There was a very high correlation (r=0.90) between the 33 common country performance indices reported in this study and in Olds et al.27 Furthermore, our results suggest that 20mSRT performances in children and youth vary substantially across countries, spanning 2.8 SDs from the best performing country (Tanzania) to the worst performing country (Mexico). To illustrate this finding, figure 2 depicts the country-specific mean distance (m) run on the 20mSRT by boys and girls, which indicates that boys and girls from Tanzania would cover a distance approximately four times greater than their Mexican counterparts (equivalent to a maximal running speed of ∼1.3 times faster). The magnitude of variability in CRE between countries is concerning and suggests that low CRE may be a public health issue in some countries. Indeed, this substantial variability provides some evidence supporting CRE as a population-level indicator of health in children and youth. Future research should further explore the direct impact of low CRE in childhood and the future disease outcomes in adulthood. However, following a quartile framework, countries that fall below the 25th centile should take action by implementing policies and programmes targeted at increasing CRE in children and youth. Likewise, countries that fall between the 25th and 50th centile should take precautionary measures.
Bar graph describing the distance (m) run by boys and girls on the 20mSRT based on country- specific and age-specific performance indices. Only countries (n=45) with 20mSRT performance indices for boys (represented by the black bars) and girls (represented by the grey bars) are shown. 20mSRT, 20 m shuttle run test.
A total of 23 European countries are represented in this study. Our findings suggest a clear latitudinal gradient where Central-Northern countries perform better on the 20mSRT than their Southern counterparts by ∼0.6 SDs. Following the same Central-Northern versus Southern division of Europe, Ortega et al 193 also found a difference in CRE where Central-Northern countries performed significantly better on the 20mSRT than their Southern counterparts. These findings have been attributed to differences in physical activity levels in children and youth across countries,194 ,195 which may be further exacerbated by disparities in socioeconomic indicators.196
Within countries we found sex differences, where boys consistently outperformed girls on the 20mSRT across all countries (figure 2). Sex differences in CRE are consistently reported in the literature,27 ,197 with our study providing a unique perspective that suggests the magnitude of the sex differences may be country specific. These sex-related differences may be due to age-related and maturation-related differences between countries. Further analysis of cross-country sex differences is beyond the scope of this paper. Nevertheless, there is a need for further research on this topic.
Possible socioeconomic correlates
Following an ecological framework,198 highlighting correlates of 20mSRT performance may provide country-level target areas for policies and programmes that may ultimately help increase CRE in children and youth. There are many possible broad country-level correlates of 20mSRT performance in children and youth. These may include HDI, the distribution of wealth within a country, urbanisation, climate and country-specific physical activity and childhood obesity levels.
Childhood obesity
Internationally, the measurement and surveillance of body composition is a public health norm with prevalence data available for ∼188 countries.33 Studies indicate that, similar to CRE, the prevalence of overweight and obesity in children and youth varies substantially across countries.33 Our study supports childhood obesity prevalence as a weak negative correlate of 20mSRT performance in developed countries (rs=−0.27; 95% CI: −0.56 to 0.08). In developing countries, the correlation between childhood obesity prevalence and 20mSRT performance was trivial (rs=−0.00; 95% CI: −0.50 to 0.50), suggesting that childhood obesity prevalence is a stronger negative correlate of CRE in more developed countries.
Physical activity
Physical activity is considered a modifier of CRE. Thus, we would anticipate that higher population levels of physical activity result in higher CRE levels in children and youth.199 However, physical activity is a behaviour that varies substantially across time and is difficult to measure at the population level.7 ,200 ,201 Validated self-report surveys are the most popular way to estimate physical activity across countries in children and youth, such as the Global School-based Student Health Survey202 and the Health Behaviour in School-aged Children (HBSC) survey.203 Data from the HBSC study suggest that moderate-to-vigorous physical activity is a weak negative correlate of 20mSRT performance in children and youth in developed countries (rs=−0.12; 95% CI: −0.52 to 0.32). This result may reflect limitations of the HBSC study which used self-report measures for selected age groups across less than half of the countries for which performance index data were available. In contrary, these results may also reflect the fact that moderate-to-vigorous physical activity is not a good correlate of maximal-effort CRE in children and youth.
More recently, efforts have been made to use objective measures of physical activity (pedometers and accelerometers),194 but these efforts have been predominantly adopted in developed countries.204 However, a recent international study comparing objectively measured physical activity suggests that children in Northern Europe and Africa are more active than children in South America, broadly consistent with our findings.205
Urbanisation
Worldwide, there is a major population demographic shift where now, more than ever, the majority of the world's population lives in urban and/or suburban settings.206 These demographic shifts are synonymous with a variety of lifestyle transitions as a result of mechanisation replacing laborious jobs, and an increase in transportation choices and food availability. A population shift towards cities is described as a component of the epidemiological207 and physical activity208 transitions due to the resulting decrease in habitual physical activity in these populations. The physical activity transition is a theoretical perspective that can be described as:‘Overall, socioeconomic and demographic changes occurring in concert with the epidemiological transition appear to be associated with the adoption of a lifestyle characterized by lower energy requirements at work and for the procurement of food, less dependence on walking as a primary means of transportation, and the popularity of sedentary activities to fill a growing availability of leisure time no longer needed to carry out activities related to securing food and shelter. (ref. 208, p. 277)’
Since physical activity is a modifier of CRE, there are plausible associations between high urbanisation and low CRE levels in children and youth.
In our study, urbanisation was a weak correlate of 20mSRT performance for developed countries (rs=0.15; 95% CI: −0.20 to 0.47). This result is most likely due to developed countries already attaining a high level of urbanisation. In contrast, urbanisation is a moderate negative correlate of 20mSRT performance in developing countries (rs=−0.45; 95% CI: −0.80 to 0.13). Although this finding is not statistically significant, it describes the potential negative impact of rapid urbanisation with regard to CRE. This pattern is especially apparent in some South American countries (Brazil, Peru and Colombia) with high urbanisation and low CRE levels. Therefore, these countries might be in the midst of a physical activity transition. This is a drastically different demographic situation compared to countries with relatively low urbanisation rates (Uganda, Sénégal, Mauritius and Benin) that demonstrate high CRE levels in children and youth.
Human Development Index
The HDI is a composite measure combining country-specific prosperity and various indicators of quality of life. Our study indicates that HDI is a weak positive correlate of 20mSRT performance in developed countries (rs=0.29; 95% CI: −0.05 to 0.57). In contrast, developing countries show an opposite gradient where HDI is a strong negative correlate of 20mSRT performance in children and youth (rs=−0.56; 95% CI: −0.83 to −0.09). A likely explanation of these results is that physical activity in developing countries is often obligatory because food is relatively scarce, and demanding chores required for survival. However, when these countries become more developed, food becomes readily available and the presence of mechanisation and automation makes physical activity no longer obligatory. In developed countries, it is likely that leisure time and wealth provides alternative opportunities for physical activity pursuits. These results lend further support to the presence of a physical activity transition in developing countries.208
Gini index
The Gini index is a population measure of the distribution of wealth. Our study indicates that a large population distribution in wealth (income inequality) is a moderate to strong negative correlate of CRE in children and youth, regardless of country development status. This finding suggests that policies aimed at reducing the gap between rich and poor might be a suitable population approach to increase CRE. Our results align with previous research that highlighted income inequality as the strongest structural determinant of health in adolescents.209 Furthermore, Elgar et al 210 found that high national income inequality was associated with low population levels of physical activity, high BMI and more psychological and physical health symptoms in youth.
Climate
Our study indicates that climate is a strong positive correlate of 20mSRT performance (rs=0.63; 95% CI: 0.37 to 0.80) for developed countries, where colder countries have higher CRE than warmer countries. In developing countries, climate is a weak negative correlate (rs=−0.21; 95% CI: −0.64 to 0.32), where warmer countries tend to perform better than their colder counterparts. These results are conflicting and difficult to interpret. It is possible that the strong positive correlation in developed countries is due to the negative physiological effect of exercising in warm and humid temperatures. However, in contrast to previous findings, the strong correlation in developed countries remained significant after removing Northern European countries from the analysis (rs=0.53; 95% CI: 0.21 to 0.75), suggesting that the result was not an artefact of the superior performance of children and youth in Northern Europe.27
Strengths and limitations
Our study represents the largest and most comprehensive cross-country comparison of children's CRE. Although this study is not the first of its kind, it does provide a significant update to the study by Olds et al 27 by extending the coverage date from 2003 to 2015, and by adding an additional 13 countries and 724 000 data points to the analysis. As a result of the broad scope of this study, we acknowledge several limitations: (1) globally, CRE has declined by 2.2% per decade from 1981 to 2015 (for all children), with little change over the past 15 years. This decline may have artificially increased the rankings of countries with measurements that were made earlier (ie, Benin in 1987, Côte d'Ivoire in 1985, Turkey in 1991 and Suriname in 1991) and decreased those that were made more recently; (2) we combined a variety of studies with different sampling strategies (probability and non-probability) and sampling frames (national, state/provincial and regional); (3) some country-specific performance indices were calculated using small samples and limited sex by age groups which reduced the confidence in some of our country estimates; (4) the testing conditions may have varied between included studies (ie, indoor/outdoor, altitude and temperature); (5) measurement drift may have occurred in administering the 20mSRT between and within countries and (6) individual physiological (eg, mechanical efficiency,211 fractional utilisation212 and lactate threshold213), psychosocial (eg, motivation and self-efficacy20) and cultural factors may have also contributed to differences in performance and may have changed in some countries over time.
To strengthen our study, we combined data from 177 studies, representing the best available data on 20mSRT performance in children and youth, using rigorous and standardised data treatment techniques. These techniques control for variability in reporting 20mSRT results and provide us with the ability to compare testing results meaningfully between studies. We used a poststratification population-weighting procedure, so that our performance index reflects the country-specific population demographics. Furthermore, we believe that the size of our study, with over 1.1 million test performances, will help decrease any study specific limitations.
Surveillance of CRE as a powerful population health indicator in children and youth
Convincing evidence indicates that the precursors for future disease have their origin in childhood and adolescence, making these age groups very important for current and future health.214 Thus, childhood and adolescent health promotion efforts in the form of interventions, programmes and policies are important public and population health initiatives. However, it is impossible to know the impact of such efforts without the consistent surveillance and monitoring of population health indicators. Currently, there are two comparable population health indicators in children and youth—body weight status and physical activity levels. The surveillance of body weight status at a population level is essential, but changes in body weight do not occur fast enough to understand the short- and medium-term impact of newly implemented policies and programmes. Evidence also suggests that individuals can classify as obese but still have healthy CRE and a healthy phenotype, known as the obesity paradox.215 Ideally, monitoring physical activity levels in a population would provide important feedback on health promotion efforts, but there remain several limitations in the effectiveness and feasibility of measuring physical activity in populations of children and youth.200 ,201 Although physical activity and CRE are independently associated with health markers,216 conceptually, CRE is a possible proxy for overall physical activity levels within a population. Thus, the measurement of CRE, via the 20mSRT, can be an objective surrogate measure that can be used to study the link between physical activity and health. As a population health indicator, the 20mSRT is an effective and feasible tool that demonstrates minimal barriers with regard to culture and language, is cost-effective, results are easy to score and interpret, and it can be easily administered with large groups of children.20 We believe that the population-wide and international measurement of CRE is important to understand the health of children and youth, the impact of health promotion policies and programmes as well as the potential future population burden of non-communicable disease.
Recommendation
We recommend the development of an international 20mSRT internet portal that provides resources to correctly administer and record 20mSRT performances following the recommendations of Tomkinson et al.30 This easy-to-access portal would also include an international 20mSRT data repository where researchers, physical educators, coaches and individuals could input their performance data for children and youth free of charge. In return, the website would compute a results sheet comparing the group/individual performance score with international,30 regional and country normative centile values, providing the user with general performance feedback. All data would be housed on a secure server and used to continuously update international normative values, cross-country comparisons and temporal trends in 20mSRT performance. This data repository would serve as an international surveillance system to monitor 20mSRT performance in children and youth. The authors are currently working to launch such a repository.
Conclusion
Our study demonstrates the broad international utility of the 20mSRT in children and youth. This field-based assessment is suitable for international surveillance because of its low cost, ease in administering, very good test-retest reliability and validity as well as ability to test large groups of children simultaneously. This study used a systematic review method, rigorous data treatment and a poststratification population-weighting procedures to obtain and compare 20mSRT performance data across 50 countries. Our data suggest that children and youth in Central-Northern Europe and Africa are among the world's best 20mSRT performers, whereas those from South America are among the worst performers. Worldwide patterns of variability in 20mSRT performance broadly mirror socioeconomic indicators in a way that support the theory of a physical activity transition and the importance of wealth distribution as a strong structural determinant of health. These data can help inform the development of an international 20mSRT surveillance system to monitor the variability and temporal trends in 20mSRT performance for children and youth across countries, providing insights into the general health and well-being of populations.
What are the findings?
This study provides a 50-country comparison of 20 m shuttle run performance using rigorous data standardisation techniques.
There are broad country-specific socioeconomic indicators that correlate with 20 m shuttle run performance in children and youth.
20 m shuttle run test data can be used as an international population health indicator for surveillance in children and youth.
Acknowledgments
The authors acknowledge all individuals who provided details of their study and/or generously offered their raw data.
References
Footnotes
Contributors JJL, GRT and MST developed the research questions and objectives. JJL and GRT led the data analysis and synthesis of results. JJL wrote the manuscript. All authors contributed to interpreting results, editing, reviewing and approved the final manuscript.
Competing interests None declared.
Provenance and peer review Not commissioned; externally peer reviewed.