Article Text

Abstract
Objective To summarise the literature on the economic burden of physical inactivity in populations, with emphases on appraising the methodologies and providing recommendations for future studies.
Design Systematic review following the Preferred Reporting Items for Systematic Reviews and Meta-Analyses guidelines (PROSPERO registration number CRD42016047705).
Data sources Electronic databases for peer-reviewed and grey literature were systematically searched, followed by reference searching and consultation with experts.
Eligibility criteria Studies that examined the economic consequences of physical inactivity in a population/population-based sample, with clearly stated methodologies and at least an abstract/summary written in English.
Results Of the 40 eligible studies, 27 focused on direct healthcare costs only, 13 also estimated indirect costs and one study additionally estimated household costs. For direct costs, 23 studies used a population attributable fraction (PAF) approach with estimated healthcare costs attributable to physical inactivity ranging from 0.3% to 4.6% of national healthcare expenditure; 17 studies used an econometric approach, which tended to yield higher estimates than those using a PAF approach. For indirect costs, 10 studies used a human capital approach, two used a friction cost approach and one used a value of a statistical life approach. Overall, estimates varied substantially, even within the same country, depending on analytical approaches, time frame and other methodological considerations.
Conclusion Estimating the economic burden of physical inactivity is an area of increasing importance that requires further development. There is a marked lack of consistency in methodological approaches and transparency of reporting. Future studies could benefit from cross-disciplinary collaborations involving economists and physical activity experts, taking a societal perspective and following best practices in conducting and reporting analysis, including accounting for potential confounding, reverse causality and comorbidity, applying discounting and sensitivity analysis, and reporting assumptions, limitations and justifications for approaches taken. We have adapted the Consolidated Health Economic Evaluation Reporting Standards checklist as a guide for future estimates of the economic burden of physical inactivity and other risk factors.
- physical activity
- economic burden
- economic cost
- cost analysis
- healthcare cost
- health expenditure
- systematic review
Statistics from Altmetric.com
- physical activity
- economic burden
- economic cost
- cost analysis
- healthcare cost
- health expenditure
- systematic review
Introduction
Physical inactivity is a global pandemic. Every year, physical inactivity causes more than 5 million deaths1 and costs billions of dollars to societies around the world.2 To date, many countries have developed national physical activity plans; however, few have been fully implemented.3 The substantial gap between policy and implementation may be due to a lack of resources, cross-sectoral partnership and clear strategies. Public health responses to address the pandemic of physical inactivity remain inadequate, uncoordinated and underfunded.3
Economic analysis is essential to bridging the policy–implementation gap, increasing political engagement and motivating actions. Around the world, governments are addressing many competing priorities with finite resources. Making an economic case for physical activity may help galvanise public support, inform decision making and prioritise funding allocation to develop and implement interventions to reduce physical inactivity in the population.4 Estimating the economic burden of physical inactivity is a critical first step because it can provide comprehensive information regarding the burden of the pandemic and the costs of not taking action.2 Conducting economic evaluation of interventions designed to mitigate physical inactivity is the key to identify strategies that are the best value for money to fully inform resource prioritisation.
It is important that studies adopt robust, standardised and transparent methods when assessing the economic burden of risk factors, such as physical inactivity. Methodological consistency between studies enables valid comparisons regarding the absolute and relative burden of physical inactivity compared with other risk factors. This can be expected to increase the confidence of decision makers to commission and use such analyses in decision making. To date, a range of studies have been published on the economic burden of physical inactivity at local, state or national levels, mostly in developed countries. In 2016, as part of the Lancet Physical Activity Series, we published the first global estimate that included 142 countries.2 However, prior estimates, even for the same country, vary substantially across studies. For example, Carlson et al estimated that physical inactivity accounted for 11.1% of the healthcare expenditure in the USA5 while Colditz estimated the proportion to be 2.4%.6 The difference between 11.1% and 2.4% is enormous. Understanding and perhaps resolving such divergent estimates is crucially important to enhance the overall credibility of economic burden estimates in decision making.
The purpose of this paper is to undertake a systematic review of the current literature on the economic burden of physical inactivity in populations or population-based samples, with emphases on a critical appraisal of the methodologies of each study and a discussion on how the conduct and interpretation of future studies may be improved.
Methods
Data sources and searches
The protocol for this systematic review was registered with the International Prospective Register of Systematic Reviews (PROSPERO; registration number CRD42016047705, available at http://www.crd.york.ac.uk/PROSPERO/display_record.asp?ID=CRD42016047705). This systematic review follows the Preferred Reporting Items for Systematic Reviews and Meta-Analyses (PRISMA) guidelines.7
We identified studies through searching electronic databases, including Medline (via OvidSP; 1946–present), Scopus and Global Health (via OvidSP; 1910–present) for peer-reviewed papers, and Web of Science conference proceedings (1900–present), ProQuest Dissertations and Theses Global, Google Scholar and Google for grey literature. The literature search was conducted from database inception to October 2016, using search terms outlined in supplementary file 1. Additional articles were identified through searching the references of eligible articles and consultation with experts in the field (authors of the global estimate paper by Ding et al 2 and experts listed in the Acknowledgements section of that paper).
Supplementary data 1
Eligibility criteria
A study was considered eligible if it: (1) examined physical inactivity as a risk factor; (2) examined the economic burden of physical inactivity in any format, such as an estimated amount, a percentage (eg, of healthcare expenditure) or the differential costs between those who were physically inactive and those who were not; (3) provided estimates based on a population (eg, Canadian adults) or a population-based sample (eg, the Australian Longitudinal Study on Women’s Health); (4) provided sufficient methodological details to allow for data extraction; and (5) included an English abstract or summary. No additional restrictions regarding the date of publication, language or peer-review status were imposed.
A study was excluded if it was based on a workplace sample only,8 if it provided little information on methodologies or used a patented technique or tool9 or if it included physical inactivity as a component of an overall lifestyle index or factor.10 Finally, publications that did not include original analysis, such as reviews and commentaries, were also excluded.
Study selection
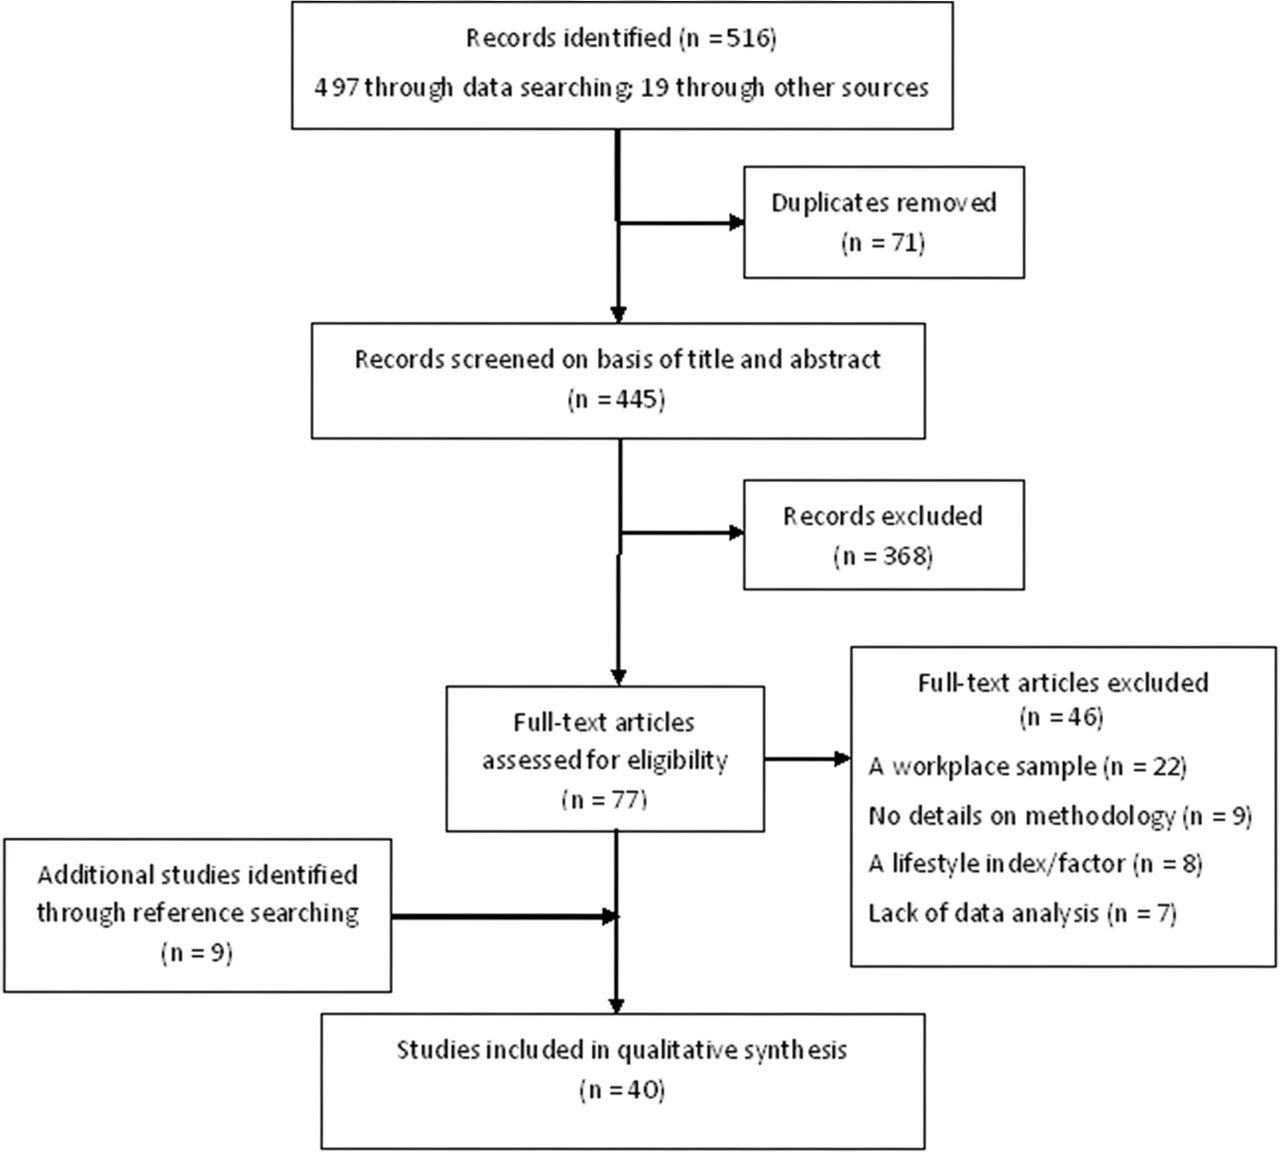
Eligibility of identified studies was assessed independently by two authors (DD and TLK-A) following a standard protocol that involved reading the title, abstract and full-text articles. Uncertainty was discussed after reading the full text, and any disagreement was resolved by consensus. A PRISMA flow diagram presents the summary of the study selection process (figure 1).
Selection of articles for systematic review.
Data extraction
The outcomes of the studies included direct (ie, healthcare expenditure) and indirect costs (eg, productivity losses). Studies estimating the direct healthcare costs of physical inactivity generally used two approaches: (1) a PAF-based approach, which calculates healthcare costs attributable to physical inactivity by applying a PAF (interpreted as the proportion of disease that would not exist if physical inactivity was eliminated) to disease-specific costs; and (2) an econometric approach, which uses data linking physical inactivity and healthcare expenditure at the individual level. Data were extracted separately for direct and indirect costs and for studies that used a PAF-based and an econometric approach.
One author (DD) extracted data from studies, and two other authors (TLK-A, BN) each independently re-entered 30% of the extracted data for quality assurance. Any disagreement was resolved by consensus. Extracted data elements included country, data sources, physical activity measures (eg, minimal risk counterfactual or physical activity categories), time frame (eg, 1 year vs lifetime) and perspective of the analysis (eg, ‘healthcare payer’, ‘household’, ‘economy’ or ‘societal’).11 Various other methodological considerations were extracted. Specifically, for studies that estimated direct healthcare costs using a PAF-based approach, we extracted data on the diseases or health conditions included in the cost estimates (eg, diabetes and stroke), whether the PAF was based on crude or adjusted relative risks (RRs) and whether comorbidity among diseases was accounted for. For studies using an econometric approach, we extracted data on the study design (eg, longitudinal and cross-sectional), sample, the types of costs included (eg, inpatient and outpatient) and adjustment for covariates. Finally, we also extracted information on the reported funding sources and conflict of interest.
For studies that estimated indirect costs, we extracted the type of costs included (eg, productivity losses from absenteeism, presentism and others) and the methodology used. Three main approaches were used. The friction cost approach (FCA) takes an ‘employer perspective’ to estimate productivity losses during the ‘friction period’, which is the time before an employer replaces the worker lost to death or disability.12 The human capital approach (HCA) takes an ‘employee perspective’ and estimates the productivity losses over an expected working lifetime, irrespective of whether an individual dies from the risk factor and/or an employer can replace the worker.13 Finally, a value of a statistical life (VSL) approach monetises an average or ‘statistical’ life lost.14 The key difference of a VSL approach is that it seeks to value life lost as opposed to estimating the productivity costs incurred. Overall, the estimates produced differ across methods, increasing from FCA to HCA to VSL.
For studies that involved an estimate of the economic burden over time, we extracted information on whether discounting was applied. Discounting is a process where all present and future costs are converted to a single net present value (NPV). Discounting is an essential practice in robust economic analysis.15
Finally, we extracted information on any uncertainty analysis/sensitivity analysis regarding the estimates produced. We searched for whether studies investigated statistical uncertainty and/or structural uncertainty. Statistical uncertainty concerns input parameters to the model and corresponding estimates of the economic burden the model produced. Statistical uncertainty is typically represented by means and standard errors/confidence intervals, and statistical sensitivity analysis explores sampling from the distributions to understand how the economic burden varies. Possibilities include, for example, multiway sensitivity analysis and probability sensitivity analysis. Structural uncertainty concerns the nature of the model (eg, uncertainty in the econometric assumptions used) and/or parameters included (eg, using FCA, HCA or VSL when estimating indirect costs). Structural sensitivity analysis explicitly investigates such uncertainties if relevant, by varying the model as appropriate (eg, different parameters and functional forms) and reporting the corresponding change in the economic burden estimates produced.
In the case of lacking specific information (eg, types of cost included), we examined the references provided by the authors to obtain relevant information. If the information was not available, we coded it as ‘not specified’, and when the information provided was ambiguous, we coded it as ‘unclear’.
Risk of bias assessment
Due to the lack of risk of bias assessment tools or established methodological guidance on how to conduct a high-quality analysis of the economic burden of physical inactivity (or other lifestyle risk factor), we did not perform a formal risk of bias assessment according to an existing instrument, nor did we exclude studies based on low quality. Instead, we extensively discussed methodological and presentation issues throughout the paper and developed a checklist that could be used for future original studies and quality assessment.
Data synthesis
General characteristics of the selected studies, including country, perspective, methodology for estimating direct healthcare costs, whether indirect costs were estimated and type of publication, were summarised in a table. Additional specific information extracted from each study (see ‘Data extraction’) was synthesised separately by the type of costs (direct vs indirect costs) and the methodological approaches to estimating direct healthcare costs (PAF-based vs econometric).
To facilitate comparison of estimates across studies, we presented the percentage of overall healthcare expenditure attributable to physical inactivity. When the percentage was not reported by the study but the overall physical inactivity-related healthcare expenditure was available, we calculated the percentage based on the overall healthcare expenditure data for that year from the WHO website (http://apps.who.int/nha/database/Select/Indicators/en). Additionally, to facilitate comparison of national estimates from different years and in different currencies, we inflated the national estimates (point estimates only) in local currency units from the year of data to 2013, as the common year, using the annual consumer prices inflation indicators from the World Bank (http://data.worldbank.org/indicator/FP.CPI.TOTL.ZG) and then converted to purchasing power parity (PPP) international dollars using conversion factors provided by the World Bank (http://data.worldbank.org/indicator/PA.NUS.PPP). This approach, similar to that used in our recent global estimates,2 allows for comparison across countries using a common currency taking PPP into account. Finally, when the authors presented incorrect information (eg, using incorrect exchange rate and inappropriately calculated healthcare expenditure percentages), we attempted to present corrected information in summary tables and noted the correction in footnotes.
Results
Selection of studies
As shown in figure 1, a total of 516 studies were identified, of which 445 were unique records. After excluding 368 records based on reading the title and abstract, full texts of the remaining 77 studies were examined. A total of 46 studies were excluded because they did not meet the inclusion criteria. In total, 40 studies were qualitatively synthesised and appraised (see online supplementary file 2).
Supplementary data 2
Study characteristics
Table 1 demonstrates characteristics of the 40 studies. Nearly half of the identified studies were conducted in North America (10 in the US and eight in Canada), five studies were conducted in Australia, three in the UK, two were across multiple countries and the rest of the studies were conducted in Brazil, China, Czech Republic, Japan, Korea, Switzerland, New Zealand and Taiwan. Overall, 35 studies were peer-reviewed and five were grey literature reports.
Characteristics of studies (n=40)
Perspective
Two-thirds of the studies (n=27) took the sole perspective of the healthcare payer and estimated the direct healthcare expenditure only. Of the 13 studies that also estimated the indirect costs of physical inactivity, 12 combined the perspectives of the healthcare payer and the economy, by additionally estimating costs of productivity losses.2 16–26 Only one study took a comprehensive societal perspective by estimating direct healthcare costs, indirect costs of productivity losses and those of home-based and leisure-based production.27
Estimates of direct costs
All studies included some estimates of the direct heathcare costs of physical inactivity. Of those, 23 studies used a PAF-based approach, while 17 used an econometric approach.
Converted national estimate: we inflated the national estimates in local currency units from the year of data to 2013 using the annual consumer prices inflation indicators from the World Bank (http://data.worldbank.org/indicator/FP.CPI.TOTL.ZG) and then converted to PPP international dollars using conversion factors provided by the World Bank (http://data.worldbank.org/indicator/PA.NUS.PPP). However, the estimate was not converted for Martin et al 25 due to the lack of Swiss franc (SFr) to PPP international dollar conversion factor from the World Bank.
Studies using a PAF-based approach
As shown in table 2, although the 23 studies did not use a standardised minimal risk counterfactual for calculating the PAF, most used a definition that was equivalent to approximately 150 min of moderate-intensity physical activity per week as recommended by current physical activity guidelines.28 Almost all studies included a broad range of healthcare expenditure, such as inpatient, outpatient, pharmaceutical and physician care costs. One study included inpatient costs only.29 In estimating direct healthcare costs, studies included between four and eight health conditions, nearly all of which included ischaemic heart disease, diabetes, breast cancer and colon cancer. Some studies included additional conditions, such as stroke, hypertension and osteoporosis.
Characteristics of studies that applied a population attributable fraction (PAF) approach to estimating direct healthcare costs of physical inactivity (n=23)
Regarding the PAF used for estimating direct healthcare costs, most studies did not specify whether the PAF was based on adjusted or unadjusted RR. After checking the cited references about the PAF, we could only confirm that nine studies used PAF based on adjusted RR.2 18 19 21–23 26 29 30 All studies took an additive approach by summing costs attributable to physical inactivity across multiple diseases/conditions. This could potentially lead to double counting among those with multiple conditions, commonly known as comorbidity. Only two studies explicitly described efforts to address comorbidity. One study estimated the potential overlaps among ischaemic heart disease, stroke, and type 2 diabetes and subtracted the overlapped proportions from the sum.2 The other study used data that could identify comorbidity through individual hospital records.24
All studies provided an overall amount for the healthcare costs of physical inactivity for a one-year time frame. Nineteen of the 23 studies provided a national level estimate, most of which was presented as or converted to a percentage of national healthcare expenditure. The percentages ranged from around 0.3% in the Czech Republic31 and England32 to 4.6% in New Zealand,24 with the majority of the estimates ranging between 1% and 2.5% (Supplementary figure 1). Twelve studies provided some sensitivity analysis.2 6 18 20–25 30 33 34 Of those, four included structural sensitivity analysis, by taking into account different physical activity prevalence and/or PAF.2 25 30 34
Studies using an econometric approach
Of the 17 studies that used an econometric approach, three applied a longitudinal design,35–37 one used a retrospective cohort design,38 and the remainder were cross-sectional studies (table 3). The sample size of studies ranged from 250 to 51 165. The measurement and categorisation of physical activity varied across studies and often included multiple levels. In most cases, healthcare cost data were measured objectively, based on health insurance claims or data from other healthcare systems. Only three studies used self-reported health expenditure data.39–41 In most cases, health cost data included comprehensive types of expenditure, including both inpatient and outpatient care. However, two studies did not include inpatient services,42 43 and one study primarily included inpatient services.44 The types of expenditure included in each study depended on the data sources, such as public systems versus private health insurance companies.
Characteristics of studies that applied an econometric approach to estimating the direct healthcare costs of physical inactivity (n=17)
Findings from these studies were presented in heterogeneous formats. For example, some studies presented excessive healthcare costs among those who were less active (or cost savings among those who were active), in terms of absolute or proportional difference,5 38–40 43–45 some presented the magnitude of association between physical activity and healthcare expenditure42 46 47 and a number of studies extrapolated findings from the sample to the population at the national level.5 35 36 40 41 43 48 49 Overall, based on the converted national-level estimates of the proportion of healthcare expenditure associated with physical inactivity, studies that applied an econometric approach produced much higher estimates than those applying a PAF-based approach (Supplementary Figure 1). Only two econometric studies included structural sensitivity analyses by taking into account alternative model forms.5 35
Supplementary data 3
![[SP3.jpg]](https://bjsm.bmj.com/content/bjsports/51/19/1392/DC3/embed/inline-supplementary-material-3.jpg?download=true)
Estimates of indirect costs
All of the 13 studies provided estimates of productivity losses in the workforce (table 4). Of those, the majority of the studies applied HCA and estimated cumulative productivity losses over a working lifetime of population affected (including current and future costs).16–23 25 26 Two studies used FCA to estimate productivity losses during the replacement period.2 27 In studies where both HCA and FCA were used, in the form of sensitivity analysis, FCA yielded much lower costs than HCA.2 22 27 One study used a VSL approach and had much higher estimates of indirect costs than studies applying HCA and FCA.24 Although at least 10 studies provided lifetime estimates by incorporating costs that will occur in the future, only four explicitly described discounting future costs,18 20 24 27 another five were identified as applying discounting on checking their references or data sources.16 19 21–23 Most studies included some form of statistical sensitivity analysis.2 18 20–25 27 Five studies conducted structural sensitivity analysis by varying the model using alternative approaches/parameters.2 22 24 25 27
Characteristics of studies that estimated the indirect costs of physical inactivity
Discussion
To our knowledge, the current systematic review is the first to comprehensively summarise findings and methodological considerations of studies estimating the economic burden of physical inactivity in populations. Although 40 studies were included in our review, the current estimates stem disproportionately from a small number of countries. Specifically, 38 single-country studies represented only 12 countries, of which 10 were high-income countries. At the global level, estimating the economic burden of physical inactivity remains an important yet underdeveloped area, particularly in low-income and middle-income countries.4
Based on the findings from the studies reviewed, it is evident that physical inactivity is a costly pandemic that is associated with a substantial disease burden in almost every country where estimates exist. However, because of large variation in methodologies, health systems and the prevalence of physical inactivity over time, it is problematic to compare estimates of the cost of physical inactivity across studies and countries. As demonstrated by the current review, there is important variation in the perspective taken (eg, healthcare payer only vs societal perspective), type of costs included, specific costing approaches, measurement of physical activity, adjustment for covariates/confounding, time frame (eg, 1 year vs lifetime) and whether sensitivity analysis was undertaken and in what form. These all contributed to the substantial variations in the estimates of economic burden.
Study perspective
The perspective refers to the viewpoint from which an economic analysis is conducted, which influences the types of information included.50 Both the original and second Panels on Cost-Effectiveness in Health and Medicine recommended taking a societal perspective as the most comprehensive approach because it estimates the total impact on society, including the health sector, non-health sector and households.50 51 Economic burden of disease studies should ideally be aligned with this guidance for consistency. Specifically, studies should collect information on costs to the healthcare sector (ie, direct costs to public/private healthcare providers and patient costs), non-health sectors (indirect costs or productivity losses) and household economy (eg, impact on usual activities and carers, where appropriate). Most existing studies on physical inactivity take a narrower healthcare sector perspective with the rationale that the key decision maker in addressing inactivity is the health sector. While studies on healthcare costs are necessary, we argue that it is not sufficient, and it is straightforward to estimate non-health sector productivity losses and the impact on the household economy. Taking such wider impacts into account can help make the economic case for additional healthcare resources. Furthermore, policies and interventions that impact on physical activity may reside outside of the healthcare sector (eg, transportation) and may involve cross-sectoral partnership.
It is important to note that this approach estimates the ‘production costs’ resulting from physical inactivity to society, regarding the increase in healthcare production and the reduction in economy and household production. As discussed previously, it is possible to build on this to ‘value’ the impact of inactivity on health, rather than only estimating cost. There are alternative methods to do so, such as willingness to pay and VSL; however, these methods can be expensive to undertake. Therefore, in an effort to proceed incrementally and pragmatically, and to attempt to bring some initial alignment of future economic burden of disease studies, we reiterate our recommendation to take a societal approach concentrated on production costs and to disaggregate results into healthcare sector (direct costs), the wider economy or productivity impacts (indirect costs) and the household economy.
PAF-based versus econometric approaches
Two main approaches were used for estimating the direct healthcare costs of physical inactivity: a PAF-based approach and an econometric approach. Usually, an econometric approach leads to higher estimates. The marked differences in estimates using the two approaches may be explained in part by the following. First, a PAF-based approach focuses on capturing costs averted if certain diseases were prevented. Econometric models could additionally take into account potentially higher treatment intensity and costs, and possibly other ancillary costs among those with a disease/condition.52 Second, although the US Physical Activity Guidelines Advisory Committee Report28 concluded that there is moderate to strong evidence for the effects of physical activity on more than 20 diseases/conditions, most studies using a PAF-based approach included only a small subset of these. For example, no study reviewed included more than eight conditions (table 2). Therefore, using a PAF-based approach may underestimate the real healthcare costs associated with physical inactivity. Third, econometric analyses may capture differences in healthcare expenditure resulting from the fundamental differences between physically active and inactive individuals, such as overall health-seeking behaviour and health status. For example, according to Carlson et al’s cross-sectional analysis, adjusting for body mass index and excluding those with difficulty walking led to a 40% reduction in the estimated healthcare costs of physical inactivity.5 Fourth, while studies using a PAF-based approach were mainly based on overall adult populations, most studies using an econometric approach were based on samples of older participants, where physical inactivity-related diseases and conditions were more likely to occur. Furthermore, in the longitudinal analysis by Andreyeva and Sturm, adjusting for baseline health led to 45% lower healthcare cost estimates.35 Although most econometric analyses adjusted for covariates, which should be standard practice, without longitudinal data and careful methodological considerations, it is likely that econometric models could overestimate the actual healthcare costs of physical inactivity because of residual confounding and reverse causality.
The choice of applying a PAF-based approach versus an econometric approach depends mainly on data availability. Econometric analyses require data on physical inactivity and healthcare expenditure linked at the individual level. Regression models are usually performed to estimate the excess healthcare expenditure among those who are physically inactive, which could then be extrapolated to a population. Econometric analyses also provide opportunities to estimate healthcare costs within a particular population subgroup, for example, those who were ‘downhearted and blue’.49 However, it is important to ensure the generalisability of a sample before extrapolating findings to an entire population.
Studies using a PAF-based approach require data on healthcare costs for each of the diseases/conditions associated with physical inactivity. By applying PAF, one can estimate the proportion of healthcare costs attributable to physical inactivity. Several methodological aspects should be considered. First, the calculation of PAF should be based on adjusted RR. Unfortunately, more than half of the studies tabulated in table 2 did not adjust for covariates for PAF calculation. In our previous international study, we conducted a sensitivity analysis by applying PAF based on unadjusted RR. We found that this nearly doubled the estimates from the main analysis that was based on adjusted PAF.2 Second, ideally for calculating PAF, RR and the prevalence of physical activity should be based on the same population using the same definition of physical activity. However, this is challenging because the current epidemiological evidence of physical activity mostly stemmed from a small number of countries using heterogeneous definitions and measurement of physical activity. Third, summing physical inactivity-related costs of each disease/condition may result in double counting due to comorbidity. Current studies rarely address this issue, leaving comorbidity an ongoing challenge for future methodological advancement.
Although the decision for methodological approaches is practically driven by data availability, it is vital that for whatever approach chosen, care is taken to address the methodological issues raised above and to report all key assumptions, limitations and justifications for approaches taken.
Estimates of indirect costs
Only one-third of studies estimated the indirect costs in addition to direct costs. Studies varied depending on whether an FCA, HCA or VS approach was taken, which naturally results in different estimates produced. For example, according to the 1998 Economic Burden of Illness in Canada report, which applied an HCA, indirect costs of cardiovascular disease represented 171% of its direct costs.53 However, the same ratio was merely 3.1% according to the 2008 report,54 which applied an FCA.22
It is important to recognise that the existence of the FCA, HCA and VSL approach is not a weakness of economic analysis. Each approach involves different value judgements regarding what the analysis should consider, such as the cost of replacement (to employers), lifetime (to employees) or the value of life itself. These are ethical and contestable concepts. We recommend that a transparent economic analysis should explicitly state the value frame used and assumptions made and calibrate the analysis to the intended decision makers/end-users. As part of this process, we recommend structural sensitivity analyses that adopt different approaches, similar to the study by Cadilhac et al 27 to enable readers to fully understand the impact of adopting different value judgements. Equally, it is important that those who interpret the estimates understand the differences between methods to avoid erroneous comparisons between studies and to avoid needless confusion. It is important that economists are part of research teams to guide the analysis undertaken and help communicate the methods and results.
Time frame
The economic burden of physical inactivity could occur at present and in the future. For example, deaths and disability due to illnesses could incur future costs in terms of losses of income and other production. Almost all studies reviewed used a 1-year time frame for direct costs to capture healthcare expenditure occurring in the year of analysis. Studies that included indirect costs adopt a lifetime approach by default, by valuing productivity losses in the present period and also in the future (for the FCA this is conditional on the replacement period). It is important that studies explicitly describe the time frame of the analysis and apply discounting to estimate the NPV of all current and future estimates. The NPV is a single estimate designed to create a consistent comparison across studies that may use different time periods.15 50 A number of studies estimated lifetime costs did not use or explicitly mention discounting. This is poor practice that can be easily avoided.
Sensitivity analysis
Estimating the economic burden of physical inactivity, or any other risk factor, involves both inevitable statistical uncertainty and making various choices regarding which modelling approaches/methods (eg, FCA vs HCA) are included in the study. Therefore, it is imperative to clearly state assumptions for the main analysis and conduct comprehensive sensitivity analyses.11 50 51 Sensitivity analysis is an integral component of any robust and transparent economic analysis.55 Based on the current review of the literature, sensitivity analysis was not included in all studies. Again, this should be standard practice.
Study presentation
Most studies presented the results with sufficient information regarding the source of data, sampling frame (if applicable), measures of physical activity, type of costs, diseases/conditions included and year and currency. However, presentation of other methodological details was insufficient and often ambiguous, such as how the PAF was derived (eg, whether based on adjusted RR), perspectives, approaches, time frame, discounting and sensitivity analysis. Several studies presented the proportion of total healthcare expenditure attributable to physical inactivity, which is meant to facilitate comparison across studies and countries/regions. However, some studies presented such information in a misleading way by summing direct and indirect costs as the numerator, which inflated the percentage by several fold.17 18 Future studies should clearly and accurately present key information to improve transparency and integrity.
The need for economic evaluation of interventions to address physical inactivity
Estimating the economic burden is a vital first step in understanding the overall burden of physical inactivity and the consequences of inaction, which helps galvanise policy efforts. However, burden of disease studies should not be the sole consideration in the prioritisation process. For instance, large problems may be addressed relatively inexpensively and vice versa. Therefore, it is vital that economic evaluation is undertaken to assess both the costs and benefits of interventions to reduce the economic burden and to identify interventions that are the greatest value for money. In this way, resource-constrained decision makers can best prioritise societal resources to increase population health. There are guidelines that should be followed when conducting and reporting economic evaluations.56
Future directions
Overall, estimating the economic burden of physical inactivity is an area of increasing research and policy importance. We recommend that future cross-disciplinary collaborations involve economists to ensure that best practice is adopted, and physical activity experts to ensure that analyses are valid. Specifically, we recommend that a societal perspective is adopted to include direct, indirect and household costs, with the overall estimate reported and then disaggregated to these three levels. Furthermore, it is vital to carefully consider potential confounding, reverse causality and comorbidity. Discounting (when future impacts are included) and sensitivity analysis should be undertaken routinely. Overall, it is vital that studies are transparent in reporting the objectives, rationale and intended end-users/decision makers and that they align with assumptions made with the objectives. Finally, studies should transparently report any funding sources and conflict of interest.
There are currently no guidelines specifically for studies that estimate the economic burden of risk factors; therefore, we have summarised what we have discussed above in a new checklist (table 5), adapted from the Consolidated Health Economic Evaluation Reporting Standards.56 It is important to acknowledge that it is impossible to completely standardise methodologies because economic analysis is often conducted to address the needs of specific stakeholders. Hence, our newly developed checklist should be used as a guide for improving methodological rigour and reporting quality for future economic analysis that is set up to appropriately address specific objectives.
Checklist for reporting estimates of the economic costs/burden of risk factors*
Assessing the economic burden of physical inactivity is important; however, there is a need for general improvement in the conduct, reporting and interpretation of studies to increase the credibility of findings and to promote their use by decision makers.
What is currently known?
The pandemic of physical inactivity causes diseases and deaths and costs billions of dollars to societies around the world.
Economic analysis is essential to bridging the policy–implementation gap, increasing political engagement and motivating actions.
A range of studies have been published on the economic burden of physical inactivity, mostly in developed countries. However, prior estimates, even for the same country, vary substantially across studies.
There is no existing quality assessment tool or established methodological guidelines on how to conduct a high-quality analysis of the economic burden of physical inactivity or other lifestyle risk factor.
What are the new findings?
Among the current economic burden estimates, there is important variation in the perspective taken, type of costs included, specific costing approaches, measurement of physical activity, adjustment for covariates/confounding, time frame and whether sensitivity analysis was undertaken and in what form. These all contributed to the substantial variations in the estimates of economic burden.
Two main approaches were used for estimating the direct health care costs of physical inactivity: a population attributable fraction-based approach and an econometric approach. Usually, an econometric approach leads to higher estimates based on fundamental differences between the two approaches.
Many prior studies did not follow best practice in economic analysis and did not present sufficient information in a transparent fashion.
We developed a new checklist as a guide for improving methodological rigour and reporting quality for future economic burden analysis, adapted from the Consolidated Health Economic Evaluation Reporting Standards checklist.
References
Footnotes
Contributors DD led the conceptualisation, design and writing of this paper with critical input from KDL and other coauthors. DD, TLK-A and BN conducted independent literature search and study selection. DD conducted data extraction with TLK-A and BN independently re-entering data for quality check. DD and KDL developed the checklist. All authors critically reviewed the paper and approved the final version for submission.
Funding Dr Ding (APP1072223) is funded by an early career fellowship from the National Health and Medical Research Council of Australia. The funding sources had no involvement in the analysis presented here.
Competing interests None declared.
Provenance and peer review Commissioned; externally peer reviewed.