Article Text

Abstract
Objective To describe the injury and illness characteristics among participating athletes during the Lausanne 2020 Youth Olympic Winter Games (YOG 2020), 9–22 January 2020.
Methods The daily number of athlete injuries and illnesses were recorded (1) through the reporting of all National Olympic Committee (NOC) medical teams and (2) in the polyclinic and medical venues by the Lausanne 2020 medical staff.
Results In total, 1783 athletes from 79 NOCs were observed. NOC and Lausanne 2020 medical staff reported 228 injuries and 167 illnesses, equating 11.7 injuries and 8.6 illnesses per 100 athletes over the 14-day period. Injury incidence was highest for snowboard slopestyle (39%), bobsleigh (36%), snowboard big air (29%), ski slopestyle (29%), snowboard cross (24%) and ski cross (21%), and lowest for speed skating, snowboard halfpipe and curling (2%–4%). The highest incidence of illness was recorded for curling (21%), ski mountaineering (15%), snowboard halfpipe (13%), bobsleigh (11%), cross-country skiing (10%) and figure skating (10%). Almost one-third of injuries were expected to result in time loss and 17% of illnesses. Most injuries occurred to the knee (12%) and head (11%), and 64% of illnesses affected the respiratory system. Overall, women suffered more injuries and illness than males.
Conclusion Overall, injury and illness rates were similar compared with recent YOG. While the rate and characteristics of injury and illness varied between sports, consistent patterns across YOG are emerging. If addressed, changes in highlighted areas of risk could have a positive impact on the health and well-being of these young athletes.
- injury
- illness
- injury prevention
- athlete
- sport
Data availability statement
All data relevant to the study are included in the article or uploaded as supplemental information.
Statistics from Altmetric.com
Introduction
Sport injury and illness prevention and the protection of athlete health are key mandates for the IOC.1–3 While it is known that exercise and sport participation confer a number of health benefits in youth, sport participation can also carry an associated increased risk of musculoskeletal injury and illness. Ongoing, objective assessment of the magnitude of injury and illness and the causes and mechanisms associated with their occurrence in youth sport is important in order to understand and minimise the risks associated with sport participation.4
The first Youth Olympic Games (YOG) were staged by the IOC in Singapore in the summer of 2010, and the first Winter Games in Innsbruck in 2012. Innsbruck YOG 2012 was also where injuries and illnesses occurring during the games were recorded for the first time. Since then the impact of winter sport-related injury in adolescent and youth has been documented in a number of studies, from Innsbruck 2012, the 2015 12th Winter European Youth Olympic Festival to the Lillehammer YOG 2016, with injury rates ranging from 10.9, 4.2 and 9.5 injuries per 100 athletes, and illness ranging from 8.4, 3.8 and 7.2 illnesses per 100 athletes, respectively.5–7
While injury and illness rates are slightly lower compared with the games at senior level,8–10 sports injuries in young athletes can impact negatively on current and future sport participation, physical activity (PA) levels and future health.11 12 Recent studies on long-term injury consequence in youth sport have found an increased risk for the development of osteoarthritis (OA) after joint injury, leading to lower PA participation and greater adiposity.12–15 At a time when 80% of children worldwide do not meet daily PA guidelines for health,16 establishing positive habits for an active lifestyle during adolescence is crucial to healthy physical and mental development as well as lifelong PA participation.17 Reducing sport-related injury/illness burden will help to reduce barriers to continued sport participation in young athletes, whether they are regular recreational exercisers, or have aspirations of a professional sporting career.
The aim of this study was to describe injury and illness characteristics among participating athletes during the Lausanne 2020 Youth Olympic Winter Games (YOG 2020).
Methods
We employed the IOC injury and illness surveillance system for multisport events in this prospective cohort study.18 All 79 National Olympic Committee (NOC) medical teams were asked to report the daily occurrence (or non-occurrence) of athlete injuries and illness from each of their teams, using an electronic report form (side module of the General Electric Athlete Management Solution; GE AMS). Concurrently, we retrieved information on injuries and illnesses of all athletes participating in the games from all competition and training venues and the athlete village polyclinics operated by the Lausanne 2020 Youth Olympic Winter Games Organizing Committee (LYOGOC). The LYOGOC data were also reported in electronic report forms in the GE AMS. Many NOCs with <10 athletes did not have medical staff that were able to contribute to the daily NOC reporting, hence data for these NOC athletes were collected primarily via LYOGOC.
All athlete injury and illness data were collated from the 14-day period of the Lausanne Youth Olympic Winter Games, from the opening ceremony on 9 January to the closing ceremony on 22 January 2020. Athlete attendance and participation during this period was biphasic whereby participation for five sports (alpine skiing, biathlon, figure skating, ski mountaineering, speed skating) occurred across the first week. This group of athletes then left the games and a new wave of athletes entered for the second week participating in the remaining 11 sports (bobsleigh, cross-country, curling, freestyle skiing, ice hockey, luge, Nordic combined, short track speed skating, skeleton, ski jumping and snowboard).
Implementation
The day before the opening of the games, we organised a medical meeting for all NOC medical staff to introduce the surveillance project, the aims of the study, procedures for data collection and to answer any questions. User accounts for the GE AMS were created and electronic tablet computers were also distributed to NOCs on which their medical staff were asked to complete their daily reports. Visits were also made to each LYOGOC athlete village polyclinic and competition/training venue medical clinics to ensure LYOGOC user access to the GE AMS.
Throughout the data collection period, we followed up with NOCs comprising >10 participating athletes (equating 91.5% of all participating athletes) and LYOGOC medical clinics to answer any questions and to encourage continuous reporting during the games. Additional NOC visits also took place during the teams’ athlete and staff change-over between the first and second week of the games. We recorded the response rates from each participating NOC with 10 or more athletes. At the end of the games, NOC team medical staff providing 100% daily response rates were allowed to keep their electronic tablet.
Definition of injury and illness
We defined injuries and illnesses as new (pre-existing, not fully rehabilitated conditions were not recorded) or recurring (where athletes had returned to full participation after the previous condition resolved) incurred in competition or training during the YOG 2020 and receiving medical attention, regardless of the consequences with respect to absence from competition or training.18 Overuse injuries were classified as gradual or sudden onset, acute injuries were grouped by contact or non-contact origins. Injury/illness severity was reported in days estimated absence, with severe injuries/illnesses defined as those with an estimated absence from training and/or competition of 7 days or more.19
Injury and illness report form
The electronic report form followed the same template as used in all games since Vancouver 2010,8–10 19 20 and was available in eight languages—English, French, German, Spanish, Russian, Chinese, Japanese and Korean. Accreditation number, sport and event, date of injury/illness and estimated time loss (TL) from competition or training were recorded. For injuries the anatomical location, injury type, anticipated cause and injury occurrence (eg, in training or competition), and for illnesses the affected system, main symptom(s) and cause, were also recorded.
Confidentiality
Confidentiality and anonymity of athlete information was ensured at all times. Athlete accreditation numbers were used only for the purposes of identifying duplicate injury/illness entries and for providing the athlete age. The database was deidentified immediately after the games.
Patient and public involvement
There was no patient involvement in design or implementation of the present study. We will invite patients and the public to help with dissemination of the study results.
Data analysis
In cases where an athlete injury or illness was reported by both NOC and Lausanne 2020 medical staff, the most complete record was retained. If an athlete suffered multiple injuries (eg, location and type) caused by a single injury event, only the most severe injury diagnosis was recorded, as determined by the research team based on available clinical data. The summary measure of injury and illness incidences (i) was calculated according to the formula i=n/e, where n is the number of injuries or illnesses in competition, training or in total during the study period, and e the respective number of exposed (participating) athletes, with incidence proportions presented as injuries/illnesses per 100 athletes with 95% CIs. Relative risk (RR) with 95% CI was reported between groups by Poisson regression model, assuming constant hazard per group and adjusting for sport, sex, age and/or NOC size, where appropriate (categories with >3 data points were not included for comparison). Significance was accepted at p<0.05. All analysis was conducted using SPSS V.23.0.
Results
In total, there were 1783 athletes (869 women: 49%; 914 men: 51%) from 79 NOCs participating in 22 sports, during the Lausanne 2020 Youth Olympic Winter Games. There were 97 double starters where athletes participated in two different sports and 32 triple starters where athletes participated in three different sports, equating 1944 athlete exposures. Athlete mean age was 16.6 years (SD 1.0) (women 16.5 years (1.1); men 16.8 years (1.0)).
Throughout the 14 days of the games, a total of 524 out of 532 reports were provided by 38 NOCs of >10 athletes, equating an overall response rate of 98.5% of daily expected returns (table 1).
Response rates, and injuries and illnesses in NOCs of different sizes
Injuries by sport and sex
There were 228 injuries in 208 athletes, with 16 athletes reporting two injuries and 2 athletes reporting three injuries (of the 208 athletes included there were eight unknown accreditations with the assumption that each of the unknown entries was one athlete with one injury). This equated 11.7% of all athletes reporting at least one injury or 11.7 injuries per 100 athlete exposures (95% CI 9.7 to 13.7). A total of 1575 athletes remained injury free.
Figure 1 describes the proportion of injuries by sport and severity. By sport, injury incidence was highest for snowboard slopestyle (38.5 injuries per 100 athletes (95% CI 25.2 to 51.7)) followed by bobsleigh (36.1 (95% CI 20.4 to 51.8)), snowboard big air (28.8 (95% CI 16.5 to 41.2)), ski slopestyle (28.8 (95% CI 16.5 to 41.2)), snowboard cross (24.1 (95% CI 12.7 to 35.5)) and ski cross (21.3 (95% CI 9.6 to 33.0)). Conversely, injury incidence was lowest for speed skating, snowboard halfpipe and curling (ranging 1.6–4.2 injuries per 100 athletes). No injuries were reported for ski jumping.
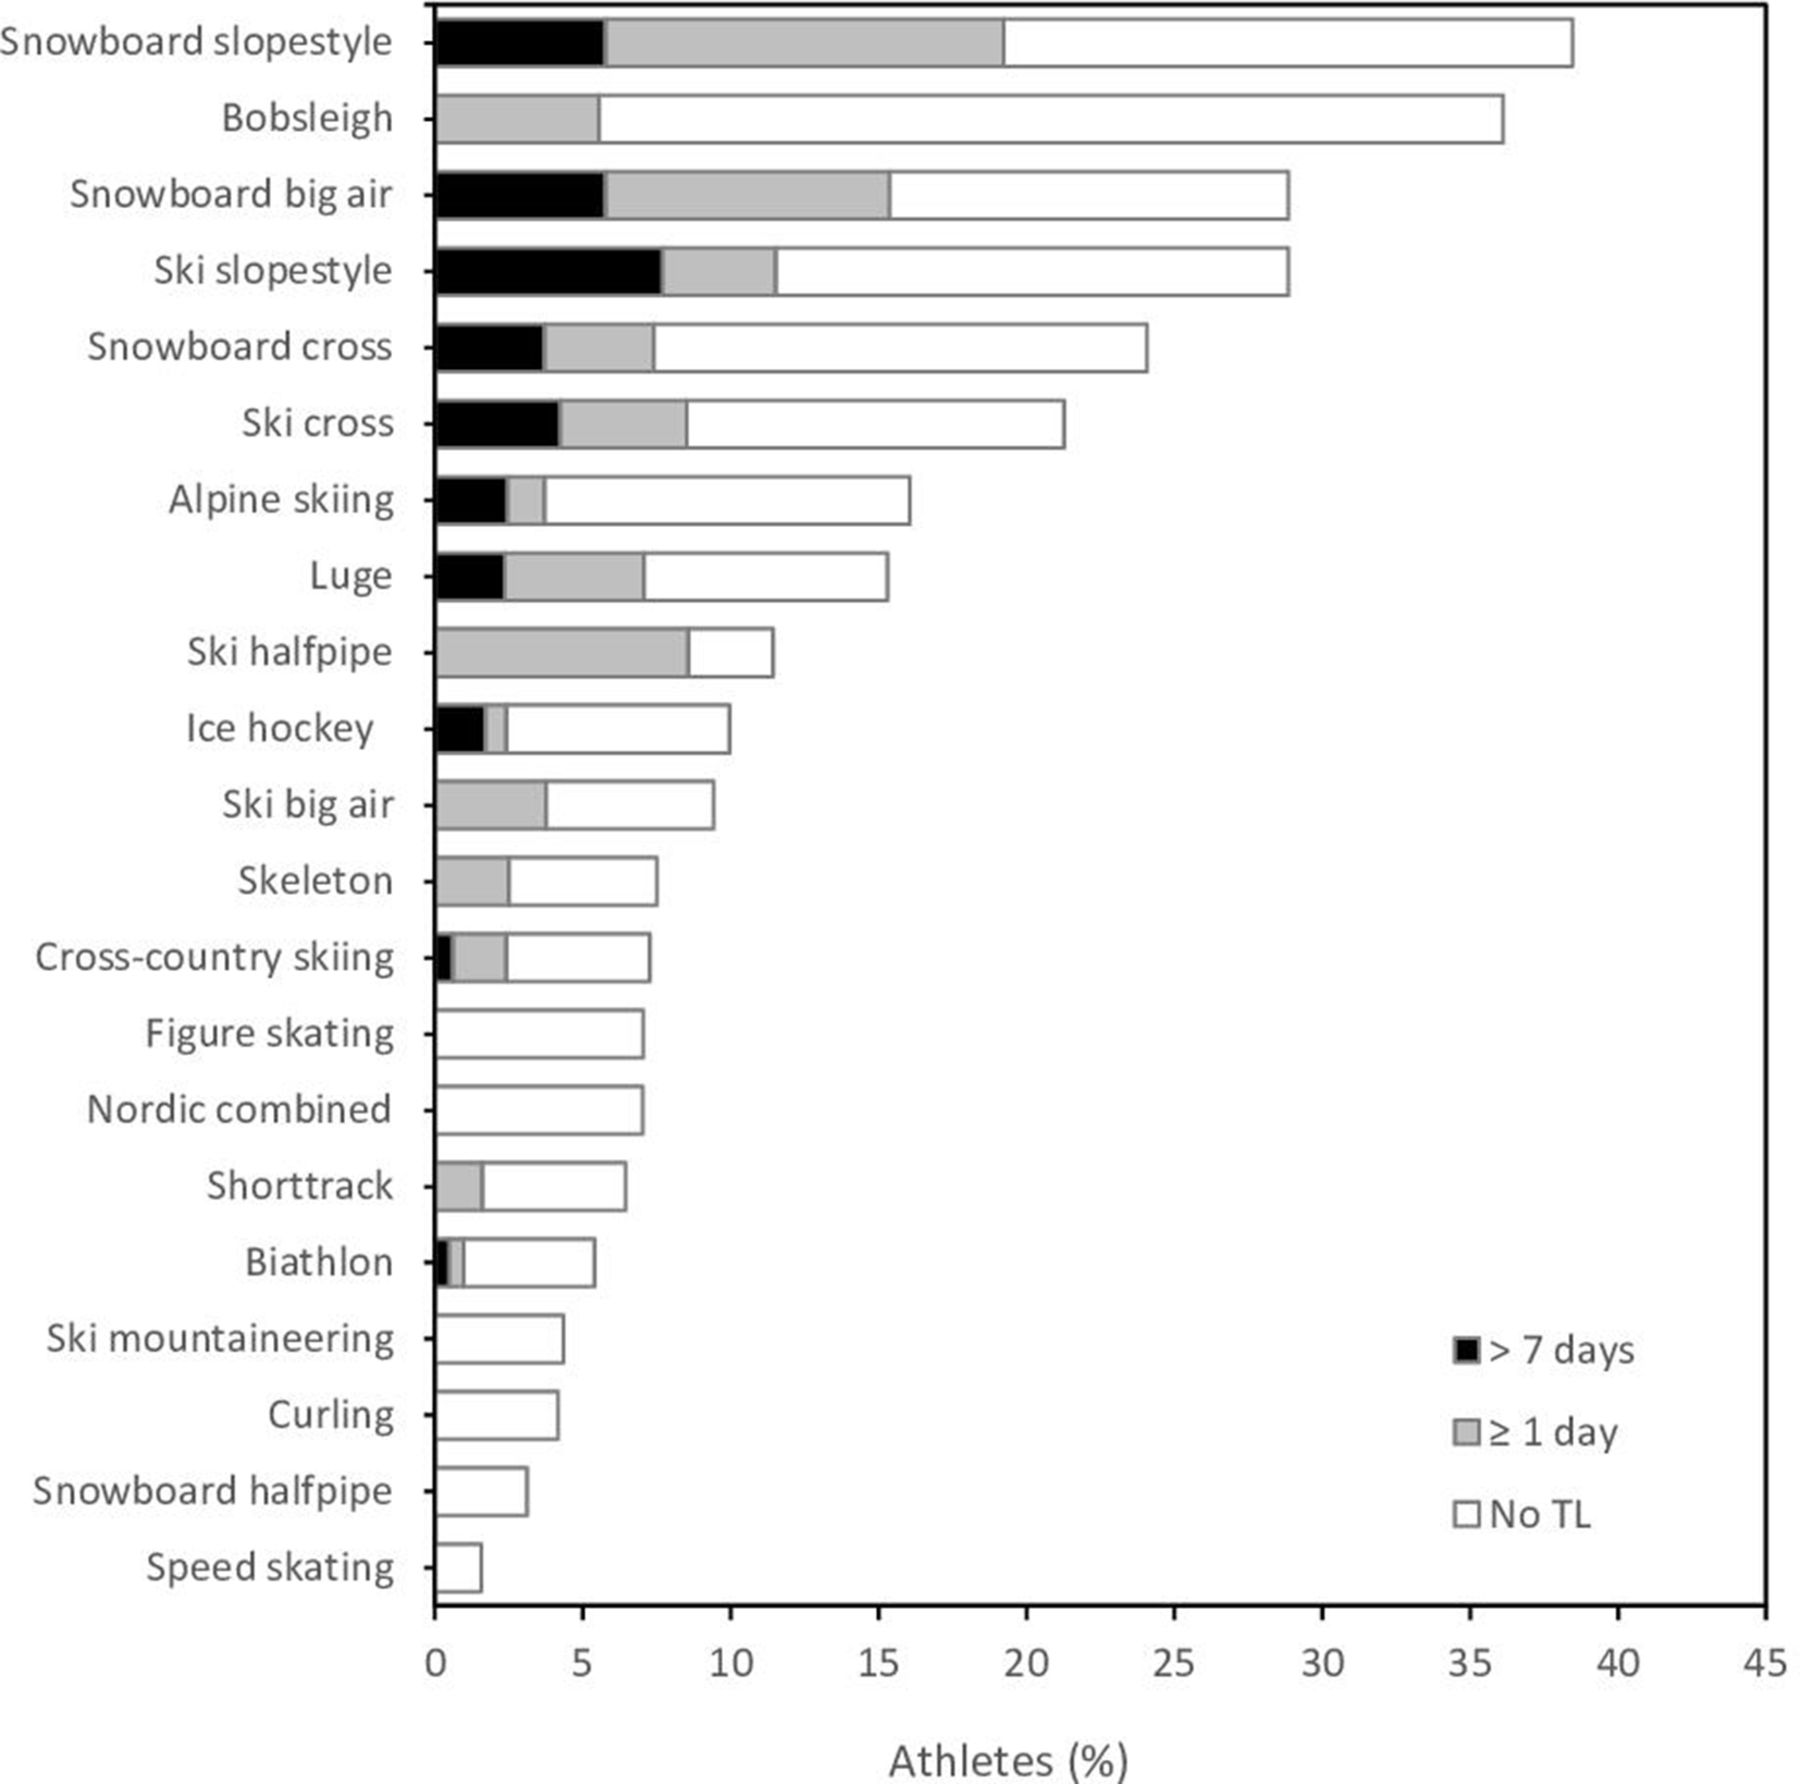
Proportion of athletes (%) in each sport with injury, with no time loss (TL), estimated TL >1 day and estimated TL >7 days.
When adjusting for NOC size and sport, the risk of injury was higher for female compared with male athletes with 13.8 injuries per 100 female athletes (95% CI 11.7 to 16.0) and 9.0 injuries per 100 male athletes (95% CI 7.2 to 10.8), RR 1.54 (95% CI 1.20 to 1.97), and this was significant for snowboard big air (RR 4.00 (95% CI 3.42 to 4.58)), snowboard slopestyle (RR 2.33 (95% CI 1.93 to 2.74)) and ice hockey (RR 1.55 (95% CI 1.25 to 1.86)). Additional details on injury incidence by sport are available in online supplemental appendix 1.
Supplemental material
Severity of injuries
Overall there were 1145 total days lost due to injury. Just over two-thirds (69.3%; n=158) of injuries were reported to result in no TL, while the remainder (30.7%; n=70) were expected to prevent the athletes’ ongoing participation in competition and/or training. Of these 70 injuries, it was estimated that 59% (n=41) would result in an absence from sport between 1 and 7 days and 41% in an absence of more than 7 days (n=22 8–28 days’ absence; n=7 >28 days’ absence). The severity of injury did not differ between female (no TL: 70.8%; 1–7 days: 16.8%; >7 days: 12.4%) and male athletes (68.1%; 18.7%; 13.2%). By sport, the proportion of injuries resulting in absence was highest in snowboard slopestyle (18.3%), snowboard big air (14.4%) and ski slopestyle (10.8%), and proportion of severe injuries (>7 days) highest in ski slopestyle (7.2%), snowboard slopestyle (5.5%) and snowboard big air (5.4%) (figure 1). Box 1 presents the details of the 29 injuries classified as ‘severe’.
Information on 29 severe injuries (estimated absence >7 days), with the sports with the highest numbers in brackets
15 fractures (3 lower leg, 2 ankle, 2 thumb, 1 each chest, foot/toes, forearm, hand, head, knee, shoulder, wrist): ski slopestyle (3), ski cross (2), snowboard big air (2), snowboard cross (2), alpine skiing (2), luge (2), biathlon (1), ice hockey (1).
5 ligaments (3 knee, 1 shoulder, 1 thumb): alpine skiing (2), ice hockey (2), ski slopestyle (1).
6 concussions: ice hockey (2), snowboard (big air 1; slopestyle 3).
2 contusions (2 thigh): ice hockey (2).
1 laceration (hand): cross-country skiing.
Location and type of injuries
The most common injured anatomical location was the knee (12%; n=28) followed by the head (11%; n=24), hand (9%; n=21) and lumbar spine (8%; n=18). The most frequent injury types were fracture (trauma, stress, other bone injuries) equating a quarter of all injuries (26%; n=59) followed by contusion, haematoma, bruise (16%; n=37) and sprain (dislocation/subluxation, ligamentous rupture) (12%; n=28). By specific diagnosis, concussion was most prevalent accounting for 8% (n=18) of all injuries, followed by knee ligament sprain (n=10), hand fracture (n=9) and thigh contusion (n=8) each accounting 4% of all injuries. The distribution of injury locations and injury types, by sport, is presented in online supplemental appendix 2.
Supplemental material
Causes, mechanisms and occurrence of injury
While 89% (n=203) of injuries were reported to be acute in nature, 8% (n=18) were reported to be recurrent and 3% (n=7) chronic. The majority of injuries were caused by contact (58% of all injuries), with the most commonly reported specific injury mechanism contact with a stagnant object accounting for 35% of all injuries, followed by contact with a moving object (12%), contact with another athlete (11%) and non-contact trauma (11%). Contact injury mechanisms were most prevalent in those sports with higher injury rates and higher severity of injuries, such as snowboard big air, ski slopestyle and snowboard cross.
Just over half of all injuries (53%) occurred during competition with 46% occurring in training (for three injuries occurrence during competition or training was unknown), and there was no difference between the severity of injuries occurring in competition or training (online supplemental appendix 1). Competition injuries were more prevalent compared with training injuries in snowboard cross (RR 3.33 (95% CI 2.70 to 3.96)), cross-country skiing (RR 3.00 (95% CI 2.34 to 3.66)), ice hockey (RR 2.73 (95% CI 2.38 to 3.07)) and snowboard big air (RR 2.00 (95% CI 1.49 to 2.51)). Conversely, competition injuries were less common compared with training injuries in biathlon (RR 0.38 (95% CI 0.0 to 1.04)) and luge (RR 0.63 (95% CI 0.08 to 1.17)), although these were not significant.
Illnesses by sport, sex and severity
There were 167 illnesses reported in 162 athletes, with five athletes each reporting two illnesses (the 162 athletes include eight unknown accreditations, with the assumption that each of the unknown entries was one athlete with one illness). This equated to 9.1% of all athletes reporting at least one illness or 8.6 illnesses per 100 athlete exposures (95% CI 6.8 to 10.3). A total of 1621 athletes remained illness free during the games.
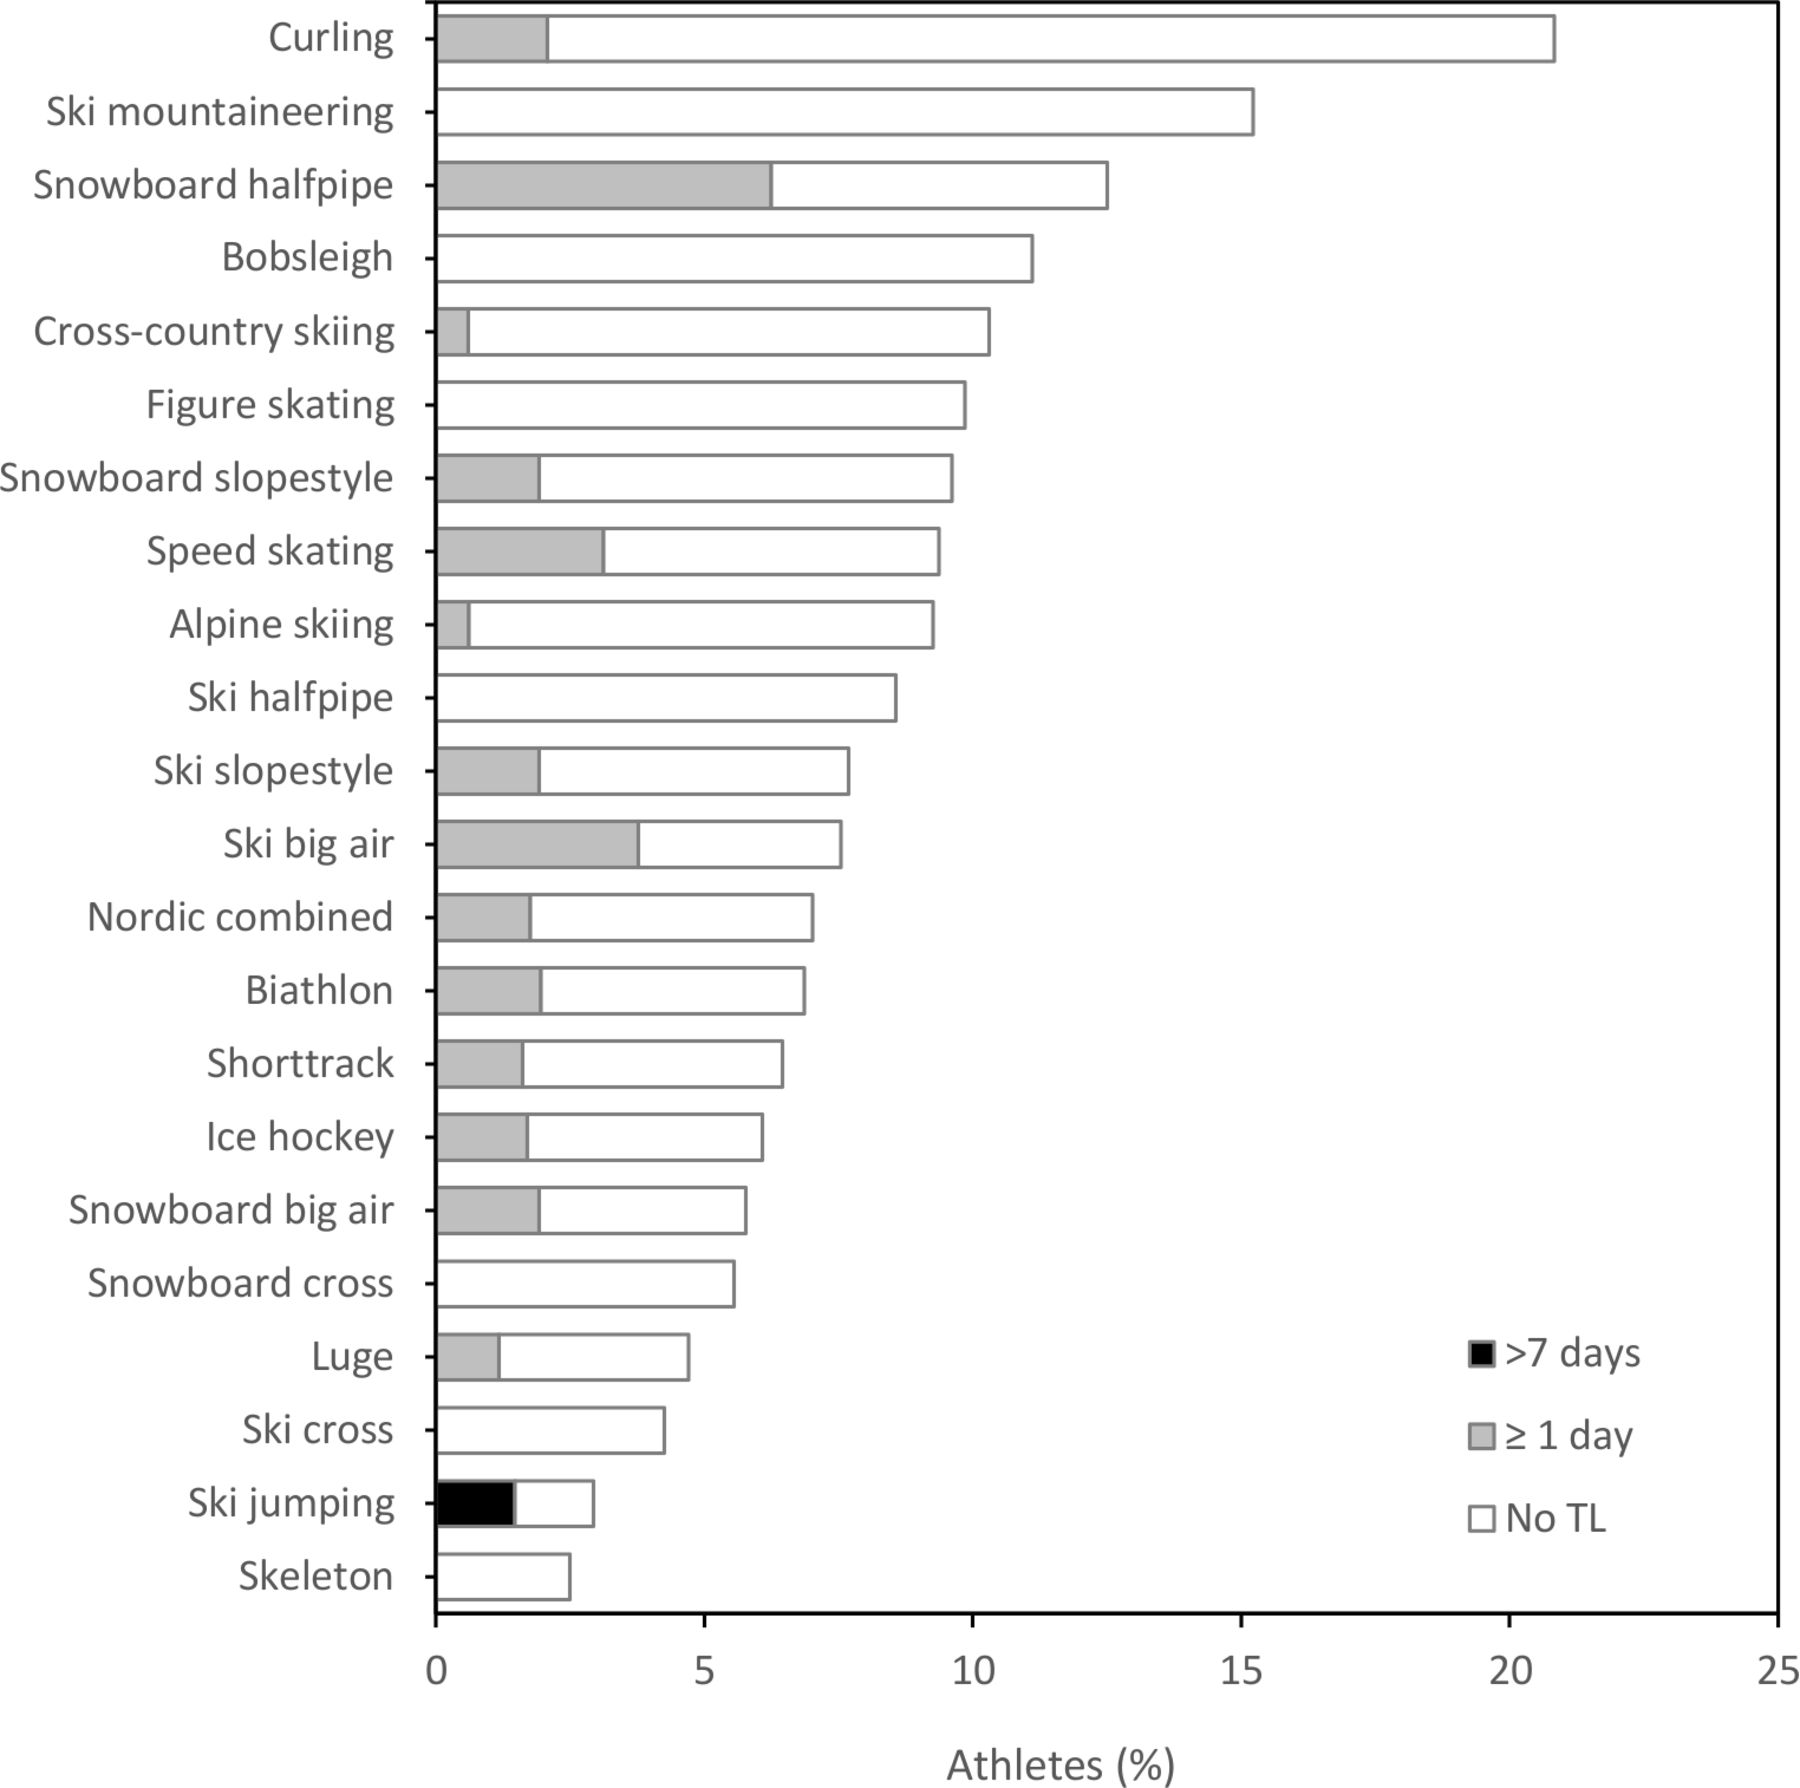
Figure 2 describes the proportion of illness by sport and severity. By sport, illness incidence was highest for curling (20.8 illnesses per 100 athletes (95% CI 18.3 to 23.4)), followed by ski mountaineering (15.2 (95% CI 13.0 to 17.5)), snowboard halfpipe (12.5 (95% CI 10.4 to 14.6)), bobsleigh (11.1 (95% CI 9.2 to 13.1)), cross-country skiing (10.3 (95% CI 8.4 to 12.2)) and figure skating (9.9 (95% CI 8.0 to 11.7)). Conversely, illness incidence was lowest for skeleton, ski jumping and ski cross (ranging 2.5–4.3 illnesses per 100 athletes).
Proportion of athletes (%) in each sport with illness, with no time loss (TL), estimated TL >1 day and estimated TL >7 days.
When adjusting for NOC size and sport, the risk of illness was higher for female (10.2 illnesses per 100 female athletes (95% CI 8.3 to 12.0)) compared with male athletes (6.5 illnesses per 100 male athletes (95% CI 4.9 to 8.0)), RR 1.57 (95% CI 1.15 to 2.10), and this was significant for biathlon (RR 1.77 (95% CI 1.23 to 2.30)), cross-country skiing (RR 1.52 (95% CI 1.05 to 1.99)) and ice hockey (RR 1.49 (95% CI 1.10 to 1.89)). Additional details on illness incidence by sport are available in online supplemental appendix 3.
Supplemental material
Overall there were 85 total days lost due to illness. The majority of illnesses (82.6%) were not expected to result in any TL, while the remainder were expected to prevent the athletes’ ongoing participation in competition and/or training (1–7 days: 16.8%; >7 days: 0.6%). Illness severity did not differ between male and female athletes.
Affected system, main symptoms and causes of illness
The respiratory system accounted for almost two-thirds (64%) of all athlete illnesses and digestive system illness a quarter of all illnesses (24%). Sore throat (34% of all illnesses), nasal congestion (19%), cough (19%) and fever (13%) were the most prevalent illness symptoms. Infection was the most common cause of athlete illness (54%), followed by environmental (22%) and pre-existing condition/allergy (16%). The distribution of affected systems and causes of illness, by sport, is presented in online supplemental appendix 4.
Supplemental material
Data sources, and injuries and illnesses per NOC size
The majority of athlete injuries and illnesses were reported by their NOC (50%–77%, respectively) and then by LYOGOC (28%–15%), with 22% of injuries and 8% of illnesses recorded by both (table 1). There was no relationship between NOC size and the rate of athlete injury (when adjusting for sport and sex), however there was a positive relationship for the prevalence of illness, with the rate of illness for NOCs with >99 athletes 10.6 per 100 athletes compared with 3.2 illnesses per 100 athletes in NOCs with <10 athletes (RR 3.66 (95% CI 1.31 to 10.23)).
Discussion
This study described injury and illness characteristics among participating athletes during the Lausanne 2020 Youth Olympic Winter Games. Overall, 11.7% of athletes were injured and 9.1% of athletes ill during the games, and the rate and types of injuries and illnesses varied by sport and sex. The knee, followed by the head and hand were the most injured body locations, and respiratory system illness the most prevalent illness type.
Injury risk during YOG 2020
The rate of injury in the present study is similar to that observed at the previous Winter YOG Lillehammer 2016 (9.5 injuries per 100 athletes) and Innsbruck 2012 (10.9), but higher than at the 2015 Winter European Youth Olympic Festival (W-EYOF) (4.2).5–7 It is also similar to the recent senior Winter Games in PyeongChang 2018 (12.6) and Vancouver 2010 (11.2),8 10 although lower compared with Sochi 2014 (14.0).9
It is well documented that the rate of injury varies across different sports in Olympic Games (OG) studies. Hence, the variation in the overall rate of injury across YOG studies is likely influenced by that games’ sport programme. For example, while freestyle skiing and snowboarding presented among the highest injury rates in the current study, these sports (except for snowboard cross) were not included in the W-EYOF 2015.6 During YOG 2016 snowboard big air was also not part of the competitive programme.7
Changes in the rates of injury across OG may also be due to true changes in the rate of injury within some sports. For example, while injury rates for most sports during YOG 2020 remained similar compared with YOG 2016, the rates of injury in snowboard slopestyle, bobsleigh and ski slopestyle were 2.7, 2.6 and 2.0 times higher, respectively.7 The overall rates of injury in these sports were also higher than those seen in previous senior Olympic and World Cup studies.10 21 22 By severity, the majority of injuries in bobsleigh did not result in TL, however a significant proportion of injuries in snowboard and ski slopestyle did. By sex, injuries in women were higher compared with male athletes, which appeared mediated largely through the significantly higher injury rates in women than men in snowboard big air and slopestyle, and ice hockey.
The snowboard and freestyle ski venue used during YOG 2020 is a well-established competition venue and regularly used by the International Ski Federation for senior events. Environmental factors such as snow and weather conditions, venue, track design, geometry of features including take-off and landing areas in these snowboard and freestyle skiing events have been observed to influence the rate of injury at senior level.9 10 23 Additional consideration may also be needed for youth competitions (eg, around qualification criteria, jump feature size), where physical stature, skill levels and speed at in runs may differ more widely between young athletes, as well as to that of senior athletes.
The majority of injuries in the present study were acute in nature, with contact mechanisms predominant. This confirms the pattern observed where the higher injury risk sports were sports characterised by a combination of factors such as speed, jumps and athlete to athlete or athlete to ground contact. In line with previous youth and senior sport injury studies, the knee followed by the head were the most commonly injured body locations, with concussion, knee ligament injuries and lower limb fractures being the most frequent and severe diagnoses, in freestyle skiing, snowboard events (with the exception of snowboard halfpipe) and ice hockey.5–7 21 22 24–28
The risk of concussion injury in some sports remains a concern at all ages and levels of participation, particularly in regard to longer term consequences on cognitive function and mental health.29 Previous concussion is known to increase the risk of future concussion30 and also future musculoskeletal injury risk,31 32 hence preventing these injuries in young athletes, some of whom will be at the start of professional sporting careers, will be of exponential benefit. Positively, concussion injury was lower (8% of all injuries; n=18) in the present study compared with YOG 2016 (11% of all injuries; n=11), and concussion rates almost halved in ice hockey, accounting for 22% of all concussions in YOG 2020 (six-team and mixed 3-on-3 formats, combined) compared with 42% at YOG 2016 (six-team and skills challenge formats, combined).7 The latter results are also in line with decreasing concussion rates observed in senior international ice hockey tournaments.33 In contrast, an increase was observed in snowboard which accounted for 44% (n=8) of all concussion injuries during YOG 2020 (vs 18% in YOG 2016) with female rates higher than male’s (n=6 vs n=2).7 While concussion is a frequent diagnosis within snowboard and freestyle skiing in other youth and senior studies,25 27 it should not be accepted as a natural consequence of participation in the sport. For young athletes, the suitability of competition venues may again require closer assessment, and any increasing occurrence at youth level, in particular for female athletes who may respond to concussions differently than men,34 35 should be more closely monitored. Treatment of concussions should also be reviewed. In the present study, two-thirds of concussion injuries were reported to result in <7 days’ absence. If standard concussion return-to-play (RTP) protocols are followed, 7 days should be the minimum time prior to return to normal activity. Employing diagnosis, prevention, treatment and RTP guidelines, as outlined in the recent concussion injury consensus statement, is key.36
Significant knee joint injury in skeletally immature young athletes should also be of concern. Studies suggest youth ACL injuries account for around 11% of all sports injuries among adolescents (13–17 years),37 and almost one in every three to four young patients who sustain an ACL injury goes on to sustain a second one. Longer term, a 10-fold increased risk of, knee OA has been reported following significant knee joint injury in youth, leading to lower PA participation, poorer quality of life (Knee injury and Osteoarthritis Outcome Score), poorer function (balance) and greater adiposity.12 14 15 38 Effective, evidence-informed prehabilitation and rehabilitation strategies around the knee should both be employed for primary and secondary injury prevention.
Illness risk during YOG 2020
The rate of illness in the present study, 8.6 illnesses per 100 athletes, was similar to that observed at the YOG 2016 (7.2) and YOG 2012 (8.4),5 7 higher than at the W-EYOF 2015 (3.3%),6 and again similar to previous senior Winter Games (7.2–9.4).8–10 Although the severity of illness was lower with only one in five illnesses expected to result in any TL during YOG 2020, compared with one in three at YOG 2016, YOG 2012 and PyeongChang 2018 OG.7 10 In agreement with previous youth and senior games studies, curling presents the highest illness risk, and this was followed by the new sport ski mountaineering. There are currently no studies available on ski mountaineering illness for comparison, however as an endurance sport with athletes competing at high altitudes and with extensive cold dry air exposure, these findings are perhaps unsurprising and are analogous with other endurance winter sports and their mechanism of illness, as well described previously.7 10 39
Respiratory system illness was most common, and the illness risk higher for women compared with their male counterparts, in the present study, consistent with previous findings from both winter youth and senior OG,5 7–9 and regional Olympian studies from Great Britain, Australia and the USA.40–42 Illness risk was also greater for athletes within larger NOCs (>99 athletes) compared with the smaller NOCs (<10). Training loads, travel, exercise-induced immune suppression and poor nutrition are frequently cited as risk factors for illness in athletes.43–45 A study on Australian Olympians also found depression symptoms, higher perceived stress and low energy availability, the latter particularly in female athletes, were all significantly associated with an increased risk of illness.41 Targeted proactive illness prevention initiatives should focus on hand hygiene and use of hand gels, training/competition load, travel planning and female athlete nutrition. Additionally, team isolation strategies for ill athletes, particularly for larger NOCs/teams with higher athlete density populations living in the Olympic village, could also be beneficial. Acute infective illness can increase the risk of serious medical complications (eg, myocarditis). With four out of five of illnesses during YOG 2020 reported to result in no TL, in addition to prevention, illness treatment strategies should ensure adequate rest and recovery for those athletes who are symptomatic, for example, with a fever or other symptoms below the neck.46 47
Methodological considerations
The present study data collection methods, including definitions used, were conducted as in line with previous games surveillance studies since Vancouver 2010.8–10 19 20 Our study was planned before the recently published IOC consensus statement on recording of injury/illness and hence the refinement of categories, for example, ‘overuse’ to ‘repetitive’ have not been incorporated. It is proposed for future studies that amendments are made to the games’ surveillance methods to include recommendations from the new consensus.48
Throughout the 14 days of YOG 2020, we collected 98.5% of expected NOC injury and illness report forms (NOCs >10 athletes). Around three-quarters of all athlete injuries and illnesses occurring during the games were captured by NOC medical staff and remainder by LYOGOC staff, similar to that observed in previous Youth Summer Games.49 Again, diligent and motivated reporting by LYOGOC and NOC medical staff helped to provide both a good level of response and quality data. This high response and enhanced practitioner engagement were likely a combination of information received at the opening games’ medical meeting, follow-up communication and hands-on help with LYOGOC and NOCs during the games and the availability of the electronic report forms in seven languages.
It is important to note the results presented in some categories were affected by sparse data bias,50 and hence while the rate of injury and illness varied between sports, data numbers were too low in some categories (ie, male to female, training to competition) to provide reasonable accurate measures of risk across all disciplines.
Reflections
This is the largest Winter YOG study with over 1700 participating athletes. While it may not be possible to eliminate all injuries and illnesses in youth sports, it may be feasible to reduce the number and/or severity of some sport-related issues, whether through rule changes, education, equipment or course design, or intervention training programmes. Successful, effective injury risk reduction strategies have been employed previously in youth sport in rugby, ice hockey, field hockey and soccer.51–58
The experiences of young patients with ACL injuries tells a picture of a diminished chance of making it to elite level competition.59 We have often heard of the story of the friend, or young athlete, whose promising career was cut short by such an injury. The implications are stark, not just for the young athlete who has aspirations of a professional sporting career and competing at the OG, but also for longer term health of youth and adolescents.15 60 61 Proactive injury prevention strategies in young athletes should therefore focus on knee ligament injuries and concussion, while illness prevention initiatives focused on female athletes should be considered at future games.
As well as performance, preventing injury and illness in young athletes is key during a time when they are establishing lifelong, positive, active lifestyle behaviours. Reducing the burden of sport-related injury and illness will help to mitigate the barriers to continued sport participation in young athletes, while at the same time reducing inactivity and helping to safeguard their future health.62 63
Conclusions
The overall injury (11.7 injuries per 100 athletes) and illness (8.6 illnesses per 100 athletes) rates were similar compared with previous YOG. While the rate and characteristics of injuries and illnesses varied between sports and by sex, consistent patterns across multiple YOG are emerging. If addressed, changes in these areas of risk could have positive impacts on the health, well-being and performance of these young athletes.
What are the findings?
Overall, 12% of athletes sustained at least one injury and 9% of athletes at least one illness.
There was a 2–2.7-fold increase in injuries in snowboard slopestyle, bobsleigh and ski slopestyle compared with previous Youth Olympic Games.
Concussion and knee ligament injuries were most common.
Illnesses most frequently affected the respiratory system.
Female injury and illness rates were higher than male’s.
How might it impact on clinical practice in the future?
This study will help inform medical programmes, policy and planning of major youth sport events.
These data must inform the direction and focus of injury and illness prevention measures in youth sport at national and international levels.
Data availability statement
All data relevant to the study are included in the article or uploaded as supplemental information.
Ethics statements
Ethics approval
The study was approved by the medical research ethics committee of the Southeastern Norway Regional Health Authority (REK no. 67524), in line with previous youth and senior Olympic Games studies.
Acknowledgments
The authors would like to acknowledge the contribution and support of the LYOGOC staff throughout the different stages of this study. The authors also sincerely thank all the NOC medical staff contributing to the data collection: Belen Moreschi (Argentina), Carlee van Dyk (Australia), Joachim Westermeier (Austria), Thomas Hebenstreit (Austria), Lorenzo Dragonetti (Belgium), Iryna Maliovanaya (Belarus), Mateus Saito (Brazil), Kamelia Ignatova-Basheva (Bulgaria), Amandev Aulakh (Canada), Heather Clegg (Canada), Elwin Lau (Canada), Jami Boyd (Canada), Matias Ayal (Chile), Ying Cui (China), Petra Nosso (Croatia), Jiri Neumann (Czech Republic), Mikkel Ohrgaard (Denmark), Diego Garcia-German Vazquez (ESP), Jose-Maria Calvillo Roda (Spain), Ville Bister (Finland), Philippe Le Van (France), Mike Carmont (UK), Anne Hecksteden (Germany), Stratos Karetos (Greece), Chun Yan Wong (Hong Kong), Andras Tallay (Hungary), Szabolcs Toth (Hungary), Orvar Olafsson (Iceland), Andrea Serdoz (Italy), Atsushi Teramoto (Japan), Azamat Nurmatov (Kazakhstan), Hyunyong Kang (Korea), Liga Cirule (Latvia), Diana Baubiniene (Lithuania), Anouk Urhausen (Luxembourg), Emiel van Zeventer (the Netherlands), Knut Terje Lundstroem (Norway), Nat Anglem (New Zealand), Edyta Sleszycka (Poland), Dan Tanase (Romania), Alex Heath (South Africa), Andrey Litvinenko (Russia), Jocelyn Yong (Singapore), Bojan Ilijevec (Slovenia), Hanspeter Betschart (Switzerland), Stanislav Beli (Slovakia), Roman Fano (Slovakia), Thomas Torstensson (Sweden), Pingchun Yeh (Taiwan), Erdem Dogan (Turkey), Sviatoslav Gardetskyi (Ukraine), Jenna Street (USA).
References
Supplementary materials
Supplementary Data
This web only file has been produced by the BMJ Publishing Group from an electronic file supplied by the author(s) and has not been edited for content.
Footnotes
Twitter @DebbiePalmerOLY, @larsengebretsen, @CarrardJustin, @KarstenKnigste1, @debbiejmaurer, @lauren_zh, @TSoligard
Contributors All authors contributed to the study conception and design, data collection and interpretation. DP analysed the data and drafted the paper. All authors provided revisions and contributed to the final manuscript. DP is the guarantor.
Funding The IOC funded the data collection of the study.
Competing interests TS works as scientific manager in the Medical and Scientific Department of the IOC. LE is head of scientific activities in the Medical and Scientific Department of the IOC, and editor of the British Journal of Sports Medicine and Journal of Bone and Joint Surgery.
Provenance and peer review Not commissioned; externally peer reviewed.
Supplemental material This content has been supplied by the author(s). It has not been vetted by BMJ Publishing Group Limited (BMJ) and may not have been peer-reviewed. Any opinions or recommendations discussed are solely those of the author(s) and are not endorsed by BMJ. BMJ disclaims all liability and responsibility arising from any reliance placed on the content. Where the content includes any translated material, BMJ does not warrant the accuracy and reliability of the translations (including but not limited to local regulations, clinical guidelines, terminology, drug names and drug dosages), and is not responsible for any error and/or omissions arising from translation and adaptation or otherwise.