Article Text

Abstract
Objectives Although both physical inactivity and poor sleep are deleteriously associated with mortality, the joint effects of these two behaviours remain unknown. This study aimed to investigate the joint association of physical activity (PA) and sleep with all-cause and cause-specific mortality risks.
Methods 380 055 participants aged 55.9 (8.1) years (55% women) from the UK Biobank were included. Baseline PA levels were categorised as high, medium, low and no moderate-to-vigorous PA (MVPA) based on current public health guidelines. We categorised sleep into healthy, intermediate and poor with an established composited sleep score of chronotype, sleep duration, insomnia, snoring and daytime sleepiness. We derived 12 PA–sleep combinations, accordingly. Mortality risks were ascertained to May 2020 for all-cause, total cardiovascular disease (CVD), CVD subtypes (coronary heart disease, haemorrhagic stroke, ischaemic stroke), as well as total cancer and lung cancer.
Results After an average follow-up of 11.1 years, sleep scores showed dose-response associations with all-cause, total CVD and ischaemic stroke mortality. Compared with high PA-healthy sleep group (reference), the no MVPA-poor sleep group had the highest mortality risks for all-cause (HR (95% CIs), (1.57 (1.35 to 1.82)), total CVD (1.67 (1.27 to 2.19)), total cancer (1.45 (1.18 to 1.77)) and lung cancer (1.91 (1.30 to 2.81))). The deleterious associations of poor sleep with all outcomes, except for stroke, was amplified with lower PA.
Conclusion The detrimental associations of poor sleep with all-cause and cause-specific mortality risks are exacerbated by low PA, suggesting likely synergistic effects. Our study supports the need to target both behaviours in research and clinical practice.
- cohort study
- risk factor
- sleep
Data availability statement
Due to the personal nature of the health data collected from participants, no data are available to be shared.
Statistics from Altmetric.com
Introduction
Physical inactivity and poor sleep are two lifestyle behaviours adversely associated with all-cause, cardiovascular diseases (CVD) and cancer mortality.1–5 Both behaviours are complex, and their health effects are dependent on various characteristics. For example, health-related sleep characteristics include duration, quality and timing. Sleep duration has shown a curvilinear relationship (U-shaped) with all-cause, CVD and cancer mortality, with the lowest risk observed among those obtaining between 7–8 hours per night.1–3 6 Based on a Swedish cohort (n=70 973) with a 15-year follow-up, Bellavia et al suggested that a low physical activity (PA) level could exaggerate the detrimental association between inadequate sleep duration and all-cause and CVD mortality risk.6 Although sleep quality and timing (eg, snoring and chronotype) are also associated with all-cause and cause-specific mortality,7 to our knowledge, very few studies have examined the synergistic effect of PA and sleep quality on mortality while the results were incongruous.8 9 The lack of a standardised sleep measurement might hinder the investigation of sleep concerning health and the joint effects with other behaviours.3
Besides the independent health effects, different sleep characteristics have shown a potential joint effect on health outcomes. Poor sleep quality, in combination with either inadequate or excess sleep,7 10 is associated with increased mortality risk. Based on the Sleep Heart Health Study with an 11.4-year follow-up (n=4994), Bertisch et al found that only the combination of inadequate sleep duration and poor sleep quality was associated with incident CVD risk.11 This interaction between sleep characteristics, as well as the heterogeneity of the sleep characteristics chosen between studies, might produce less consistent results.3 12 Recently, Fan et al proposed a novel score integrating both duration, quality and timing into a single sleep measurement.12 They demonstrated its capacity to identify high-risk populations for incident CVD based on the UK Biobank cohort with an 8.5-year follow-up (n=385 292).
PA and sleep could be co-dependent and influence health conditions through related pathways.6 8 9 13–16 For example, PA might improve health outcomes through improving metabolic fitness (eg, reducing insulin resistance), maintaining a stable circadian rhythm and a healthy sleep pattern, and enhancing energy expenditure.8 14 15 Prolonged sleep duration may decrease the time available for PA due to the time-dependency between the two behaviours.6 Beyond their independent health effects, the potential joint effects of these two key behaviours remain largely unknown.17 We investigated the joint association of PA and a novel comprehensive sleep score with all-cause and subtype-specific CVD and cancer mortality risks.
Methods
The UK Biobank is a prospective cohort of 502 616 participants of adults aged 37–73 years, recruited from 22 centres across the UK between 2006 and 2010. Participants completed questionnaires, interviews, physical measurements at baseline assessments and consented to the use of their de-identified data and access to their national health-related hospital and death records. Detailed methods are described elsewhere.18
Outcomes
Date of death was obtained from death certificates through data linkage with national datasets from the National Health Service (NHS) Information Centre (England and Wales) and the NHS Central Register Scotland (Scotland). The cause of death (including both primary and contributory causes of death) was defined based on the International Classification of Diseases, 10th revision (online supplemental table S1). In short, total CVD was defined as diseases of the circulatory system, excluding hypertension, diseases of arteries and lymph. Total cancer was defined as neoplasms, excluding in situ, benign, uncertain or non-well-defined cancers. Three CVD subtypes and one cancer site which have been previously linked to sleep disorders in published systematic reviews were also defined: coronary heart disease, haemorrhagic stroke, ischaemic stroke and lung cancer.5 16 The censoring date was May 2020. Participants were followed up from the date of attendance at the recruitment centre to the date of death or censorship, whichever came first. The data linkage was updated two or three times per year.
Supplemental material
Exposures
PA was quantified using the modified short-form International Physical Activity Questionnaire, which assessed the duration and frequency of PA in leisure time.19 Weekly PA was summarised using weekly total metabolic equivalent task (MET), calculated by multiplying the MET value of activity by the number of PA hours per week. Based on the lower and upper limits of the WHO PA guideline,19 PA was categorised as low (0 to <600 MET-mins/week), medium (600 to <1200 MET-mins/week) and high (≥1200 MET-mins/week). Another no moderate-to-vigorous PA (MVPA) category was further defined to reflect the potential health benefits of insufficient PA compared with no MVPA.4 20
A novel healthy sleep score, comprising five sleep characteristics, was applied.12 Morning chronotype, adequate sleep duration (7–8 hours/day), not usually insomnia, no snoring, and no frequent daytime sleepiness, represented healthy sleep characteristics. Online supplemental table S2 provides a detailed questionnaire and definition of each item. Participants were scored from 0 to 5, according to their number of the healthy characteristics and were categorised into three groups: ‘healthy sleep’ (≥4 sleep score); ‘intermediate sleep’ (2–3 sleep score); and ‘poor sleep’ (≤1 sleep score). This score has been used in the UK Biobank to distinguish high-risk middle-aged populations for incident CVD.12 We generated 12 combined joint categories of PA and sleep accordingly (online supplemental table S3).
Covariates
To reduce the effect of potential confounding, demographics and contextual covariates were selected based on previous literature,3 12 15 and included age, sex, body mass index (BMI), socioeconomic status, vegetable and fruit intake, sedentary behaviour, mental health issues, cigarette smoking, employment status, alcohol consumption, and PA or sleep scores when applicable. Online supplemental table S4 describes the definitions in detail.
Statistics and data analysis
All tests were performed using SAS V.9.4 or R V.3.6.3 software and were two-sided. Descriptive statistics are presented stratified by the sleep score, while χ2 tests, analysis of variance and Kruskal-Wallis tests were conducted as applicable. Kaplan-Meier estimation, the scaled Schoenfeld residuals and supremum tests of functional forms were used to examine the proportional hazards assumption, although no noticeable violations were observed. We also performed models excluding 15 potential outliers with extreme values of confounding detected by the dfβ measure-based influence diagnostics. Since the effect sizes of all the effects were unaffected after exclusion (data not shown), the present analyses reserved them in all models.
Both the independent and joint association between PA and sleep scores with mortality were examined using Cox-proportional hazard models, with a high PA level, healthy sleep or the combination of both as the reference as applicable. Each of the described analyses started with a minimally adjusted Cox model including only age and sex as covariates (Model 1), and a second model additionally adjusted for socioeconomic status, employment status, BMI, cigarette smoking, vegetable and fruit intake, alcohol consumption, sedentary behaviour, mental health issues and PA or sleep scores when applicable (Model 2).3 12 15 In the sensitivity analysis, we further examined the potential synergistic effect between the two main exposures by performing additional analysis of both the additive and multiplicative interactions between the two primary exposures (PA and sleep).21
Results
For this study, participants were excluded if they had history of total CVD (n=30 696), total cancer (n=21 257) or both (n=2585) at baseline (online supplemental figure S1). Participants were also excluded if they had obstructive sleep apnoea history (n=1825), class III obesity (BMI ≥40 kg/m2) (n=7937), missing or unusable data on sleep characteristics (n=10 633), PA (n=35 754) or any confounders (n=10 737). We also excluded those who died from coronavirus disease (COVID-19) (either a primary or contributory cause) (n=235). To reduce the potential reverse causality,22 we further excluded those who died in the first 2 years of follow-up (n=902). The comparison between included and excluded samples was provided in online supplemental table S5. A total of 380 055 participants (55.9±8.1 years old, 55% women) were included in the present study. Among those, the average follow-up time was 11.1±1.2 years, with 15 503 all-cause deaths (4095 events from total CVD and 9064 from total cancer, including 1932 from coronary heart diseases, 359 from haemorrhagic stroke, 450 from ischaemic stroke and 1595 from lung cancer). Table 1 presents the characteristics of participants stratified by sleep scores. The majority (56%) of the participants had a healthy sleep, followed by having intermediate (42%) or poor sleep (3%), demonstrating the same distribution as the work by Fan et al.12 Individuals with different sleep categorisations had significant differences in all the covariates. Participants who were younger, women, thinner, faced less socioeconomic deprivation, had higher vegetable and fruit intakes, sat less, had no mental health issues, never smoked, were employed in non-shift work, drank less alcohol and had more PA, tended to have healthier sleep scores.
The Descriptive Statistics by Sleep Scores (n=380 055)
Independent association of exposures with mortality
Table 2 and online supplemental figure S2 shows the independent (and mutually adjusted) association of sleep scores and PA with mortality risks. There was a dose-response increase toward poorer sleep in mortality risks for all-cause, total CVD and ischaemic stroke. Relative to healthy sleep, with full adjustment for selected confounders and PA levels (Model 2), poor and intermediate sleep was associated with higher mortality risks for all-cause (HR, (95% CIs): 1.05 (1.02 to 1.09), for intermediate sleep; 1.23 (1.13 to 1.34), for poor sleep) and total CVD (1.09 (1.03 to 1.17), for intermediate sleep; 1.39 (1.19 to 1.62), for poor sleep). Poor sleep was further associated with ischaemic stroke mortality (1.94 (1.29 to 2.94)), while intermediate sleep was further associated with coronary heart diseases (1.16 (1.06 to 1.27)).
Compared with participants with a high PA level, those with all the other PA levels had an incrementally higher risk for all-cause mortality after full adjustment (1.05 (1.01 to 1.10), for medium level; 1.08 (1.02 to 1.14), for low level; 1.25 (1.20 to 1.31), for no MVPA, respectively). Those with no MVPA also had higher risks for all the other conditions except for haemorrhagic stroke (for total CVD, 1.31 (1.21 to 1.42); for total cancer, 1.16 (1.10 to 1.23); for coronary heart diseases, 1.35 (1.21 to 1.52); for ischaemic stroke, 1.38 (1.07 to 1.77); and for lung cancer, 1.35 (1.19 to 1.53)).
Joint association of exposures with mortality
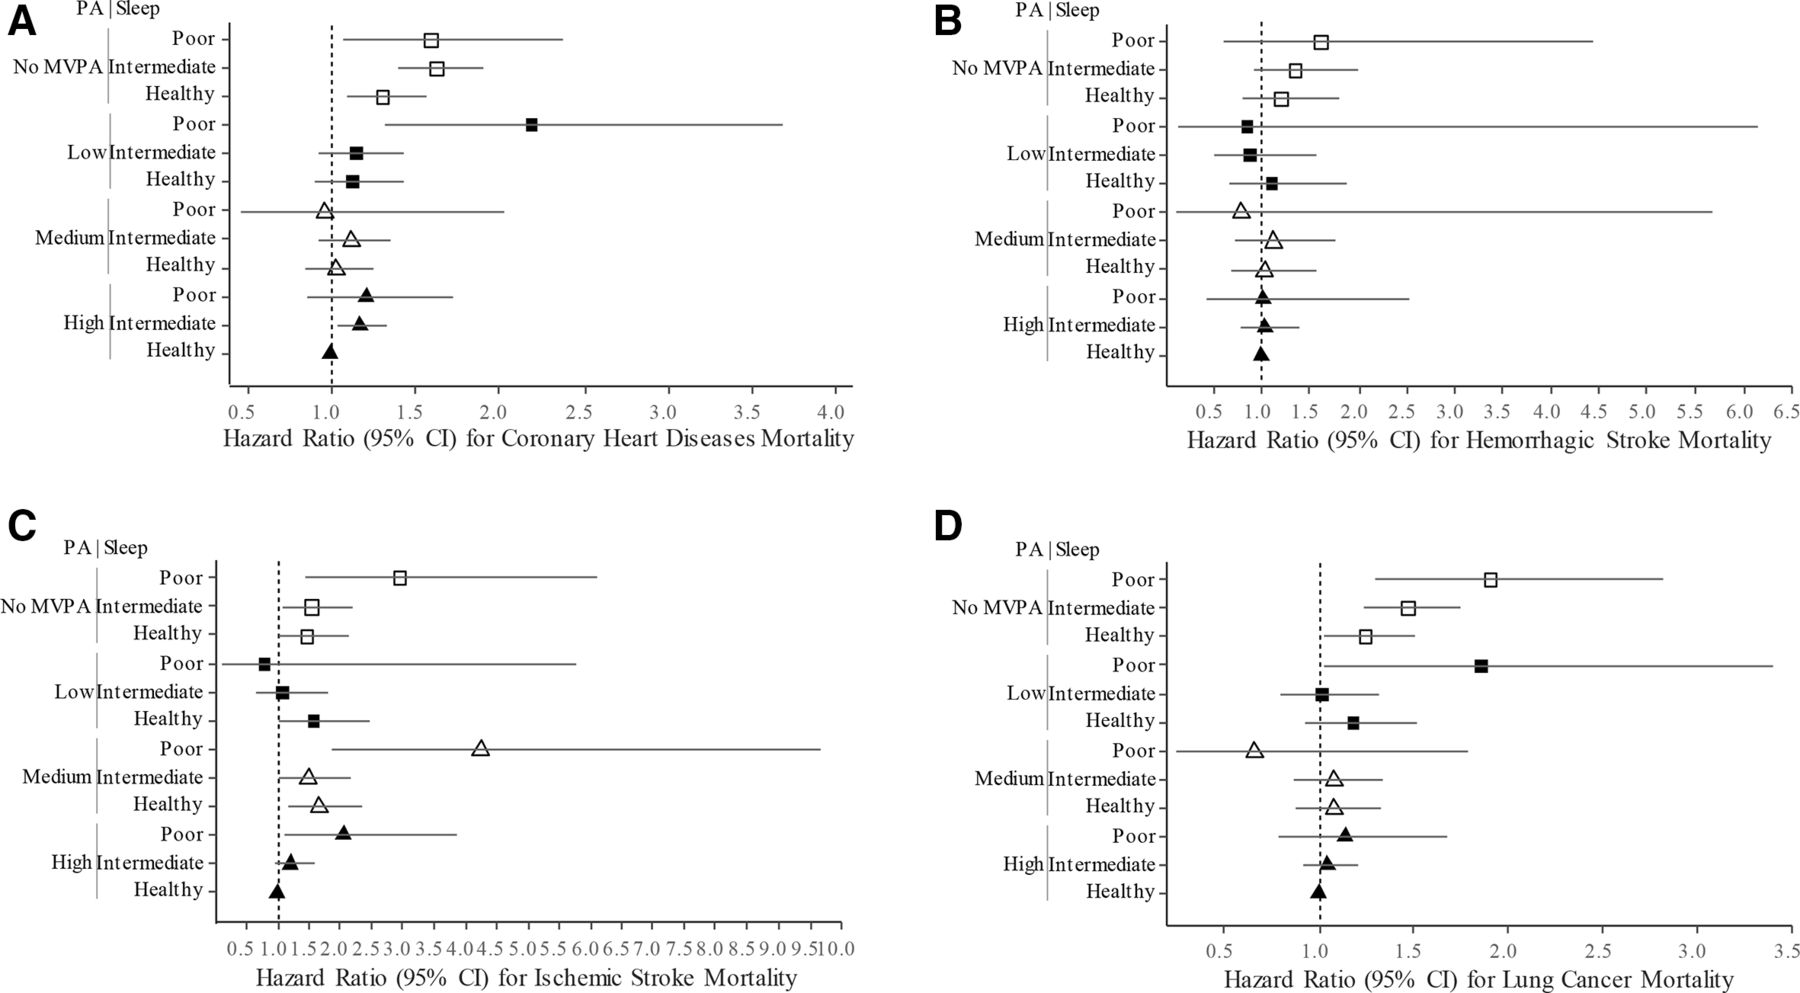
Figures 1 and 2, and online supplemental tables S6 and S7 illustrate the HR for each condition of exposure combinations compared with the referent high PA-healthy sleep group. After full adjustment, participants with no MVPA had higher mortality risks for all outcomes except for haemorrhagic stroke, while those mutually with poor sleep had the highest risks (for all-cause, 1.57 (1.35 to 1.82); for total CVD, 1.67 (1.27 to 2.19); for total cancer, 1.45 (1.18 to 1.77); for coronary heart diseases, 1.59 (1.07 to 2.37); for ischaemic stroke, 2.96 (1.43 to 6.11); and for lung cancer, 1.91 (1.30 to 2.81), respectively). Participants with low PA-poor sleep combination had higher mortality risks for all-cause, total CVD, coronary heart disease and lung cancer. In the sensitivity analysis, we found statistically significant additive interaction in total CVD, and multiplicative interactions in all the outcomes except for stroke (online supplemental tables S8 and S9).

The joint association of physical activity and sleep scores with mortality for all-cause, total cardiovascular disease and total cancer (n=380 055); (A) all-cause; (B) total cardiovascular disease; (C) total cancer. PA levels were categorised based on public health guidelines: no MVPA (those reported 0 MET-mins/week from MVPA, regardless of total MET-mins/week); low (<600 MET-mins/week); medium (600 to <1200 MET-mins/week); and high (≥1200 MET-mins/week). Sleep scores were categorised into: poor, 0~1; intermediate, 2~3; healthy, 4~5. Models were adjusted for age, sex, body mass index, socioeconomic status, vegetable and fruit intake, sedentary behaviour, mental health, cigarette smoking, employment status and alcohol consumptionand . MVPA, moderate-to-vigorous PA; MET, metabolic equivalent task; PA, physical activity.
The joint association of physical activity and sleep scores with mortality for subtype conditions (n=380 055); (A) coronary heart disease; (B) haemorrhagic stroke; (C) ischaemic stroke; (D) lung cancer. PA levels were categorised based on public health guidelines: no MVPA (those reported 0 MET-mins/week from MVPA, regardless of total MET-mins/week); low (<600 MET-mins/week); medium (600 to <1200 MET-mins/week); and high (≥1200 MET-mins/week). Sleep scores were categorised into: poor, 0~1; intermediate, 2~3; healthy, 4~5. Models were adjusted for age, sex, body mass index, socioeconomic status, vegetable and fruit intake, sedentary behaviour, mental health, cigarette smoking, employment status and alcohol consumption. Text tables. MVPA, moderate-to-vigorous PA; MET, metabolic equivalent task; PA, physical activity.
Discussion
To our knowledge, this is the first prospective study investigating the association of a composite score reflecting both sleep duration, quality and timing with mortality outcomes, as well as the largest investigation examining the joint effect of sleep and PA with all-cause and cause-specific mortality. The PA measurement in the UK Biobank captured frequency, intensity and duration (time) in the leisure-time domain. Our results suggest that, among middle-aged adults, poorer sleep, after adjustment for PA, remained associated with higher mortality risks for all-cause, total CVD and ischaemic stroke. Besides, there was a potential synergistic effect of sleep and PA with mortality risks for all-cause, total CVD, total cancer and lung cancer. Compared with no MVPA, levels of PA at or above the lower threshold recommended by WHO (600 MET-mins/week),23 appeared to eliminate most of the detrimental associations of poor sleep and mortality.
Comparison with other studies
Sleep duration, quality and timing are inter-related dimensions of healthy sleep characteristics.7–12 16 Previous meta-analyses and systematic reviews based on single sleep characteristics provided mixed results in relation to poor sleep and all-cause mortality risk.3 24 Yin et al suggested that inadequate sleep duration (shorter or longer than 7 hours/day) was associated with all-cause mortality risk (pooled relative risk, RR: 1.06 (1.04 to 1.07) per hour reduction for short sleepers, and 1.13 (1.11 to 1.15) per hour increment for long sleepers).24 Alternatively, Kwok et al proposed that only long sleepers (≥8 hours/day) but not short sleepers (<7 hours/day) had a higher risk for all-cause mortality (eg, pooled RR: 1.14 (1.05 to 1.25) for 9 hours sleeper) compared with healthy sleepers (7 hours/day), while sleep quality showed no significant association with mortality risk (pooled RR: 1.03 (0.93 to 1.14)).3 With a multicomponent sleep characteristic score, the present study shows that people with poor or intermediate sleep, with adjustment for PA, still had a 23% or 5% higher risk for all-cause mortality and a 39% or 9% higher risk for total CVD mortality (table 2). As poor sleep was further associated with 94% higher mortality risk for ischaemic stroke but not for haemorrhagic stroke, our finding extends the work by Fan et al, which did not distinguish the subtypes of stroke.12 The adverse health effects of poor sleep remain even within participants with a high PA level (figure 1). Besides, our results indicate that not participating in any MVPA could result in 16%–38% higher mortality risks for all-cause, total CVD, total cancer and the subtypes (table 2). In agreement with a previous prospective study and public health guidelines,4 20 our finding suggested that a below-guideline MVPA level could be beneficial.
The independent (and mutually adjusted) associations of physical activity and sleep scores with mortality (n=380 055)
Recent studies have suggested the synergistic health effect of physical inactivity and poor sleep.6 8 9 15 17 Cassidy et al reported that people with CVD or type 2 diabetes tended to simultaneously report physical inactivity and poor sleep, based on a cross-sectional analysis of the same cohort as the present study.15 In a 15-year follow-up of a Taiwanese cohort (n=341 248), short sleep duration (defined as <6 hours) increased all-cause and CVD mortality risk only among physically inactive participants (<450 MET-mins/week).9 Wennman et al found that the combination of insufficient sleep duration (≤6 hours) and low leisure-time PA (<450 MET-mins/week) was associated with higher mortality risks for all-cause (HR: 1.49 (1.05 to 2.11)) and CVD (HR: 1.98 (1.25 to 3.12)), compared with the referent combination of adequate sleep (6.5–8.5 hours) and high leisure-time PA (≥450 MET-mins/week), based on a male cohort comprising 60% of former elite athletes with a 26-year follow-up (n=1638).8 However, the same study also suggested no synergistic effect of sleep quality and PA on mortality. Likewise, Xiao et al found no significant relative excess risk of insufficient sleep (<7 hours) and low MVPA (<1 hour/week) for all-cause mortality, based on a large US cohort with a 14-year follow-up (n=239 896).25 The present study extended the findings from the above studies by capturing different perspectives of sleep and death causes. Compared with those with the high PA-healthy sleep combination, participants with the no MVPA-poor sleep combination had higher mortality risks (eg, 57% for all-cause; 67% for total CVD; 45% for total cancer). Moreover, the detrimental effect of poorer sleep with mortality risks could potentially be exaggerated among participants with lower PA levels (figures 1 and 2; online supplemental table S6–S9).
Several explanations of the deleterious associations of poor sleep with health have been put forward,6 8 9 15 16 although none of them has been widely established. In particular, the mechanisms surrounding the deleterious associations of prolonged sleep duration with mortality outcomes are controversial.5 One possibility is that these associations are not causal and are due to residual confounding, for example, fatigue, sleep fragmentation, substance use or undiagnosed mental disorders.26 Another hypothetical mechanism is that prolonged sleep duration might compromise the time available for health-enhancing behaviours such as PA.15 In the present sample, however, the average total PA volume was not very different in prolonged sleepers compared with those in the adequate sleep range (adequate vs prolonged sleep: 43.0 vs 42.2 MET-hours/week), despite the large difference in average sleep times between the two groups (adequate vs prolonged sleepers: 7.4 vs 9.3 hours). We used a composite sleep score that relied on self-reported data and did not allow us to incorporate time sequence or patterns of the sleep-related behaviours in this study.27 Future studies featuring wearable devices that measure sleep and physical activity will shed further light on the time-dependent aspects of these behaviours and their impact on health. Although an emerging body of evidence suggests that excessive PA might worsen sleep and potentially increase cardiovascular health risks,28–30 the proportion of high PA (≥1200 MET-mins/week) in the present study was higher in those with the healthiest sleep score (table 1). Our results also showed that, among participants with PA higher than the upper limit of the WHO guideline (1200 MET-mins/week),23 PA may attenuate the deleterious effects of poor sleep. However, in populations at the very top end of the activity spectrum, for example, athletes, excessive PA might compromise sleep.28 The combination of very high PA and poor sleep could, in the long-term, even increase the risks for injuries and infections.30 As the point past which PA might be harmful is unknown,29 we acknowledge that our results may not be applicable to extremely active populations.
Study strengths and limitations
The strengths of the present study include the prospective study design with large sample size and long follow-up and extensive measurement of covariates, which allowed us to perform several sensitivity analyses to strengthen our interpretation. The novel sleep score integrating various aspects of the sleep characteristics provides a convenient yet thorough way for investigating the joint effects of sleep with other time-dependent behaviours like PA. Our study had some potential limitations. First, the observational nature of our data precludes a definitive causal interpretation of our findings, although we took several measures to minimise risks for reverse causalities and confounding, such as exclusion criteria and a wide range of covariates included. Second, our exposures were measured by self-reported, random measurement error may have biased results toward the null, and thereby underestimating the true magnitude of the associations. Third, all the exposures and confounders were collected at recruitment and were assumed to be relatively constant over the course of the follow-up period. In a UK Biobank subsample with at least one repeated measurement of both exposures over a 7-year follow-up (n=35 466), 59% and 68%of the participants maintained their PA and sleep, respectively. Future studies investigating changes of the two behaviours over time will further elucidate the synergistic effects of the two behaviours. Fourth, the PA measurement of the UK Biobank did not include other domains like occupation, transportation and household.15 31 The relatively low sample size in some joint groups (eg, the low PA-poor sleep combination) may have compromised our statistical power to detect the differences in risk. Lastly, the UK Biobank had a response rate of 5.5%, and it is not representative of the UK population.32 However, a recent UK Biobank study showed that poor representativeness does not materially affect the associations of physical activity and other lifestyle behaviours with mortality.33
Conclusions
Poor sleep was associated with a higher risk for all-cause and cause-specific mortality, and these risks were markedly exacerbated among participants with insufficient PA. Meeting the lower threshold of the current PA guidelines (600 MET-mins/week) eliminated most of the deleterious associations of poor sleep with mortality. Our results support the value of interventions to concurrently target PA and sleep to improve health. Future prospective studies with device-based sleep and PA assessments and trials concurrently targeting both behaviours are warranted.
Key messages
What are the findings?
Among middle-aged UK adults without obstructive sleep apnoea history or class III obesity, physical activity (PA) at levels at or above the WHO guideline (600 metabolic equivalent task mins/week) threshold eliminated most of the deleterious associations of poor sleep with mortality.
How might it impact on clinical practice in the future?
As emerging evidence supports a synergistic effect of sleep and PA on health outcomes, future trials concurrently targeting both behaviours are warranted.
Data availability statement
Due to the personal nature of the health data collected from participants, no data are available to be shared.
Ethics statements
Patient consent for publication
Ethics approval
The UK Biobank has ethical approval by the National Research Ethics Service (Ref 11/NW/0382).
Acknowledgments
The authors gratefully thank all the participants and professionals contributing to the UK Biobank.
References
Supplementary materials
Supplementary Data
This web only file has been produced by the BMJ Publishing Group from an electronic file supplied by the author(s) and has not been edited for content.
Supplementary Data
This web only file has been produced by the BMJ Publishing Group from an electronic file supplied by the author(s) and has not been edited for content.
Footnotes
Twitter @BoHuei_Huang, @mitchjduncan, @ma_hamer, @M_Stamatakis
Contributors MJD, PC, NN, MH and ES contributed to the conception and design of the work. B-HH performed all analyses and drafted and re-drafted the manuscript several times. ES re-drafted parts of the manuscript and supervised all aspects of the project. All authors revised the manuscript critically and approved the final version to be submitted.
Funding ES is funded by a National Health and Medical Research Council (NHMRC) Leadership 2 Fellowship (APP1194510). MJD is supported by a Career Development Fellowship (APP1141606).
Disclaimer The funding sources had no involvement in study design; in the collection, analysis and interpretation of data; in the writing of the report; or in the decision to submit the article for publication.
Competing interests None declared.
Provenance and peer review Not commissioned; externally peer reviewed.
Supplemental material This content has been supplied by the author(s). It has not been vetted by BMJ Publishing Group Limited (BMJ) and may not have been peer-reviewed. Any opinions or recommendations discussed are solely those of the author(s) and are not endorsed by BMJ. BMJ disclaims all liability and responsibility arising from any reliance placed on the content. Where the content includes any translated material, BMJ does not warrant the accuracy and reliability of the translations (including but not limited to local regulations, clinical guidelines, terminology, drug names and drug dosages), and is not responsible for any error and/or omissions arising from translation and adaptation or otherwise.