


Abstract
Few modifiable risk factors for type 2 diabetes have been documented in the high-risk population of US black women. The authors used data from 45,668 black women aged 21–69 years, followed biennially from 1995 to 2005 in the Black Women's Health Study, to estimate incidence rate ratios for type 2 diabetes comparing various levels of physical activity and television watching. Cox proportional hazards models were used to control confounding factors. During 10 years of follow-up, 2,928 incident cases of type 2 diabetes were identified. Vigorous activity was inversely associated with type 2 diabetes risk (Ptrend < 0.0001); the incidence rate ratio for ≥7 hours per week was 0.43 (95% confidence interval (CI): 0.31, 0.59) relative to no activity. Brisk walking for ≥5 hours per week was associated with reduced type 2 diabetes risk (incidence rate ratio = 0.67, 95% CI: 0.49, 0.92) relative to no walking. Television watching was associated with an increased type 2 diabetes risk: The incidence rate ratio was 1.86 (95% CI: 1.54, 2.24) for ≥5 hours relative to <1 hour of television per day, independent of physical activity. These observational data suggest that black women might reduce their risk of developing type 2 diabetes by increasing their time spent walking or engaged in vigorous physical activity and by limiting television watching.
Type 2 diabetes has reached epidemic proportions in the United States and affects an estimated 20.6 million people (1, 2). The burden of this disease is particularly large among African-American women, among whom the prevalence is almost twice that of non-Hispanic whites (2). Although epidemiologic studies support a role for physical activity in preventing type 2 diabetes (3–15), there has been little attention focused on the impact of this factor in the high-risk population of African-American women. A recent randomized clinical trial (Diabetes Prevention Program) showed that an intensive lifestyle modification (healthy diet and moderate physical activity of 30 minutes a day for 5 days a week) reduced the incidence of type 2 diabetes by 50% as compared with placebo (10). We undertook to examine how the actual levels of physical activity in a large population of African-American women were related to type 2 diabetes incidence. With detailed questionnaire data collected every 2 years from over 40,000 women in the Black Women's Health Study (BWHS), we were able to assess the influence of vigorous activity, walking, and television watching on the incidence of type 2 diabetes in black women.
MATERIALS AND METHODS
The BWHS, a collaborative project of Boston University and Howard University, is an ongoing prospective follow-up study of African-American women from across the United States (16). The study began in 1995 when women aged 21–69 years were enrolled through postal questionnaires mailed to subscribers of Essence magazine, members of several professional organizations, and friends and relatives of early respondents. The baseline questionnaire collected information on demographics, medical and reproductive history, height, weight, physical activity, and cigarette and alcohol use, among other factors. Dietary intake was assessed by using a modified version of the NCI [National Cancer Institute]-Block food frequency questionnaire (17, 18).
After exclusion of 5,500 women who had completed the questionnaire but were outside the age range 21–69 years, who had not completed the questionnaire satisfactorily, or whose addresses were judged to be invalid, 59,052 women comprised the cohort that has been followed. Biennial follow-up questionnaires collect updated information on incident disease, weight, smoking, physical activity, and other factors. Follow-up has averaged over 80% of the baseline cohort over 5 completed questionnaire cycles.
Analyses are based on follow-up from 1995 through 2005, with follow-up beginning at age 30 years. We excluded women who did not reach the age of 30 years by the end of follow-up (n = 1,330); who reported a history of diabetes (n = 2,930) or gestational diabetes (n = 636) at baseline; who reported stroke (n = 359), myocardial infarction (n = 447), or cancer (n = 1,144) at baseline (whose questionnaire assessment of physical activity and diet may not reflect long-term patterns because these conditions may have caused modifications of physical activity level and diet); who were pregnant at baseline (n = 957); or who had missing data on weight, height, or physical activity at baseline (n = 5,581). The final analysis cohort consisted of 45,668 women.
Case definition
Each follow-up questionnaire asked about new diagnoses of diabetes during the previous 2-year period. Incident diabetes was reported by 2,928 women during follow-up.
We assessed the accuracy of self-reported diabetes among a random sample of 227 women whose physicians provided data from their medical records. The diagnosis of type 2 diabetes was confirmed for 218 (96%) of the women. Of the remaining 9 women, 3 did not have diabetes, 2 had type 1 diabetes, 2 had gestational diabetes, 1 had steroid-induced diabetes, and 1 was classified as having metabolic syndrome.
Exposure measurement
Physical activity data were obtained on each follow-up questionnaire. Subjects were asked separate questions on the number of hours per week spent on vigorous physical activity (e.g., running, swimming), walking for exercise, and walking to and from work. Response options were 0, <1, 1–2, 3–4, 5–6, 7–9, and ≥10 hours per week. Participants were asked on the 2003 questionnaire to classify their usual walking pace as casual/strolling (<2 mph), average/normal (2–<3 mph), fairly brisk (3–<4 mph), and brisk/striding (≥4 mph) (1 mile = 1.6 km). In our analysis of walking and diabetes risk, we used data on walking pace from the 2003 questionnaire to reflect their usual walking pace at all time periods. We created a variable that grouped participants into categories based on both walking pace (casual, average, or brisk (fairly brisk and brisk)) and amount of walking, taking into account both walking for exercise and walking to and from work. We created cumulative average variables for each individual based on activity data from each questionnaire that preceded the occurrence of diabetes or end of follow-up; when data are available for a number of different time periods, cumulative averages give a better representation of long-term exposure, as compared with the standard follow-up approach of updating the exposure variable for each time period (19). The number of hours per day spent watching television was also assessed in each questionnaire with possible response categories of 0, <1, 1–2, 3–4, and ≥5 hours per day.
Physical activity assessment in the BWHS was validated in a study conducted at the Howard University Cancer Center (20). Actigraphs (activity monitors) were worn by 101 BWHS participants during their waking hours for 7 days. They also completed 7-day physical activity diaries and completed the BWHS questions on physical activity. Significant positive correlations were observed between BWHS questionnaire data and actigraph measurements for total activity (metabolic equivalent (MET)-hours/week), r = 0.28, P < 0.01; walking, r = 0.26, P < 0.01; and vigorous activity, r = 0.40, P < 0.01. Correlations between the diary data and the BWHS questionnaire data were significant for total activity (MET-hours/week), r = 0.32, P < 0.01, as well as vigorous activity, r = 0.41, P < 0.01.
Data analysis
Age- and time-stratified Cox proportional hazards models were used to calculate incidence rate ratios, also known as hazard ratios, and 95% confidence intervals (21). Person-years were calculated from baseline to the year of diagnosis of type 2 diabetes, loss to follow-up, death, or the end of follow-up in 2005, whichever came first. Incidence rate ratios for diabetes were calculated for the levels of each physical activity measure relative to the lowest level. Time-varying covariates were reassigned every 2 years by using the Anderson-Gill data structure (22). The Anderson-Gill data structure creates a new record for every follow-up cycle at which the participant is at risk and assigns covariate values reported for that specific questionnaire cycle. The covariates included in the multivariable models were age (continuous), questionnaire cycle, family history of diabetes (biologic parents, siblings, or children), years of education (≤12, 13–15, 16, ≥17), household income in dollars (≤15,000, 15,001–25,000, 25,001–35,000, 35,001–50,000, 50,001–100,000, and >100,000), marital status (single, married, divorced/separated/widowed), cigarettes smoked per day (0, <15, 15–24, and ≥25), alcoholic drinks per week (0, 1–6, 7–13, ≥14), energy intake in kilocalories (quintiles), and coffee consumption in cups/week (<1, 1, 2–3, ≥4) (1 cup = 236.6 ml) . We carried out analyses with and without terms for body mass index (weight (kg)/height (m)2) that we hypothesized to be in the causal pathway between physical activity and type 2 diabetes risk. Tests for linear trend across categories of physical activity variables were carried out by including in the regression model an ordinal term for increasing levels of exposure. Departure from the proportional hazards assumption was tested by using a likelihood ratio test comparing models with and without cross-product terms between exposure and age.
RESULTS
Table 1 shows the baseline characteristics of the study population by vigorous physical activity and television watching. At baseline, 31.6% of the cohort reported no vigorous physical activity. Compared with women who exercised ≥7 hours per week, women who reported no vigorous activity were older, had a higher mean body mass index, smoked more, had a higher percentage of energy from fat, and were less likely to walk for exercise. At baseline, 14.6% of the population watched ≥5 hours of television per day. Compared with women who watched <1 hour per day of television, those who watched ≥5 hours per day were less educated; had a higher mean body mass index, higher energy intake, higher percentage of energy from fat, and greater use of cigarettes and alcohol; and were less likely to participate in vigorous physical activity or to walk for exercise. The correlation coefficient for the relation between vigorous activity and television watching was −0.035 (P < 0.0001).
Baseline Characteristics by Hours of Vigorous Physical Activity and Television Watching, the Black Women's Health Study, 1995–2005a
| Vigorous Physical Activity | Television Watching | |||||||||||
| 0 hours/week | ≥7 hours/week | 0 or <1 hour/day | ≥5 hours/day | |||||||||
| No. | % | Mean (SD) | No. | % | Mean (SD) | No. | % | Mean (SD) | No. | % | Mean (SD) | |
| Study participants | 14,449 | 31.6 | 3,310 | 7.2 | 5,285 | 11.6 | 6,674 | 14.6 | ||||
| Age, years | 41.4 (10.5) | 36.2 (9.1) | 38.4 (9.5) | 37.9 (10.6) | ||||||||
| Body mass index, kg/m2 | 29.2 (7.3) | 25.9 (5.1) | 26.5 (5.8) | 29.1 (7.5) | ||||||||
| Energy intake, kcal/day | 1,729 (1,038) | 1,645 (952) | 1,536 (845) | 1,970 (1,227) | ||||||||
| Carbohydrates, % of energy | 49.7 (9.5) | 53.2 (9.7) | 52.3 (9.6) | 49.5 (9.7) | ||||||||
| Fat, % of energy | 34.5 (7.9) | 30.3 (8.4) | 31.5 (8.2) | 34.6 (8.1) | ||||||||
| Family history of diabetes | 27.6 | 24.9 | 26.3 | 26.4 | ||||||||
| Education, ≥17 years | 18.9 | 22.0 | 33.5 | 13.4 | ||||||||
| Income, >$100,000 | 9.3 | 13.7 | 19.5 | 6.2 | ||||||||
| Married/living as married | 41.3 | 33.6 | 41.5 | 34.3 | ||||||||
| Cigarette use, ≥15/day | 14.8 | 9.6 | 10.0 | 14.6 | ||||||||
| Alcohol use, ≥7 drinks/day | 6.6 | 7.1 | 3.5 | 10.8 | ||||||||
| No coffee consumption | 48.4 | 52.2 | 49.6 | 52.7 | ||||||||
| No vigorous activity | 25.2 | 41.7 | ||||||||||
| No walking for exercise | 32.5 | 9.8 | 16.9 | 22.5 | ||||||||
| Watching television, ≥5 hours/day | 19.3 | 18.2 | ||||||||||
Abbreviation: SD, standard deviation.
The data shown are for extreme categories of vigorous activity and television watching.
There were 2,928 incident cases of type 2 diabetes ascertained during 182,994 person-years of follow-up. In the multivariable model, vigorous physical activity was inversely associated with the risk of type 2 diabetes (Table 2). The incidence rate ratio for ≥7 hours per week of vigorous activity relative to 0 hours was 0.43 (95% confidence interval (CI): 0.31, 0.59) (Ptrend < 0.0001). When body mass index was added to the model, the incidence rate ratio was 0.57 (95% CI: 0.41, 0.79) (data not shown). Brisk walking was also associated with a reduced risk: The incidence rate ratio for walking at a brisk pace for ≥5 hours per week relative to no walking was 0.67 (95% CI: 0.49, 0.92). With inclusion of terms for body mass index in the regression model, the incidence rate ratio was 0.87 (95% CI: 0.64, 1.19) (data not shown).
Incidence Rate Ratios for the Association of Physical Activity, Television Watching, and Risk of Type 2 Diabetes, the Black Women's Health Study, 1995–2005
| Cases, no. | Person-Years, no. | Age-adjusted Incidence Rate Ratio | Multivariablea | ||
| Incidence Rate Ratio | 95% Confidence Interval | ||||
| Vigorous physical activity, hours/week | |||||
| 0 | 994 | 42,665 | 1.0 | 1.0 | |
| <1 | 994 | 51,646 | 0.79 | 0.90 | 0.82, 0.99 |
| 1–2 | 668 | 51,057 | 0.62 | 0.77 | 0.69, 0.85 |
| 3–4 | 170 | 21,368 | 0.41 | 0.53 | 0.45, 0.63 |
| 5–6 | 63 | 9,101 | 0.38 | 0.49 | 0.38, 0.64 |
| ≥7 | 39 | 7,157 | 0.33 | 0.43 | 0.31, 0.59 |
| Ptrend < 0.0001 | Ptrend < 0.0001 | ||||
| Walking for exercise or transport, paceb | |||||
| No walking | 69 | 5,375 | 1.0 | 1.0 | |
| Casual, hours/week | |||||
| <1 | 182 | 8,598 | 1.06 | 1.04 | 0.78, 1.37 |
| 1–2 | 310 | 14,097 | 1.06 | 1.09 | 0.84, 1.42 |
| 3–4 | 113 | 4,726 | 1.15 | 1.21 | 0.89, 1.65 |
| ≥5 | 106 | 4,459 | 1.17 | 1.21 | 0.89, 1.65 |
| Average, hours/week | |||||
| <1 | 176 | 10,386 | 0.92 | 1.02 | 0.77, 1.35 |
| 1–2 | 404 | 25,439 | 0.81 | 0.96 | 0.74, 1.24 |
| 3–4 | 198 | 11,242 | 0.84 | 1.04 | 0.78, 1.37 |
| ≥5 | 178 | 11,347 | 0.78 | 0.95 | 0.71, 1.26 |
| Brisk, hours/week | |||||
| <1 | 67 | 5,432 | 0.73 | 0.91 | 0.64, 1.27 |
| 1–2 | 192 | 17,582 | 0.59 | 0.78 | 0.59, 1.03 |
| 3–4 | 107 | 10,735 | 0.49 | 0.69 | 0.51, 0.95 |
| ≥5 | 115 | 12,417 | 0.46 | 0.67 | 0.49, 0.92 |
| Television watching, hours/day | |||||
| 0–<1 | 135 | 16,390 | 1.0 | 1.0 | |
| 1–2 | 935 | 68,284 | 1.51 | 1.43 | 1.19, 1.71 |
| 3–4 | 1,146 | 67,901 | 1.77 | 1.53 | 1.28, 1.83 |
| ≥5 | 712 | 30,419 | 2.38 | 1.86 | 1.54, 2.24 |
| Ptrend < 0.0001 | Ptrend < 0.0001 | ||||
The multivariable incidence rate ratio included terms for age, time period, family history of diabetes, years of education, family income, marital status, cigarette use, alcohol use, energy intake, coffee consumption, vigorous activity, television watching, and walking.
The pace of walking was reported on only 1 follow-up questionnaire, and values are missing for those who did not fill out that questionnaire.
Television watching was positively associated with the risk of type 2 diabetes (Table 2). The incidence rate ratio was 1.86 (95% CI: 1.54, 2.24) for watching ≥5 hours per day relative to <1 hour per day (Ptrend < 0.0001). In a multivariable model that included body mass index, the incidence rate ratio was 1.56 (95% CI: 1.29, 1.89) (data not shown).
The inverse association between vigorous physical activity and type 2 diabetes risk was present at all levels of body mass index (Table 3), even among those with a body mass index of ≥30, the World Health Organization definition of obesity (23). The positive association of television watching and risk of type 2 diabetes was also present at all levels of body mass index. The association was strongest in those with a body mass index of <25, among whom the incidence rate ratio for watching ≥5 hours per day of television was 2.49 (95% CI: 1.24, 5.02) relative to <1 hour per day (Ptrend = 0.01). The associations for vigorous activity and television watching were similar among premenopausal and postmenopausal women (data not shown).
Incidence Rate Ratios for the Association of Vigorous Physical Activity and Television Watching With Risk of Type 2 Diabetes, Stratified by Body Mass Index, the Black Women's Health Study, 1995–2005
| Body Mass Index, kg/m2 | Vigorous Physical Activity | Television Watching | ||||||
| Hours/Week | No. of Cases (N = 2,928) | Incidence Rate Ratioa | 95% Confidence Interval | Hours/Day | No. of Cases (N = 2,928) | Incidence Rate Ratioa | 95% Confidence Interval | |
| <25 | 0 | 57 | 1.0 | 0–<1 | 10 | 1.0 | ||
| <1 | 58 | 0.97 | 0.65, 1.43 | 1–2 | 67 | 1.64 | 0.84, 3.19 | |
| 1–2 | 50 | 0.89 | 0.59, 1.36 | 3–4 | 69 | 1.71 | 0.87, 3.34 | |
| ≥3 | 32 | 0.74 | 0.46, 1.19 | ≥5 | 51 | 2.49 | 1.24, 5.02 | |
| Ptrend = 0.08 | Ptrend = 0.01 | |||||||
| 25–29 | 0 | 236 | 1.0 | 0–<1 | 38 | 1.0 | ||
| <1 | 236 | 0.92 | 0.76, 1.12 | 1–2 | 270 | 1.42 | 1.01, 2.00 | |
| 1–2 | 186 | 0.84 | 0.68, 1.04 | 3–4 | 297 | 1.41 | 1.00, 1.98 | |
| ≥3 | 90 | 0.65 | 0.50, 0.85 | ≥5 | 143 | 1.57 | 1.09, 2.25 | |
| Ptrend = 0.001 | Ptrend = 0.07 | |||||||
| 30–34 | 0 | 250 | 1.0 | 0–<1 | 44 | 1.0 | ||
| <1 | 268 | 0.95 | 0.79, 1.14 | 1–2 | 249 | 1.08 | 0.78, 1.49 | |
| 1–2 | 173 | 0.81 | 0.65, 0.99 | 3–4 | 300 | 1.10 | 0.80, 1.52 | |
| ≥3 | 83 | 0.75 | 0.57, 0.98 | ≥5 | 181 | 1.29 | 0.92, 1.81 | |
| Ptrend = 0.01 | Ptrend = 0.07 | |||||||
| ≥35 | 0 | 451 | 1.0 | 0–<1 | 43 | 1.0 | ||
| <1 | 432 | 0.93 | 0.81, 1.07 | 1–2 | 349 | 1.37 | 1.00, 1.89 | |
| 1–2 | 259 | 0.93 | 0.79, 1.11 | 3–4 | 480 | 1.35 | 0.99, 1.86 | |
| ≥3 | 67 | 0.57 | 0.43, 0.74 | ≥5 | 337 | 1.59 | 1.15, 2.19 | |
| Ptrend = 0.002 | Ptrend = 0.01 | |||||||
Adjusted for age, time period, family history of diabetes, years of education, family income, marital status, cigarette use, alcohol use, energy intake, coffee consumption, vigorous activity, television watching, and walking.
Figure 1 shows the combined effect of vigorous physical activity and television watching. The reference group was those women who reported ≥3 hours per week of vigorous activity and <1 hour per day of television watching. Type 2 diabetes risk increased with decreasing physical activity in each category of television watching and increased with increased television watching in each category of physical activity. The incidence rate ratio for no vigorous physical activity and watching ≥5 hours per day of television was 3.64 (95% CI: 2.23, 5.92).
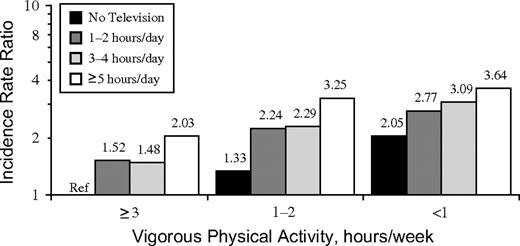
Incidence rate ratios for type 2 diabetes by levels of vigorous physical activity and television watching, the Black Women's Health Study, 1995–2005. The reference category for all other strata is no television watching and ≥3 hours/week of physical activity (Ref).
DISCUSSION
In this large prospective study of black women, vigorous physical activity was associated with a reduced risk of type 2 diabetes. Walking at a brisk pace, but not slow walking, was also associated with a reduction in risk. The risk of type 2 diabetes was increased among women who spent an appreciable amount of time watching television, and this increase was apparent at every level of physical activity.
The present findings on vigorous physical activity in black women are consistent with those reported for white women in previous studies (4, 5, 7, 9, 12–14). Results from the Diabetes Prevention Program trial showed that a lifestyle intervention consisting of diet and physical activity was effective in reducing the incidence of diabetes among all racial subgroups, including African Americans (10). In the Women's Health Initiative observational cohort, there was no significant association among African-American women, but statistical power was limited because there were only 395 diabetic cases among the black women (13). The Women's Health Initiative cohort included only postmenopausal women, but this does not explain the difference between their results and ours. We found an inverse association of physical activity with diabetes in both pre- and postmenopausal women. The other epidemiologic studies that have included an appreciable number of black women have been cross-sectional in design (5, 6).
We had enough statistical power to assess the association of physical activity and type 2 diabetes within strata of body mass index, and we found that physical activity is beneficial regardless of body mass index. Previous studies of physical activity and diabetes that have assessed physical activity within strata of body mass index have provided inconsistent results (3, 4, 9, 12).
Our results showing that walking at a brisk pace is associated with a reduction in risk of type 2 diabetes are consistent with findings on white women from the Nurses’ Health Study (7). The Women's Health Initiative did not find a significant association of walking with diabetes risk in black women, but statistical power was limited (13).
The positive association between television watching and type 2 diabetes risk in our study of black women is similar to that found in 2 previous studies of white women (24) and men (25). Importantly, this association was independent of physical activity and other known risk factors for type 2 diabetes.
Body mass index, which is influenced in part by levels of physical activity and is a strong independent risk factor for type 2 diabetes, may be an intermediate in the association of physical activity and diabetes or a confounder of the association. When we controlled for body mass index in multivariable analyses, the association between physical activity and type 2 diabetes was reduced slightly, but a strong inverse association still remained. In addition, the inverse association of physical activity with diabetes risk was present at all levels of body mass index, including the <25 category of body mass index where confounding from body mass index would be smallest. The latter 2 observations suggest that confounding, if present, played a minor role in the present study and that mechanisms other than body mass index may also play a role in the reduction in risk.
The relation between type 2 diabetes and physical activity may be mediated through increased insulin sensitivity due to increases in levels of the glucose transporter protein GLUT-4 and muscle glycogen synthase activity, a decrease in serum triglyceride concentration, and an increase in muscle capillary network (15, 26). Physical activity can also lead to weight loss or maintenance of a healthy weight (27), which in turn can lead to a lower risk of type 2 diabetes.
The positive association between television watching and type 2 diabetes might be explained by 2 mechanisms (28). First, television watching is related to a lower expenditure of energy, which in turn can lead to obesity, weight gain, and increased risk of diabetes. Adjustment for body mass index attenuated the incidence rate ratios in our study; this is compatible with the association of television watching with type 2 diabetes being at least partially mediated through obesity. Another possible mechanism is that television watching leads to a higher caloric intake and a relatively unhealthy dietary pattern. Participants in our study who watched more television had a higher energy intake and a higher fat and carbohydrate intake as compared with those who watched no television.
One of the main strengths of our study is the prospective study design, which reduces the potential of recall bias. In addition, the BWHS has high follow-up rates that reduce the possibility of bias resulting from selective losses. The sample size was large, providing excellent statistical power to assess effects overall and in subgroups. We were able to adjust for a large number of possible confounding variables.
Physical activity was self-reported. Because we had repeated measures of physical activity, we were able to get a better representation of long-term physical activity. Our validation study showed significant correlations of questionnaire responses with diary and actigraph measurement of physical activity. Nonetheless, measurement errors are likely but should be nondifferential, which would move estimates for the highest exposure categories toward the null. To the extent that there was misclassification of exposure, the true association of activity with diabetes risk may be even stronger than shown here.
Identification of type 2 diabetes cases was based on self-report. A validation study indicated that type 2 diabetes was reported with a high degree of accuracy. Some women with undiagnosed type 2 diabetes were undoubtedly misclassified as noncases, but the prevalence of undiagnosed disease was likely to be low (29). Physicians are well aware of the high risk of diabetes among African-American women, and it seems likely that BWHS participants were screened for the disease during the course of regular check-ups. Access to health care is quite good among BWHS participants: 93% reported that they had health insurance in 1997, and 98% reported that they had visited a physician/hospital in the past 2 years.
The BWHS participants were from 17 states across the United States with approximately equal numbers living in the Northeast, South, West, and Midwest. In addition, 97% of the participants have completed high school or a higher level of education. Among the US black female population of the same ages, 83% have at least a high school education (30). In this respect, our results should be applicable to most US black women, except possibly the approximately 17% who have not completed high school.
The present observational findings suggest that physical activity may reduce the risk of type 2 diabetes in African-American women, a population at high risk of the disease. Recent recommendations for physical activity for adults include “moderate-intensity physical activities for at least 30 minutes on 5 or more days of the week” (Centers for Disease Control and Prevention) and “vigorous-intensity physical activity 3 or more days per week for 20 or more minutes per occasion” (Healthy People 2010) (31). Like the majority of adults in the United States, most African-American women do not meet recommended levels of physical activity. Our results for vigorous activity and brisk walking suggest that levels approximating those recommended might indeed be protective against type 2 diabetes. Regular brisk walking may be easier to implement than vigorous physical activity. Reducing sedentary behaviors, such as television watching, or at least reducing the excess eating that often accompanies it, might also be effective. A necessary first step for the translation of scientific findings into behavioral change is dissemination of the health information to those affected, and the current results provide the basis for educating African-American women about the benefits of physical activity in preventing type 2 diabetes.
Abbreviations
Author affiliation: Slone Epidemiology Center, Boston University, Boston, Massachusetts (Supriya Krishnan, Lynn Rosenberg, Julie R. Palmer).
This work was supported by National Cancer Institute grant CA58420 and National Institute of Diabetes and Digestive and Kidney Diseases grant 1R01DK068738.
The authors acknowledge the dedication of the Black Women's Health Study staff.
Conflict of interest: none declared.

