Article Text

Abstract
Background: Clinical assessment of cerebral concussion relies on the presence and duration of post concussive symptoms (PCS). Given that these PCS are subjective reports and not always specific to concussion, their usefulness remains to be validated.
Objective: To evaluate the usefulness of self-reported PCS by means of cognitive tests and functional MRI (fMRI).
Method: 28 male athletes with and without concussion were grouped according to their PCS score. They were then administered a computerised cognitive test battery and submitted to an fMRI session where cerebral activations associated with verbal and non-verbal working memory tasks were analysed.
Results: Behaviourally, response accuracy and speed on the cognitive test battery were comparable for the control and low PCS group. The moderate PCS group showed significantly slower response times than the control group on the matching (p<0.05) and one-back tasks (p<0.05). The functional MRI study showed reduced task related activation patterns in the dorsolateral prefrontal cortex for both low and moderate PCS groups. Activation peaks outside the regions of interest, not seen in the control group, were also noted for both PCS groups. Regression analyses indicated an inverse relationship between PCS scores and performances on several CogSport subtests. Severity of PCS also predicted fMRI blood oxygen level dependent signal changes in cerebral prefrontal regions.
Conclusion: Self-reported PCS is associated with an ongoing cerebral haemodynamic abnormality as well as with mild cognitive impairment. These results support the use of the PCS scale in the assessment of cerebral concussion and in monitoring recovery.
Statistics from Altmetric.com
Cerebral concussion is a common injury seen in contact and collision sport. The frequency of self-reported concussion is particularly high in ice hockey, American football and soccer, where up to 50% of players report a history of at least one concussion.1–3 It is likely that these values represent an underestimate of the actual incidence of concussion as many players either fail to recognise that they experienced such an injury or are reluctant to report the injury because of fear of exclusion from match play.4–7
Physicians involved in the care of concussed athletes frequently face the dilemma of when to allow a player to return to play. The challenge in making such a decision stems from the fact that sport related concussion does not produce a detectable structural lesion and few scientifically validated diagnostic instruments exist to help identify concussive brain injury and to determine concussion recovery.8 In the past, post concussion management has centred on the application of return to play guidelines which utilise an arbitrary period of mandatory exclusion following injury. As none of the published guidelines have been prospectively validated, it was recommended by the Vienna Conference on Concussion in Sport that they be abandoned in favour of an individualised assessment of recovery.9 A key element in determining clinical recovery from concussion is the presence of post concussive symptoms (PCS). Consequently, concussion symptom checklists have been added to several management guidelines.
The usefulness of PCS in the assessment of cerebral concussion remains unclear given that such symptoms are non-specific in nature and a large percentage of the normal population report identical symptoms in the absence of a history of concussive injury.10–13 This is especially problematic in athletes with persisting symptoms, as little is known about the nature of PCS in this particular population. Validation of self-rated PCS scales in cases of chronic PCS can be achieved by correlating its measure with other objective assessments, such as those provided by neuropsychological tests. In addition to cognitive measures, novel functional imaging techniques such as functional MRI (fMRI) may provide an objective evaluation of concussive injury. Although the use of fMRI in concussion research is still in its infancy, initial studies have suggested promising results.14 15
The present study was designed to define the relationship between self-reported PCS, neuropsychological performance and fMRI activation studies in a group of concussed athletes with persisting PCS who had suffered a complex concussion, as defined by the Prague Conference on Concussion in Sport.16 A concussion is considered “complex” when one or more of the following criteria are met: (1) specific sequelae, such as concussive convulsions; (2) loss of consciousness of more than 1 min; (3) persistent symptoms or prolonged cognitive impairment after the injury; and (4) history of multiple concussions over time. Our primary objective was to evaluate the use of a PCS score as a diagnostic indicator in complex concussion, and to investigate whether the severity of self-rated symptoms reflects the degree of ongoing behavioural and functional changes after a cerebral concussion.
METHOD
Participants
The participants consisted of 28 right handed male athletes from a combination of recreational, amateur and professional contact sports. Table 1 provides a detailed description of the sample.
Eighteen of these athletes attended the McGill sports medicine clinic for consultation related to their concussive brain injury from sports. The concussions were, in general, observed and verified by the team medical personnel present during the game; the athletes then agreed to report to the research team. For all of the athletes, the injury occurred at least 1 month before the study (mean 5 (SD 6.4)), and they continued to experience a variable degree of self-reported PCS. Nine of the 18 athletes were assigned to the low PCS group 1 (mean age 27.2 (SD 5.5) years; mean PCS score 11 (SD 6)), and the other nine to the moderate PCS group 2 (mean age 30.8 (5.6) years; mean PCS score 47 (14)). The severity of PCS of each participant was assessed using a 21 item checklist adapted from the post concussive symptom scale-revised.17 In this scale, the symptoms were graded by the athlete as none (0 or 1), moderate (2–4) or severe (5–6). The athletes were instructed to identify and rate only those symptoms they experienced at the time of the study. We considered a normal composite score to range from 0 to 5 based on our own baseline data of 44 uninjured athletes as well as on other studies that used the scale.18–20 Thus we divided the concussed athletes into two subgroups according to their PCS score
Low PCS group 1: athletes with a symptom score ranging from 6 to 21. A score of 21 was chosen as maximal for the low PCS group because this is the total score that would be attained if every symptom was selected and given a score of 1. This score was also chosen because it is close to the mean PCS score reported in athletes following an AAN grade 1 concussion.19
Moderate PCS group 2: athletes with a score of 22–84.
Control group 3: remaining non-injured 10 elite athletes (mean age 21.9 (1.6) years; mean PCS score 0.6 (1); mean number of concussion 0.9 (1.36)), recruited from McGill varsity hockey and football teams. This group was selected in order to provide normative data as baseline PCS scores were not available from the concussed athletes. The control group had their pre-season baseline cognitive test performances and fMRI activation patterns assessed as part of an ongoing longitudinal study on sport related concussion. Participants in the control group were screened before the study to ensure that they had no neurological or psychiatric disorders, and that they did not have a concussion in the 12 months preceding the study.
All subjects gave informed, written consent for their participation in the study, which was approved by the Research Ethics Board of the Montreal Neurological Institute and Hospital, McGill University.
Computerised cognitive tests
We used the CogSport computerised cognitive test battery developed by CogState Ltd (Melbourne, Australia). The battery consists of eight tasks designed as card games and is language independent.21 It includes the following:
simple reaction time task: the subject has to press the response key as fast as possible when the central face down card turns face up;
choice reaction time task: the subject has to press one of two response keys as fast as possible, depending on the colour of the central face down card that turns face up;
complex reaction time task: two cards turn face up at the same time and the subject has to press one of two response keys as fast as possible, depending on whether the cards are the same or different in colour;
monitoring task: five cards jiggle randomly up and down between two parallel white lines, the subject has to press the response key as fast as possible when any card touches the white line;
one back task: the subject has to press one of two response keys as fast as possible, depending on whether the new card is the same or different from the last card presented;
matching task: six target face up card pairs are shown on top of the screen and the subject has to decide whether the new face up card pair matches one of those six target pairs;
incidental learning task: part way through the matching task, the six target pairs turn face down and the subject has to perform the matching task base on the memory of the target pairs;
learning task: similar to the matching task, except each of the target pair turns face down after the first presentation of a matching pair to the target pair.
Each participant was administered the CogSport battery using a Dell Inspiron 8200 laptop computer. The entire battery took approximately 30 min to complete, including practice. Measures on the speed (in ms) and accuracy (per cent correct) of the responses were collected and analysed separately.
fMRI task
A verbal and a non-verbal working memory task (ie, experimental condition) and their corresponding control tasks (ie, baseline condition) were used for the fMRI studies. A full description of the experimental design has been published elsewhere.14 Briefly, the format of stimulus presentation, mode of response and timing of events were identical in both conditions, except they differed in terms of working memory requirements. The working memory task was adapted from Petrides’ externally ordered task,22 which requires the subjects to keep track of a serial presentation of four items (abstract words or abstract designs) randomly selected from a set of five, and to make a decision as to whether the target item, presented after a short delay, is among the four previously presented items. The subjects made their response by activating the appropriate mouse key. In the baseline control task condition, one item was presented four times successively followed by a short delay, after which one of two items associated with either a left or a right mouse button press was presented and the subjects had to make the right response. The subjects learned prior to scanning which one of these two items (two abstract designs or two abstract words for the visual and verbal versions of the task, respectively) was associated with a left mouse button press and which one with a right button press. The baseline task was introduced to obtain baseline activation and to “subtract out” any activation related to the motor and perceptual components of the working memory task.
Images acquisition
Functional
The fMRI scanning was carried out using a 1.5 Tesla Siemens Sonata scanner (Siemens AG, Erlangen, Germany). Each scanning session started with acquisition of high resolution (1 mm3) T1 weighted three dimensional structural images for anatomical localisation of the functional data. Brain activation was then measured using blood oxygenation level dependent (BOLD) fMRI, by means of a T2* weighted gradient echo planar imaging sequence (TR 3000 ms, TE 51 ms, FA 90). A total of 120 acquisitions were collected in each functional scan. Twenty oblique, contiguous slices covering the entire brain (7 mm thickness, −35° relative to the AC-PC line, interleaved excitation order) were taken during each acquisition. Four functional scans (two for the verbal working memory condition and its control and two for the non-verbal working memory condition and its control) were acquired in a single session. Each functional scan consisted of six alternating blocks (60 s each) of working memory and baseline conditions. All stimuli were presented via an LCD projector to a screen placed in front of the scanner, and then to the subject via a mirror mounted on the head coil.
Structural
All subjects underwent a routine MRI examination, including axial T2 weighted turbo spin echo (TR 3910 ms, TE 81 ms, FA 150) and axial fluid attenuated inversion recovery (TR 9000 ms, TE 66 ms, FA 180) sequences. These MR images, as well as the T1 weighted three dimensional gradient echo images acquired as part of the functional scans, were evaluated by an expert clinical neuroradiologist for obvious signs of axonal injury and/or abnormal signal intensity, size and location in the brain.
fMRI analysis
Before statistical analyses, all frames in each dynamic file were first realigned to the fourth frame in that run to correct transient head movements caused by breathing and swallowing during data acquisition. The images were then spatially smoothed with a 6 mm full width at half maximum Gaussian filter to increase the signal-to-noise ratio of the data, the tolerance of the subsequent analysis steps to residual motion in the scans and to minimise resampling artefacts. The motion corrected data were analysed statistically using fmristat.23 The fMRI time series data from the verbal and non-verbal tasks were analysed separately. For both tasks, a working memory minus baseline control task subtraction was performed. Significant BOLD changes were determined at each voxel, based on a linear model with correlated errors. The mean parametric t maps were constructed for each individual by averaging functional data across scans using linear regression analyses. To obtain the average group t maps, all individual data were first normalised to the Montreal Neurological Institute template (MNI305) constructed from average stereotaxic MRI of 305 normal subjects, and then combined using a mixed effects linear model. The resulting T statistic images were thresholded using the minimum given by a Bonferroni correction and random field theory24 to correct for multiple comparisons. A directed search method was used to calculate the threshold, using an estimated gray matter volume of 64000 mm3 of the dorsal prefrontal area. This yielded a threshold value of t = 4.2, p<0.05. Each set of fMRI data was then co-registered to the corresponding anatomical MRI, which was corrected for intensity non-uniformity25 and normalised to MNI305 standard stereotaxic space.
Statistical analyses
Analysis of covariance was employed using age as a covariate to control for this possible confounding factor. For both response speed and accuracy measures from the CogSport battery, statistical analyses were carried out on the normalised data (arcsine transformation for accuracy data and log10 transformation for response time data). Statistical analyses were also performed on response speed and accuracy from the working memory and the control tasks during the fMRI session. Bonferroni correction was used for post hoc analysis to control for multiple comparisons. Finally, multiple regressions with PCS as the main predictor and age as the confounding factor was carried out to measure: (1) the relationship between self-reported PCS scores and results on response accuracy and reaction time on the CogSport tests; and (2) PCS scores and their association with fMRI BOLD signal change in each voxel of interest.
RESULTS
Although ANOVA indicated that the control group was significantly younger than the moderate PCS groups (p<0.01), no significant age difference was found between the concussed groups. In addition, the concussed groups did not differ in terms of the number of previous concussions and time since injury.
Cognitive tests battery
Response accuracy
ANCOVA revealed a significant main effect for group on the choice reaction time task (F(2,27) = 5.17, p = 0.01). Post hoc tests indicated that the low PCS group 1 performed significantly better than the moderate PCS group 2 (p = 0.01) on this task. There was no difference between control group 3 and the two concussed groups on any of the other CogSport subtests. In most cases, all groups performed near ceiling on the other subtests of the battery.
Response speed
ANCOVA revealed a significant main effect for groups on the one back task (F(2,27) = 10.43, p<0.01), choice reaction time (F(2,27) = 3.98, p = 0.03) and matching tasks (F(2,27) = 5.89, p<0.01). Bonferroni corrected post hoc tests showed that control group 3 was significantly faster than the moderate PCS group 2 on the one back (p<0.01) and matching tasks (p = 0.02). The low PCS group 1 was also significantly faster than the moderate PCS group 2 on these two tasks (p<0.01), as well as on the choice reaction time task (p = 0.03). No significant difference was found between control group 3 and the low PCS group 1. Table 2 summarises group mean response accuracy and speed scores.
Regression analyses indicated that PCS score predicted performances on several CogSport subtests. For response speed, a higher PCS score predicted a slower performance on the following CogSport subtests: complex reaction time (r = 0.551, p<0.05), choice reaction time (r = 0.69, p<0.01), one back task (r = 0.885, p<0.01) and matching task (r = 0.61, p<0.01). For response accuracy, a higher PCS score was associated with less accurate performance on the choice reaction time (r = −0.774, p<0.01), one back (r = −0.591, p<0.05) and incidental learning tasks (r = −0.524, p = 0.05). Age did not account significantly for the performance on either response time or accuracy on any of the CogSport subtests.
Structural MRI
All MR images were evaluated by a clinical neuroradiologist, and were found to be normal.
Functional MRI
Behavioural results
ANCOVA with age as the covariate was performed on the accuracy (percentage correct) and speed (response speed in milliseconds) data from the working memory and the control tasks collected during the fMRI session. With regard to performance accuracy, ANCOVA revealed a significant main effect of group on the verbal working memory task (F(2,27) = 4.04, p<0.05), verbal control task (F(2,27) = 8.86, p<0.01) and visual control task (F(2,27) = 5.02, p = 0.01). Post hoc tests indicated that the low PCS group 1 performed comparably with the control group 3 on both versions of the working memory task; in addition, this group did significantly better than the moderate PCS group 2 on the verbal working memory (p = 0.05), and the verbal (p<0.01) and visual control tasks (p = 0.01). The moderate PCS group 2 performed less well on all tasks but was not significantly different than the control group 3 (p>0.05). Table 3 summarises the behavioural results.
In terms of response speed, both concussed groups responded faster than the control group 3 (table 3). Statistical analyses indicated that the low PCS group 1 responded significantly faster than the control group 3 on the verbal working memory task (F(2,27) = 2.33, p<0.05). No significant group difference was found for the other tasks.
fMRI results
Whole brain analysis was carried out to generate overall activation patterns for each group and the results are presented in fig 1. For control group 3, significant task related BOLD signal increases were detected in the dorsal cingulate and the dorsolateral and ventrolateral prefrontal regions, consistent with the known functional role of these cerebral areas in working memory processes.26–28 Both verbal and non-verbal tasks were associated with similar activation patterns in those regions and were consistent with those observed in a separate study using a different group of athletes.14
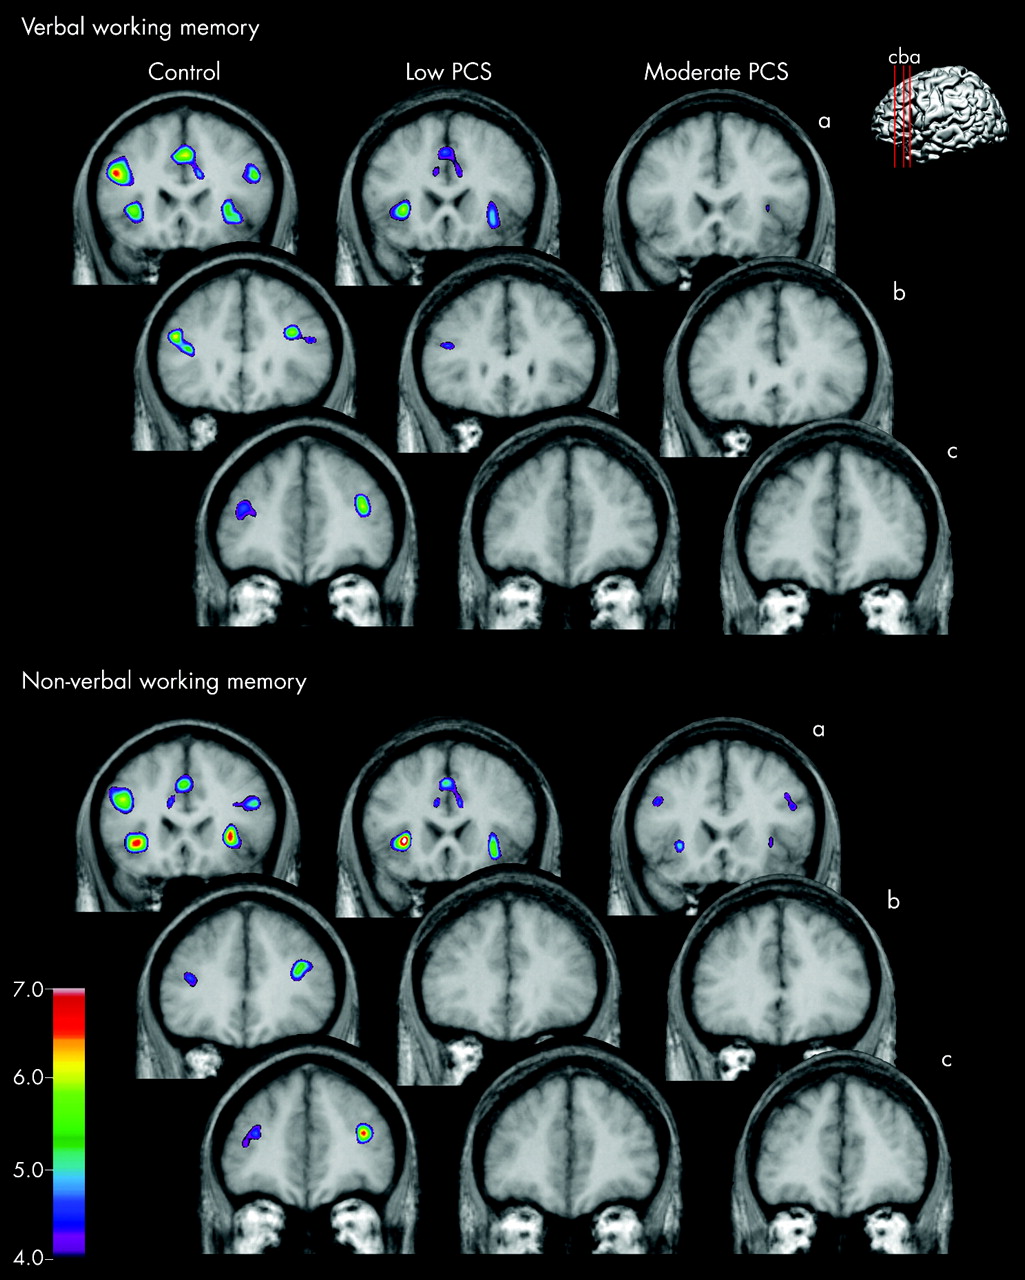
A clear difference between the control group and concussed athletes was seen by comparing the brain activation maps. As shown in fig 1, significant BOLD changes in the low PCS group 1 were detected only in the dorsal cingulate and ventrolateral prefrontal regions. The moderate PCS group 2 showed even less brain activities in the prefrontal cortex, and the only significant activation peak in this region was found in the dorsal cingulate. Whole brain analysis also revealed that both low and moderate PCS groups (1 and 2) had an additional activation peak in the left temporal lobe during the verbal working memory task, a focus which was not detected in the control group (fig 2). Thus an atypical activation pattern in the concussed athletes seems to correlate with the severity of PCS

Volumes of interest (VOI) analyses were carried out to quantify the observed difference in the activation patterns. Nine VOIs (five for the verbal and four for the non-verbal tasks) were identified using the average activation map of control group 3. These regions were defined as an 8 mm3 sphere centred at the voxel where significant task related activity was detected. The corresponding mean per cent BOLD signal change from the control to working memory condition was then calculated for each group. ANCOVA with age as covariate revealed a significant effect of group in five out of the nine VOIs (table 4).
Post hoc analyses indicated that moderate PCS group 2 had significantly less BOLD signal increases than control group 3 in all five VOIs while the low PCS group 1 had less BOLD signals than the controls in VOIs 2 and 4 for the verbal and non-verbal tasks, respectively.
To examine further the relationship between self-reported PCS and fMRI activation patterns, voxel wise regression analyses were performed on the entire fMRI time series using PCS scores as predictor and age as covariate. This allowed identification of brain regions where changes in BOLD signals were modulated by PCS, independent of group assignment.
After removing the effect of age, three prefrontal areas (two for the verbal and one for the non-verbal tasks) showed significant negative PCS–BOLD relationships (fig 3). Specifically, high PCS score was associated with reduced activation in prefrontal areas that correspond to VOI 1 (r = −0.47, p = 0.03), VOI 2 (r = −0.50, p = 0.03) and VOI 4 (r = −0.51, p = 0.02) identified from the average activation map. Because it is an unbiased analysis which makes no assumption about categorisation according to PCS score or where in the brain PCS related effects will appear, these findings support our grouping criteria according to PCS score. They also demonstrate the sensitivity of fMRI in detecting PCS related changes.

DISCUSSION
In this study, we examined the relationship between scores on a standardised self rated post concussion symptom checklist17 and the results obtained from objective neuropsychological assessment and fMRI testing. The data showed that moderate PCS scores were associated with inaccurate and slower performances on some CogSport subtests as well as with reduced fMRI BOLD signal changes in the frontal lobes, namely in the dorsolateral and ventrolateral prefrontal regions, while performing verbal and non-verbal working memory tasks. In contrast, athletes with a low PCS score performed normally on the CogSport test battery but showed reduced fMRI signals in the dorsolateral prefrontal regions compared with the control subjects. Of note is that the foci shown by the low PCS group were significantly greater than those shown by the moderate PCS group. In addition, activations in posterior brain regions of both groups, not seen in the control subjects, were observed. We have previously reported similar “atypical” activation foci in a different group of concussed athletes and attributed them to the use of compensatory mechanisms through recruitment of extra neuronal resources.14
While the results from the computerised cognitive tests used in the present study and the fMRI findings concur for the moderate symptoms group, some discrepancy exists between the measures in the low PCS group. Behaviourally, the athletes in this group performed as well as the control subjects, yet they exhibited less cerebral activity relative to the control group when performing the working memory task that was part of the neuroimaging study.
Several studies have reported links between PCS scores and cognitive impairment.18 19 29 30 Lovell and colleagues19 reported that cognitive impairment following sport related concussion and its subsequent resolution paralleled the course of PCS presentation, although their finding has been disputed because of the definitions used. Iverson and colleagues31 found a correlation between self-reported fogginess and cognitive performance, where athletes with persisting fogginess displayed slower reaction time and information processing speed, and poorer memory performance. Similarly, Collins and colleagues29 demonstrated that headache, one of the most frequent symptom reported after a cerebral concussion, was associated with worse performance on reaction time and memory tasks, and concussed athletes with more severe headaches had significantly more PCS compared with those with mild headache (but see Makdissi and colleagues32).
With regard to neuroimaging, there is a paucity of studies that attempt to investigate the underlying changes in brain physiology in relation to self-reported PCS. Functional MRI offers such an opportunity as it provides an indirect physiological index of brain activity, and because of its non-invasive nature, it has become the method of choice for making brain behaviour inferences under normal and various neurological disease states. Few studies have employed this imaging method to investigate mild head injury and sport related concussion.14 15 In a prospective study using fMRI and finger sequencing, serial calculation and digit span tasks, Jantzen and colleagues15 reported significantly greater within subject increases in brain activity among athletes with concussion than control subjects. Similarly, in an fMRI study that involved non-athletes with mild traumatic brain injury, McAllister and colleagues33 found that 1 month after the injury, patients with mild traumatic brain injury showed a greater increase in brain activity than control subjects when the working memory demand increased during the n-back task. These apparently contradictory results may be explained by the fact that fMRI activation studies are primarily based on subtraction of the experimental and baseline tasks. Both our working memory and baseline tasks differed significantly from those reported in the literature and this may account for the different (but not necessarily conflicting) results between other fMRI studies and our own. Thus a direct comparison between fMRI studies that use different paradigms may not be indicated. Rather, we favour an approach where differences in brain activations are identified in normal and concussed individuals when the scanning takes place under identical conditions. In this regard, the most significant findings across fMRI studies on concussion are that individuals with the mildest form of brain injury still display atypical brain activity compared with a normal control group.
Some potential limitations of the present study merit consideration. One is its small sample size which could, in part, explain the absence of differences in cognitive performances between the low PCS and the control groups. Alternatively, any detected group difference in such a small sample could represent a large and genuine effect. Thus we found that the fMRI activation patterns of both PCS groups differed from those of the control subjects, and that the moderate PCS group showed poorer performances on some cognitive tests compared with the control group.
Another possible limitation concerns the generalisability of our findings. Our study focused primarily on sports related concussions in young male athletes. This sampling limits the applicability of our findings to the concussed athlete and head injury populations at large.
Finally, our control group differed from the concussed groups in that it was made up of varsity athletes whereas the concussed groups consisted of athletes at the recreational and professional levels. This difference is, however, minimised by the fact that all of the subjects were elite athletes who played the same sports (ie, hockey or football) at a competitive level.
In conclusion, we found that the moderate PCS group showed poorer performances on some cognitive tests, and there were significant correlations between some cognitive measures and the PCS score. In addition, fMRI activation patterns of both PCS groups differed from those of the control subjects, and the PCS score predicted brain activities in three prefrontal regions. More specifically, an increase in PCS score leads to a decrease in brain activity in these areas. Thus it appears that fMRI is sensitive enough to detect PCS related changes in the brain and that it may contribute to the classification of PCS severity in concussed individuals. Because we have shown that these symptoms closely reflect both neurocognitive deficits and changes in brain activations, they may serve as a good clinical index of concussive injury and, when used serially, may be indicative of the degree of recovery. It should be pointed out that because of the multifaceted nature of concussive injury, PCS alone is not sufficient to provide criteria for return-to-play decision. Rather, they should be part of a comprehensive approach to this injury.16
Acknowledgments
We are grateful to Mary Mooney, Lynn Bookalam and James Hieminga for their help in recruitment of subjects and coordination of testing. We also thank Véronique Desrochers for administering the CogSport battery.
REFERENCES
Footnotes
Funding support: This study was supported by a grant from CASM/NHL and CIHR operating grant MOP-64271. The funding agencies were not involved in the design and conduct of the study; the collection, management, analysis and interpretation of the data; or in the preparation, review and submission of the manuscript.
Competing interests: At the time of writing this manuscript, Dr Collie was an employee of CogState Ltd, the manufacturer of the CogSport tests described in this paper. None of the other authors have any financial interest in CogState Ltd or any other conflict of interest.
- Abbreviations:
- BOLD
- blood oxygen level dependent
- fMRI
- functional MRI
- PCS
- post concussive symptoms
- VOI
- volume of interest