Article Text

Abstract
Background: To estimate the incidence and prevalence of type 1 and type 2 diabetes in the UK general population from 1996 to 2005.
Methods: Using The Health Improvement Network database, patients with type 1 or type 2 diabetes were identified who were 10–79 years old between 1996 and 2005. Prevalent cases (n = 49 999) were separated from incident cases (n = 42 642; type 1 = 1256, type 2 = 41 386). Data were collected on treatment patterns in incident cases, and on body mass index in prevalent and incident cases.
Results: Diabetes prevalence increased from 2.8% in 1996 to 4.3% in 2005. The incidence of diabetes in the UK increased from 2.71 (2.58–2.85)/1000 person-years in 1996 to 4.42 (4.32–4.53)/1000 person-years in 2005. The incidence of type 1 diabetes remained relatively constant throughout the study period; however, the incidence of type 2 diabetes increased from 2.60 (2.47–2.74)/1000 person-years in 1996 to 4.31 (4.21–4.42)/1000 person-years in 2005. Between 1996 and 2005, the proportion of individuals newly diagnosed with type 2 diabetes who were obese increased from 46% to 56%. Treatment with metformin increased across the study period, while treatment with sulphonylureas decreased.
Conclusions: The prevalence and incidence of type 2 diabetes have increased in the UK over the past decade. This might be primarily explained by the changes in obesity prevalence. Also, there was a change in drug treatment pattern from sulphonylureas to metformin.
Statistics from Altmetric.com
Diabetes mellitus is a chronic disease caused by an inherited or acquired deficiency in the production of insulin by the pancreas, or by the insensitivity of cells to the insulin produced. Type 1 diabetes is triggered by the loss of insulin-producing cells in the pancreas and its diagnosis is made most commonly in childhood. Type 2 diabetes is more common in older individuals and is mainly caused by the insensitivity of cells to insulin.
Diabetes is a common condition that leads to considerable morbidity and premature mortality. Long-term complications of diabetes include foot and leg ulcers, visual and renal complications, heart disease, stroke and peripheral vascular disease.1 The lifespan of patients with diabetes is commonly extended in developed countries, although it remains one of the leading causes of death in the USA since 2003.2 In the UK, the results of a recent study using the General Practice Research Database (GPRD) showed that patients with type 2 diabetes have a mortality rate almost twice as high as those without diabetes,3 and that diabetes has been identified as a key national healthcare priority in the UK.4 5
A number of studies have shown a rise in the prevalence of diabetes in the UK.1 6 7 However, when looking at temporal trends in a chronic condition, incidence is a more sensitive measure than prevalence. Very few studies have examined the incidence of diabetes in the UK. One study reported a 10-year cumulative incidence of type 2 diabetes, in a group of 1040 adults aged 40–69 years, of 7.3 per 1000 person-years.8 A second study, which assessed the incidence of diabetes in England and Wales using the GPRD, reported an increase of 26% in overall incidence from 1994 to 1998.9 A third study evaluated the prevalence of diabetes among children in the UK during 2000.10 The authors found a prevalence of type 1 diabetes of 2.2 per 1000 patients and a low prevalence of type 2 diabetes of 0.13 per 1000 patients and suggested a deprivation and race association.
However, no longitudinal studies have investigated the incidence of type 1 and type 2 diabetes separately in the UK in recent years. Therefore, there are limited data on the relative contributions of each type of diabetes to the increase in diabetes incidence. There is also very little information on how this temporal trend has developed into the new millennium.
This study aims to estimate the prevalence and incidence of both type 1 and type 2 diabetes in the general UK population from 1996 to 2005 using The Health Improvement Network (THIN) database and to describe treatment patterns among patients newly diagnosed with diabetes.
RESEARCH DESIGN AND METHODS
The data for this population-based cohort study was obtained from THIN (www.epic-uk.org). THIN is a primary care medical records database that contains computerised information entered by primary care physicians (PCPs) in the UK. Data recorded include demographic information, medical diagnoses, prescriptions, referrals, laboratory results and lifestyle characteristics. The database currently contains details of 4.8 million patients derived from over 300 physician practices. Validation studies have shown THIN to be appropriate for use in pharmacoepidemiology research and to give similar results to the currently more widely used GPRD.11 Furthermore, THIN allows changes in incidence and prevalence to be studied over time because THIN contains representative information from the UK population, and reflects the dynamics in the UK population. It also enables us to assess what is happening in everyday clinical practice rather than in a highly selected clinical trial population, thus making it more representative of the general population. Results from recent studies suggest that the data and levels of recording are similar to those from other UK databases and are generalisable across UK practices.11
The source population for our study was made up of individuals who were aged 10–79 years between January 1996 and December 2005 who were enrolled for at least 2 years with a PCP and who had at least 1 year of follow-up after their first recorded prescription. Only individuals with an enrolment status of “permanent” or “died” were eligible. Patients are listed as “permanent” when they are currently enrolled with the PCP. When a patient dies, the status is changed to “died”. There is a large proportion of individuals on PCP computer lists who have a status other than “permanent” or “died” and most of them present incomplete healthcare information; therefore, they were not part of our study cohort. Individuals aged 70 years or over with a follow-up longer than 1 year but with fewer than two health contacts over that period (proxy for incomplete primary care records) were excluded from the source population. This led to a final source population of 1 842 836 individuals contributing a total of 9 780 441 person-years.
The prevalence and incidence of diabetes overall, and of each type individually, were calculated for both sexes for each year between 1996 and 2005. The incidence was also calculated across 10-year age ranges. Incidence rates were age and sex standardised and 95% confidential intervals were calculated.
Prevalent and incident cases
Incident cases were separated from prevalent cases by date of diagnosis (those who were diagnosed for the first time during the study period), and patients with gestational or drug-induced diabetes were excluded.
The estimation of the incidence rate for the whole study period 1996–2005 was calculated including all patients newly diagnosed with diabetes during the study period and 95% confidence intervals (CI) were calculated. We found 42 642 newly diagnosed patients during 1996–2005 and used as denominator the person-years of patients at risk to be diagnosed during this period (9 780 441 person-years). We estimated the incidence rate by year within the study period. For this estimation, we followed 10 cohorts independently (one for each year) and included as numerator only those patients who were newly diagnosed within the year of interest.
For estimation of the prevalence over the 10-year study period we included as cases those patients who were diagnosed before entering the study cohort and who were still alive at that time (49 999 patients) together with those patients who were newly diagnosed during the whole study period (42 642 patients). A total of 92 641 patients were included for the prevalence estimation and we divided that number by the total number of patients in the whole cohort (1 842 836 individuals).
Diabetes ascertainment
The READ classification was used to code specific diagnoses (http://www.connectingforhealth.nhs.uk/terminology/readcodes), and a drug dictionary based on data from the MULTILEX classification was used to code drugs.
We manually reviewed the computer profiles including information within 1 year from the recorded index diagnosis of diabetes to ascertain whether they contained any recorded mention of type 1 or type 2 diabetes. Incident cases were divided into patients with type 1 or type 2 diabetes based on the following criteria.
Patients whose data contained specific READ codes for type 1 or type 2 diabetes were assigned to their respective group. The majority of cases were classified according to the specific READ codes. Although the primary disease classification definition was based on the specific code for diabetes mellitus type 1 or diabetes mellitus type 2, we manually revised the clinical profiles of the patients taking into account additional confirmation, such as “referral letters”, diagnosed confirmation in further revisions, general practitioner free text comments, treatment recommendation and age at first diagnosis. This led to a few changes from the automatically assigned type of diabetes.
For those patients identified with an unspecific code for diabetes (e.g. diabetes mellitus) we assigned the classification as type 1 or type 2 taking into account the same criteria listed above, including the age at diagnosis. We based our decision on the manual review of computerised clinical profiles, taking into account age of diagnosis, referrals, concordance of further specific codes registered in annual revisions, and treatment received within 1 year.
Type 1 diabetes: patients with at least one specific code for diabetes type 1 within 1 year; or patients under the age of 35 years with an unspecific code of diabetes, but with one or more prescriptions for insulin and less than 1 year of oral hypoglycaemic treatment. A similar definition for type 1 diabetes was used in a recent study performed using the GPRD.12
Type 2 diabetes: patients with an unspecific code of diabetes who received no drug therapy, or who were prescribed an oral antidiabetic treatment for a long period (at least 1 year).
Based on these criteria, of the 42 642 incident cases, 1256 were classified as type 1 and 41 386 as type 2.
Data were collected on patterns of treatment and weight and height within 1 year of diagnosis date for incident cases in order to evaluate temporal changes in these parameters. Body mass index (BMI) was calculated by dividing the weight values by the square of the height values (kilograms/metre2), for patients with that information (70% had values in 1996 and 92% in 2005).
RESULTS
The prevalence of diabetes increased linearly from 1996 to 2005 (fig 1). There was an average increase of 4.9% per year with an overall increase of 54% across the 10-year period (from 2.8% in 1996 to 4.3% in 2005). The prevalence in males was approximately 29% higher than in females; this remained relatively constant during the study period. The prevalence of diabetes also increased linearly with age; we found a prevalence of 0.4% in individuals aged 10–19 years compared with a prevalence of 17% in individuals aged 70–79 years. The prevalence of type 1 and type 2 diabetes increased to a variable extent across the study period. The prevalence of type 1 diabetes increased by 24% (from 0.33% in 1996 to 0.41% in 2005), while the prevalence of type 2 diabetes increased by 58% (from 2.47% in 1996 to 3.9% in 2005).

Combined prevalence of type 1 and type 2 diabetes from 1996 to 2005.
The overall incidence of diabetes was 2.71 (95% CI 2.58 to 2.85) per 1000 person-years in 1996 and 4.42 (95% CI 4.32 to 4.53) per 1000 person-years in 2005, representing an increase of 63% across the study period (p<0.001); an increase of 60% in males and 66% in females. The incidence of diabetes increased with age and was similar for both males and females until the age of 40 years, after which men had a higher incidence than women (fig 2).
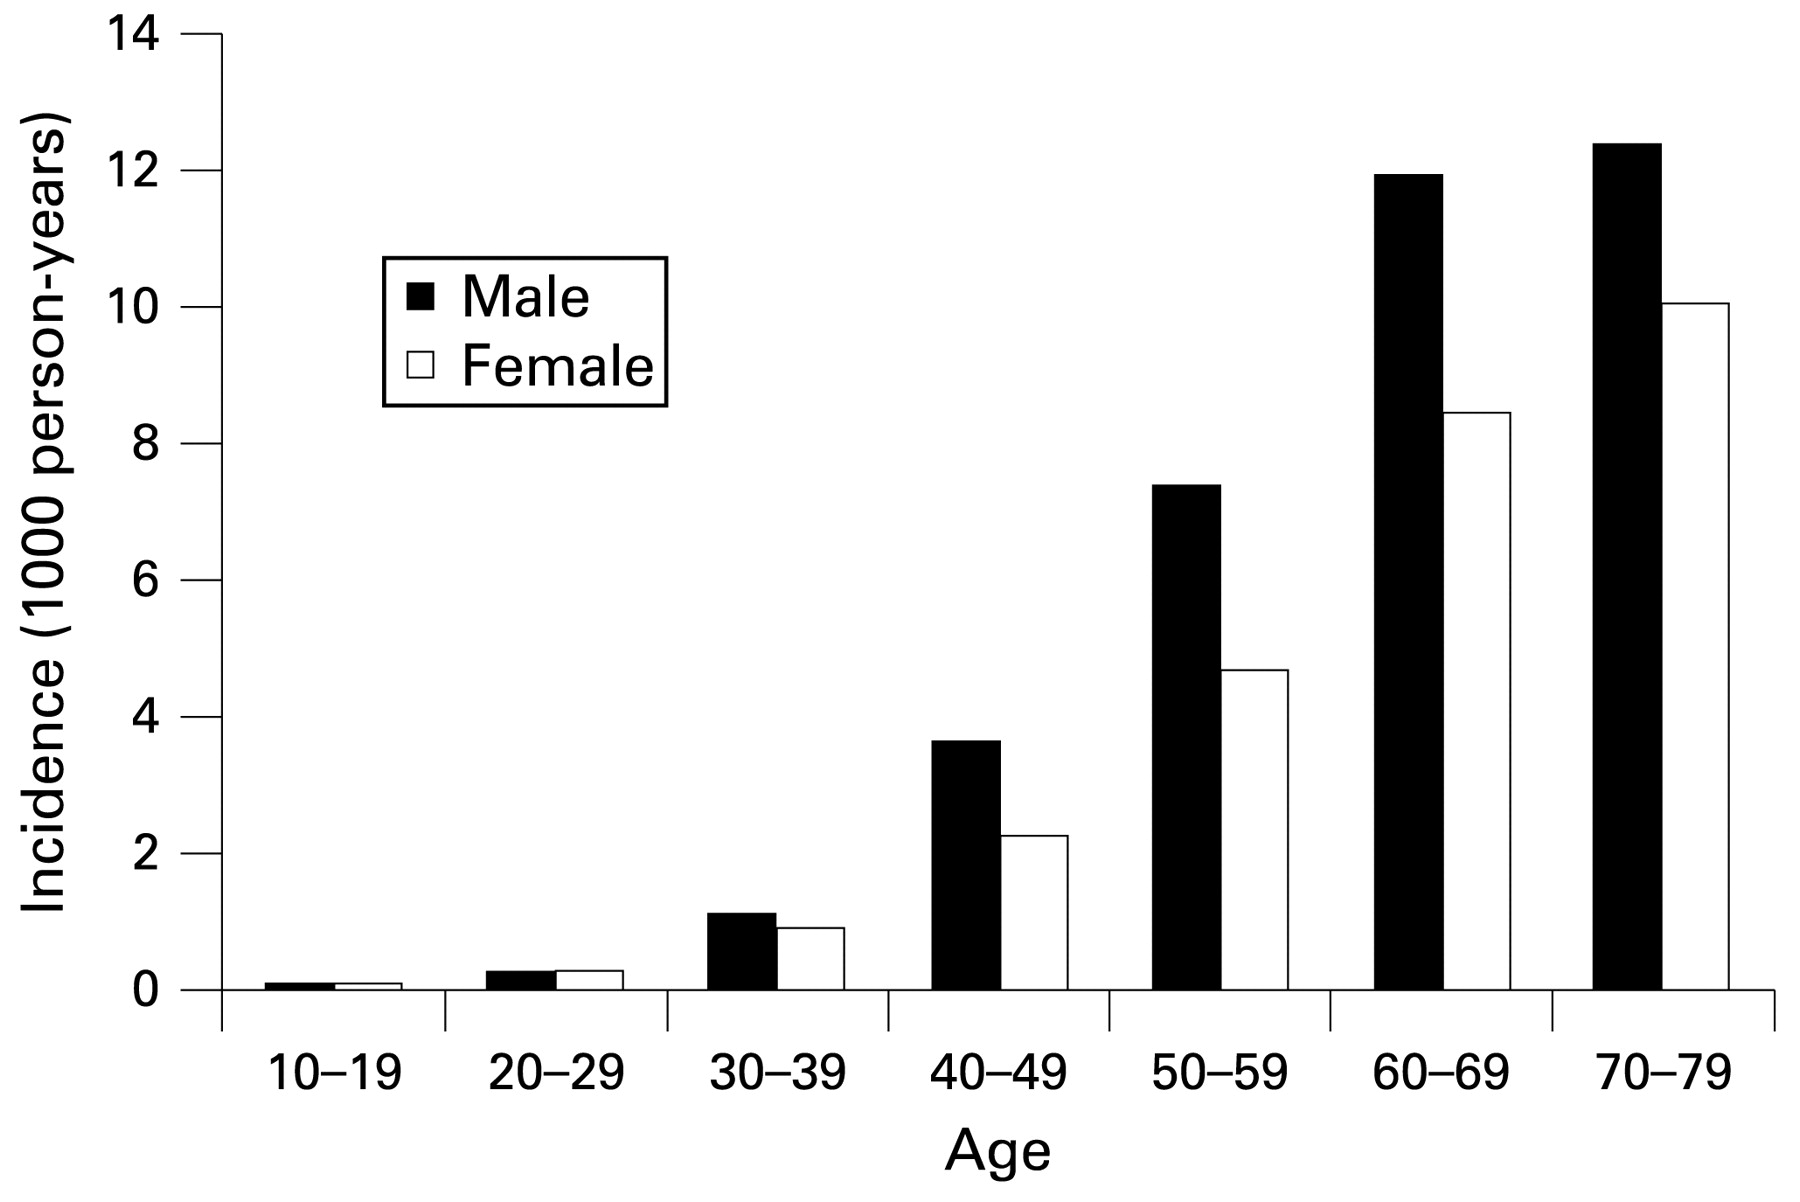
Combined incidence of type 1 and type 2 diabetes by sex and age.
The incidence of type 1 diabetes was approximately 0.13 (95% CI 0.12 to 0.14) per 1000 person-years throughout the study period with 0.16 (95% CI 0.15 to 0.17) per 1000 person-years in males, and 0.10 (95% CI 0.09 to 0.11) per 1000 person-years in females. The incidence in males aged 10–19 years was 0.35 (95% CI 0.31 to 0.39) per 1000 person-years, compared with 0.26 (95% CI 0.22 to 0.30) per 1000 person-years in females in the same age group.
The incidence of type 2 diabetes was 4.23 (95% CI 4.19 to 4.27) per 1000 person-years: 4.86 (95% CI 4.80 to 4.92) per 1000 person-years in males and 3.66 (95% CI 3.61 to 3.71) per 1000 person-years in females. Over the course of the study period the incidence of type 2 diabetes rose from 2.60 (95% CI 2.47 to 2.74) per 1000 person-years to 4.31 (95% CI 4.21 to 4.42). This represents an increase of 66% (69% in females and 63% in males) (fig 3). In 1996, 38% of individuals newly diagnosed with type 2 diabetes were overweight (BMI 25–29.9 kg/m2) and 46% were obese (BMI⩾30 kg/m2). In 2005, the corresponding proportions were 32% and 56% respectively.

Incidence of type 2 and type 1 diabetes from 1996 to 2005, age and sex standardised.
Only a minority of patients with type 2 diabetes were treated with insulin (see table 2), and levels of insulin treatment did not change dramatically over the course of the study period. In 1996, sulphonylureas were the most commonly used treatment among both prevalent and incident cases of type 2 diabetes. However, by 2005 the use of sulphonylureas had decreased considerably, and there had been a parallel increase in treatment with metformin and glitazone (tables 1 and 2).
The vast majority of patients with type 1 diabetes were treated with insulin, a minority were also treated with metformin, sulphonylureas or glitazone (table 1). Treatment of type 1 diabetes with metformin increased across the study period, in both incident and prevalent cases, while treatment with sulphonylureas decreased. In 1996, no patients with type 1 diabetes were treated with glitazone; however, by 2005 it was being prescribed to a small number of patients.
CONCLUSIONS
We found a higher prevalence of diabetes in the UK than has been reported in some previous studies. Newnham and colleagues1 studied the prevalence of diabetes using the GRPD and found lower rates than the present study despite using a similar source of information. They found a prevalence in 1998 of 2.4% in men and 2.0% in women, compared with our findings in that same year of 3.5% and 2.7% respectively. A second UK study, which was based on the Doctors’ Independent Network (DIN) database, reported a prevalence of type 2 diabetes of 2.7% in men and 2.3% in women in 2001.6 Differences in the reference panels of THIN and the DIN can partly explain the variation in comparison with our study. THIN contains data from over 300 physician practices whereas the DIN contains data from 142, only 74 of which were used by the study investigators.
However, our results are similar to those found in the 2003 Health Survey for England.13 This study questioned 14 836 adults aged 16 years and over and 3717 children aged 0–15 years from 13 680 randomly selected households in England. The prevalence of self-reported, doctor-diagnosed diabetes was 4.3% in men and 3.4% in women. This is very similar to the levels of 4.5% in men and 3.5% in women found in the same year in our study.
The prevalence of diabetes in the UK appears to be lower than that in Canada, and also to be increasing at a slower rate. We found an overall increase of 54% (from 2.8% to 4.3%) in the prevalence of diabetes in the UK between 1996 and 2005. However, a Canadian study, which used a validated diabetes database from the province of Ontario covering individuals aged 20 and above, found an increase of 69% (from 5.2% to 8.8%) between 1995 and 2005.14 The difference in increase between Canada and the UK could be due to differences in lifestyle between the study populations and to the small differences in studied age groups.
We found that, over the past decade in the UK, the prevalence of diabetes has increased by 54% and the incidence has increased by 63%. The incidence of type 1 diabetes has remained relatively constant over this time period; therefore, this increase in incidence is almost entirely due to an increase in type 2 diabetes. It is unlikely that this increase is a result of the ageing of the population during the study period, as we standardised by age and sex and differences remained statistically significant. In a study using the GPRD, Ryan and colleagues9 found that the ageing population accounted for only a small proportion of the increase in the incidence of diabetes that they observed. The increase also cannot be explained by increased screening of newly registered patients during the study period as all individuals included in the study were registered with a PCP for at least 2 years prior to commencement of the study. It, therefore, seems likely that the observed increase in the incidence of diabetes is related to the increase in obesity which has been seen across the same time frame.15 Over the course of the current study, the proportion of patients newly diagnosed with type 2 diabetes who were obese increased by 21.7%. The link between concurrent increases in obesity and type 2 diabetes has also been reported by several other studies. Drivsholm and colleagues16 suggested that the increase in the prevalence of age-specific diabetes of 58% in men and 21% in women that they observed in Denmark between 1974/5 and 1996/7 could be fully explained by a concurrent increase in BMI.
We considered the possibility of outcome misclassification in our study. However, the information in THIN database is directly entered by the PCP, so we assumed that the number of errors in a diagnosis as common as diabetes should be low. In addition, we reviewed information from consultant referrals, as well as hospital admissions within 1 year of the initial recorded diagnosis that were instrumental in determining the exact diagnosis.
A study of 114 281 women aged 30–55 years in the USA found that the risk of diabetes in women increased with rising BMI. When compared with women with a BMI of less than 22 kg/m2, women with a BMI of 22.0–22.9 kg/m2 had an age-adjusted relative risk (RR) close to 3, those with a BMI of 24.0–24.9 kg/m2 had a RR of 5 and those with a BMI of 35.0 kg/m2 or over had a RR of almost 100.17 Risk of diabetes has also been shown to be significantly increased in individuals with substantial (>10%) weight gain over a 5-year period (RR 1.76; 95% confidence interval 1.16 to 2.67).18 Our results of a greater proportion of patients with diabetes with BMI >30 in the last years of our study period tend to support the hypothesis that obesity is one of mechanisms driving the increasing epidemic of type 2 diabetes.
Our results suggest that, although the incidence of diabetes remains lower in the UK than in the USA or Canada, it appears to be increasing at a faster pace. We found an increase of 74% in the incidence of diabetes in the UK between 1997 and 2003 (from 2.84 to 4.66 per 1000 person-years). Across the same time frame, Geiss and colleagues19 used data from the National Health Interview Survey to show an increase of 41% (from 4.9 to 6.9 per 1000 person-years) in the incidence of diabetes among US adults aged 18–79 years.
Levels of type 1 diabetes in individuals aged 19 years or younger seem to be broadly comparable in the USA and the UK. We found an incidence of type 1 diabetes of 0.28 per 1000 person-years in individuals aged 10–19 years from 2002 to 2004. A US study found an incidence of 0.24 per 1000 person-years in individuals aged 0–17 years from Colorado during this period.20 In accordance with our results, Östman et al21 reported an increased incidence of type 1 diabetes in the Swedish population from 1983 to 2002 among individuals aged 15–34 years, close to 0.13 per 1000 (0.16 in males and 0.09 in women), which is almost exactly the same as our results.
Further research is needed to clarify the potential links between the rising incidence of diabetes and the rising incidence of obesity because changing criteria over time could have influenced our findings. It would also be interesting to investigate further the links between diabetes and other lifestyle factors and comorbidities. Our study confirms that the prevalence and incidence of diabetes have increased in the UK over the past decade. This increase can be mainly explained by the increase in type 2 diabetes and its probable association with obesity. Finally, in the last 10 years there was also a change in treatment pattern from sulphonylureas to metformin.
What is already known on this subject
No longitudinal studies have investigated the incidence of type 1 and type 2 diabetes separately in the UK in recent years. Therefore, there are limited data on the relative contributions of each type of diabetes to the increase in diabetes incidence.
Few studies have examined the pattern of treatment for type 1 and type 2 diabetes in recent years. There is also very little information on how this trend has developed in the new millennium.
What this study adds
This is the first observational longitudinal study that investigated the incidence of type 1 and type 2 diabetes separately in the UK.
There are limited data on the relative contributions of each type of diabetes to the increase in diabetes incidence.
Our study confirms that the prevalence and incidence of diabetes have increased in the UK by 2.8% in 1996 to 4.3% in 2005, and 2.7 per 1000 person-years in 1996 to 4.4 per 1000 person-years in 2005.
This increase can be mainly explained by the increase in type 2 diabetes and its probable association with obesity.
In the last 10 years there was also a change in pattern of drug use from sulphonylureas to metformin.
Acknowledgments
We would like to thank Dr Catherine Hill of Oxford PharmaGenesis Ltd for her editorial assistance. This study was funded by a research grant from AstraZeneca R&D Mölndal, Sweden.
REFERENCES
Footnotes
Competing interests: None.
Funding: This study was funded by a unrestricted research grant from AstraZeneca R&D Mölndal, Sweden.
Ethics approval: Ethics approval was received from the Multi-centre Research Ethics Committee (MREC)UK-MREC-South-East.
Linked Articles
- PostScript