Article Text

Abstract
Objective To evaluate the effectiveness of a draft occupational health practice guideline aimed at preventing weight gain on employees' physical activity, sedentary behaviour and dietary behaviour and on body weight-related outcomes.
Methods A randomised controlled trial was performed comparing guideline-based care to usual care among 16 occupational physicians and 523 employees in the Netherlands between 2009 and 2011. Occupational physicians in the intervention group followed the draft guideline by providing advice to employers on how to assess and intervene on the obesogenic work environment and conducted five face-to-face behavioural change counselling sessions with employees to improve their lifestyle. Data of employees were collected by questionnaire and physical measurements at baseline and 6-months follow-up. Linear and logistic regression analyses were performed to determine effects.
Results The intervention showed significant effects on sedentary behaviour at work (β −28 min/day, 95% CI −2 to −54) and on fruit intake (β 2.1 pieces/week; 95% CI 0.6 to 3.6). No significant intervention effects were found for physical activity, sedentary behaviour in leisure time or during weekend days, snack intake and body weight-related outcomes.
Conclusion Guideline-based care resulted in a more favourable sedentary behaviour at work and increased fruit intake but did not improve employees' physical activity, snack intake or body weight-related outcomes.
Trial registration number ISRCTN/73545254 and NTR/1190.
- Weight gain prevention
- occupational health guideline
- physical activity
- dietary behaviour
- occupational health practice
- health promotion
- health services research
- back disorders
- epidemiology
- OH services
- health surveillance
- vibration
- driving
- musculoskeletal
- disability
Statistics from Altmetric.com
- Weight gain prevention
- occupational health guideline
- physical activity
- dietary behaviour
- occupational health practice
- health promotion
- health services research
- back disorders
- epidemiology
- OH services
- health surveillance
- vibration
- driving
- musculoskeletal
- disability
What is known about this subject
Many studies support the finding that workplace-based lifestyle interventions have the potential to reduce body weight, to improve health and to reduce sick leave of employees.
The systematic provision of such interventions in occupational health is lacking.
What this paper adds
Our study provides insight in the evaluation of a draft guideline from a randomised controlled trial, showing that guideline-based care resulted in a more favourable sedentary behaviour at work and increased fruit intake but did not improve employees' physical activity, snack intake or body weight-related outcomes.
Policy implications
Following this trial, the Netherlands Society of Occupational Medicine will decide on adjusting and (after authorisation) implementing the draft guideline among occupational health services in the Netherlands.
Introduction
Over 30% of the working population in the Netherlands is overweight, predisposing them to chronic health problems such as cardiovascular diseases and type 2 diabetes.1–3 Preventing weight gain, through the promotion of physical activity and a healthy dietary behaviour, is thus an important public health goal.4 The workplace provides good potential for preventing overweight and obesity, as a substantial amount of daily calories are consumed in the work setting, and opportunities exist to provide health-related information and support regular physical activity.5 Workplace-based lifestyle interventions have the potential to reduce body weight, to improve health and to reduce sick leave of employees.6–9 The systematic provision of such interventions in occupational health, however, is lacking.10
More employers now recognise the need to intervene on the growing population of employees at risk for illness due to overweight and obesity,11 also because of the unfavourable relationship between overweight and obesity and sick leave.9 Consequently, employers' willingness to conduct preventive health management is growing. In the Netherlands, occupational health services assist employers in improving working conditions and in preventing sick leave and disability at work.12 These services are provided by occupational physicians (OPs) and other occupational health and safety professionals. When implementing services, developing policies and evaluating progress, OPs should ideally incorporate evidence-based methods and strategies.13 In practice however, preventive health management often lacks systematic planning and the use of the best available evidence.14 In order to assist physicians in decisions, and subsequently improve the professional quality of OPs, a draft occupational health guideline was developed aimed at preventing weight gain.15
The effectiveness of this draft guideline is evaluated in a randomised controlled trial10 comparing guideline-based care to usual care. Specific programme objectives derived from the process of intervention mapping were that employees should increase their levels of physical activity, decrease their levels of sedentary behaviour, increase fruit consumption and/or reduce the energy intake derived from snacks in order to prevent weight gain. The present study examines the effectiveness of the application of the draft guideline on physical activity, sedentary behaviour and dietary behaviour, as well as on body weight-related measures (ie, waist circumference, body weight and body mass index (BMI)).
Methods
Study population
OPs were recruited by the Netherlands Society of Occupational Medicine via a direct mailing to their member registry (>2100 OPs). OPs were asked to recruit one or more companies of medium or large size (>100 workers). Next, OPs recruited employees via a health risk appraisal consisting of anthropometric measurements and a subsequent health advice. Inclusion criteria for the present study were unhealthy levels of daily physical activity or dietary behaviour (ie, no compliance to public health physical activity or nutrition recommendations)16–18 and/or being overweight (ie, waist circumference >80 cm for women and >94 cm for men), able to complete a Dutch questionnaire at baseline, not on sick leave for more than 21 days, not pregnant or having a disease or condition that would make physical activity impossible. Details of the study design have been published elsewhere.10 The study protocol was approved by the Ethics Committee of the VU University Medical Center and all participants signed informed consent. The trial was registered at ISRCTN/73545254 and NTR/1190.
Randomisation, blinding and sample size
OPs who consented to participate were randomly assigned to the intervention or control group by an independent researcher using Random Allocation Software (V.1.0; Isfahan University of Medical Sciences). After randomisation, the principal researcher notified OPs to which group they were allocated. As OPs themselves were the intervention providers, they could not be blinded for allocation. OPs were asked not to reveal their group to employees or assistants performing measurements. The sample size of workers was calculated according to the number of cases needed to identify an effect on waist circumference. An a priori power calculation to detect a difference of 1.5 cm (SD 4.5 kg)19 with 80% power and an α of 5% determined that 175 employees per group were needed at follow-up. Taking a loss to follow-up of 20%–40% into account and clustering of employees within OPs (intraclass correlation of 0.20), a total of 600 employees among 20 OPs were required at baseline.10
Intervention and control group
OPs in the control group were asked to provide care as usual, which generally consisted of the health risk appraisal with anthropometric measurements and a subsequent health advice. OPs in the intervention group were asked to provide guideline-based care.
The draft occupational health guideline was developed according to the protocol of the Netherlands Society of Occupational Medicine and the Intervention Mapping protocol.20 21 Based on literature, interviews with relevant stakeholders and consensus among an expert group, three sections were distinguished in the guideline: (a) prevention at the environmental level (advice for the employer), (b) prevention at the individual level (advice for the employee) and (c) evaluation and maintenance of previously mentioned sections.
With regard to prevention at the environmental level, an environment scan was developed for OPs to discuss with employers, at baseline and at 6-month follow-up. The environment scan consists of an overview of environmental risk factors from the literature that could contribute to preventing weight gain (eg, availability of bike sheds and shower facilities, pricing strategies in cafeteria). Based on this overview, environmental goals could be prioritised, and feasibility and barriers for implementation could be discussed with the employer and with the workers' representative council.
With regard to prevention at the individual level, a minimal intervention strategy was developed for OPs on how to promote employees' healthy lifestyle in five 20–30 min counselling sessions during 6 months. For this purpose, OPs were trained during 2 days in applying behavioural change counselling, an adapted form of motivational interviewing suitable for brief consultations in healthcare settings.22
In the first counselling session, after having discussed their risk profile and current health status, employees could choose which target behaviour they would like to discuss (increasing physical activity, decreasing sedentary behaviour, increasing fruit consumption or reducing the energy intake derived from snacks). Next, ambivalence and motivation for change was assessed by discussing pros and cons of behaviour change and willingness, importance and perceived confidence to change behaviour. OPs then moved employees towards a decision balance and increased perceived behavioural control by asking employees to formulate maximally three implementation intentions. Last, employees set short- and long-term goals. In subsequent sessions, progress and barriers were discussed and short-term goals could be adjusted. No specific weight loss advice was provided, as the guideline aimed to prevent weight gain by improving employees' physical activity and healthy dietary behaviour. To monitor their behaviour, employees were provided with a toolkit containing a waist circumference measure tape, a pedometer, leaflets on physical activity and nutrition from the Dutch Heart Foundations and the Netherlands Nutrition Centre and a diary to monitor behaviour.
Participants who missed an appointment were reminded by OPs and the research team to make a new appointment. A maximum of five efforts over the course of 2 months was made to remind non-responders by phone, email and regular mail.
Outcome measures
Outcome measures of the study were physical activity, sedentary behaviour, dietary behaviour and body weight-related outcomes (ie, waist circumference (cm), body weight (kg) and BMI (kg/m2)), assessed at baseline and 6-months follow-up. Behavioural outcomes (ie, physical activity, sedentary behaviour and dietary behaviour) were assessed by questionnaire. Waist circumference, body weight and body height were measured by unblinded OPs (n=5 out of 7 in the intervention group and n=6 out of 9 in the control group) or by blinded clinic employees.
Physical activity
Daily physical activity was measured with the Short QUestionnaire to ASsess Health enhancing physical activity (SQUASH) (reproducibility r=0.58; validity r=0.45).23 The SQUASH assesses activities across 4 domains: (1) commuting activities (walking and cycling to or from work), (2) physical activity at work, (3) household activities and (4) leisure time activities (walking, cycling, gardening, chores and sports). Participants recalled the number of days per week spent on each activity during an average week in the past month and the number of minutes per day and the intensity of each activity. Total levels of physical activity were calculated as the minutes per week of moderate and vigorous intensity physical activity. Also, two questions were related to the public health physical activity recommendations.16 17 These included questions on the number of days per week that moderate intensity activities were performed (such as walking and cycling) for at least 30 min, and the frequency of vigorous intensity leisure-time activities per week (‘which make you sweat’) that were performed at least 20 min.
Sedentary behaviour
Sedentary behaviour was assessed for work and leisure time, on week and weekend days using a questionnaire that has not yet been tested for validity. Sedentary behaviour at work was asked for the average number of minutes per day during the last 7 days spent on computer use, meetings and other activities. Leisure time sedentary behaviour was asked for the average number of minutes per day during the last 7 days spent watching TV, computer use and other activities.24 Total levels of sedentary behaviour were asked following the sedentary activity domain of the generic IPAQ, as the average time spent sitting on a weekday and weekend day during the last 7 days.25 The reliability of the long questionnaire form for the Netherlands is good (Spearmans' ρ=0.87).
Dietary behaviour
Fruit intake was assessed with the validated Short Fruit and Vegetable questionnaire (validity r=0.50)26 as the number of daily servings of fruit per week. Fruit intake was related to the public health recommendation of consuming two or more pieces of fruit per day.18 The consumption of energy-dense snacks was assessed using the fat list (validity r=0.70)27 as the number of daily servings of snacks per week. Snacks were distinguished in seven categories, namely peanuts, chips, cakes, candy bars, biscuits, other cookies and large snacks.
Weight-related measures
Waist circumference was measured as midway between the lower rib margin and the iliac crest to the nearest 0.1 cm. Participants were measured in standing position without heavy outer garments and with emptied pockets, breathing out gently.28 To standardise waist circumference measurement, OPs or assistants were provided with a Seca 201 waist circumference measuring tape (Seca, Hamburg, Germany). As it was not possible to blind OPs, control measurements were performed by independent researchers in a random sample of 76 workers at baseline and 6-months follow-up (8% of all measurements). Additionally, self-reported waist circumference was assessed from 412 employees at 6-months follow-up (91%) using a non-stretchable paper measuring tape (range 0–130 cm) and written measurement instructions. The difference between OP measured and independent researcher measured waist circumference ranged from −12 to 6 cm. No difference was found between intervention OPs and independent researchers (n=32; 0.2 cm SD=1.7; p=0.5), but significant under-reporting was found by control OPs compared with independent researchers (n=44; −2.2 cm SD=3.6; p<0.01). The difference between OP measured and self-reported values ranged from −18 to 22 cm. Compared with OPs, both intervention and control employees significantly under-reported their waist circumference by −1.5 cm (n=210; SD=3.9; p<0.01) and −1.4 cm (n=202; SD=3.4; p<0.01).
Body weight (kg) and body height (cm) were measured with the participants standing without shoes and heavy outer garments. Participants were asked to push their heels softly to the wall or the back of the stadiometer. BMI was calculated from measured height and weight as kilograms per square meter.
Statistical analyses
Intervention and control OPs were checked for baseline differences for demographic characteristics (age, gender, years working as an OP), behaviour-related variables (physical activity, dietary behaviour, smoking and alcohol use) and job-related characteristics of their worker population (blue and/or white collar population, experience with counselling on lifestyle, prevention or according to guidelines). Moreover, differences on these variables were checked for study completers and OPs lost to follow-up.
Intervention and control employees were also checked for baseline differences for several characteristics and outcome variables. To determine the effects of the draft guideline at 6 months, linear multilevel regression analyses were performed with the variable of interest as the outcome and group allocation and its baseline value as the independent variables. Due to the randomisation at OP level, multilevel analysis were performed in order to adjust for the possible dependency of participants' observations within OPs.29 30 Next, change in waist circumference and body weight was dichotomised as increased (reference category=0) and maintained or decreased (1) and analysed with logistic multilevel analyses using a second-order predictive quasi-likelihood method. Finally, compliance (yes or no) to meeting public health guidelines for physical activity and fruit intake was assessed with logistic multilevel regression analyses. Analyses were checked for potential confounders: age, gender and irregular work hours. Confounding was assigned when >10% change occurred in the regression coefficient. Effect modification was considered for age, gender and BMI measured at baseline, using a p value <0.10 of the interaction term to indicate effect modification. p Values <0.05 were considered to be significant. All analyses were performed using SPSS software (V.15.0) and MLwiN (V.2.18).
Results
Participants
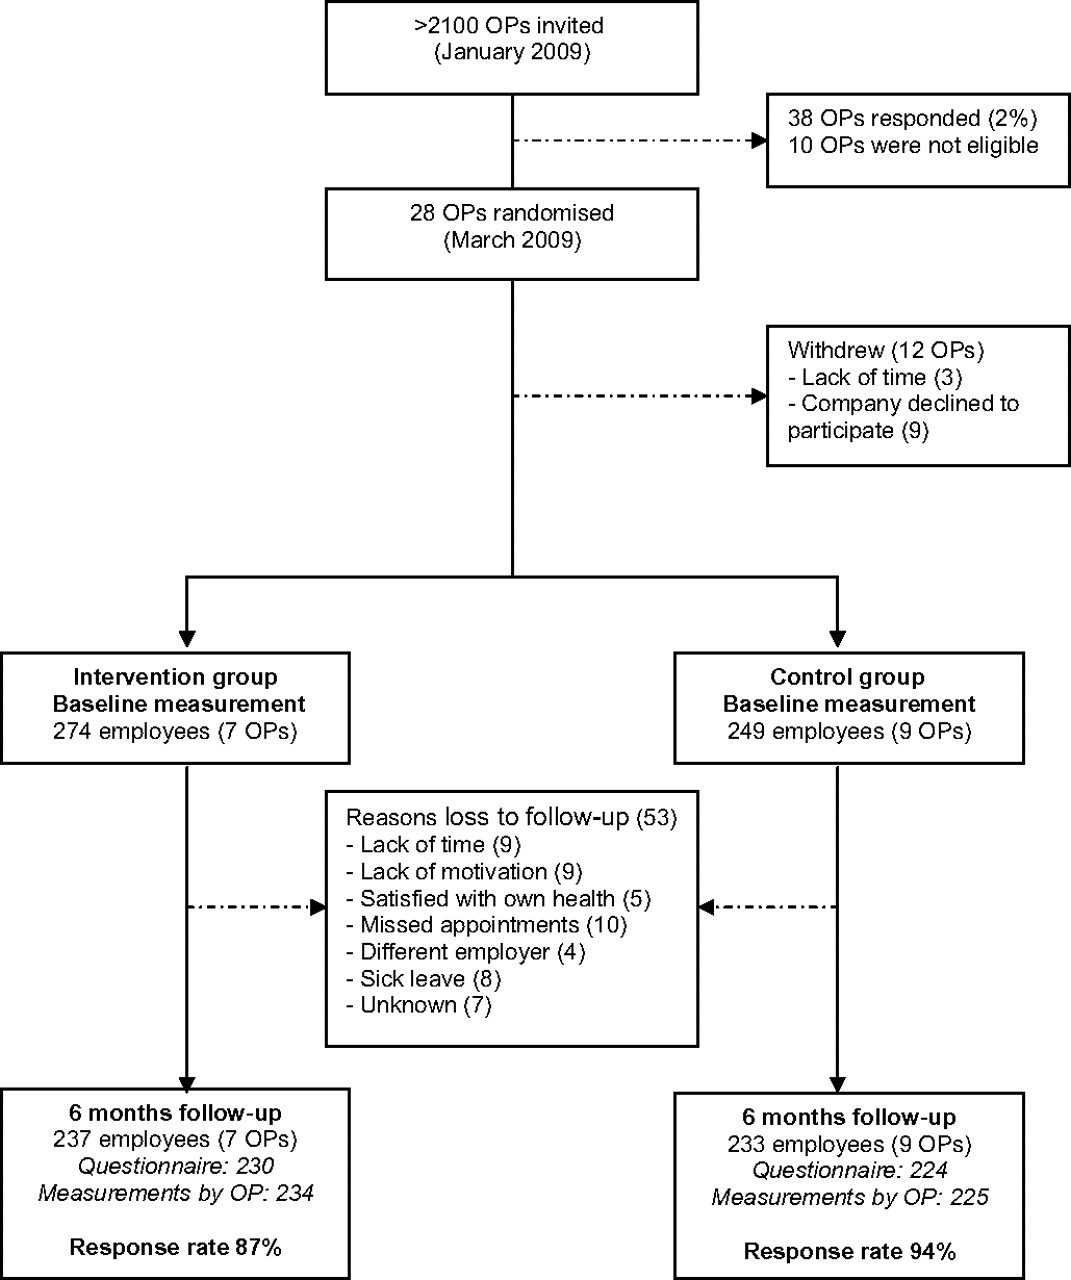
The flow chart of the participants is presented in figure 1. After recruitment, 38 OPs expressed an interest to participate. Ten OPs were excluded because they did not meet inclusion criteria or their company refused to participate. Thus, 28 OPs were randomised. Between randomisation and the baseline measurement, 12 OPs withdrew due to a lack of time, their company withdrew or their company cancelled the project due to the economic crisis. Therefore, the Balance@Work project started with seven OPs in the intervention group and nine OPs in the control group. No significant differences were found between OPs that completed the study and OPs who withdrew between randomisation and baseline on demographic, behaviour-related or job-related characteristics of their worker population. Moreover, intervention OPs did not differ significantly from control OPs at baseline. During the 6-month intervention period, none of the OPs were lost to follow-up.

Flow diagram of participants in the Balance@Work study.
OPs recruited 524 participants between March 2009 and March 2010. All employees met the inclusion criteria, but one underweight subject was excluded from analyses because of having a weight gain goal. Baseline characteristics of the two study groups are described in table 1. Intervention employees differed significantly from control employees on two characteristics at baseline and intervention subjects were younger (46 vs 48 years) and worked less irregular work hours (19% vs 29%). During the 6-month intervention period, subjects from both groups were lost to follow-up (n=37 in the intervention group and n=16 in the control group). These subjects (n=53) were significantly younger, women and had a lower income than study completers.
Baseline characteristics of the study population by treatment group
Intervention effects
Physical activity
Table 2 presents the values for moderate, vigorous and total levels of physical activity for baseline and 6 months follow-up, as well as the results of the linear regression analyses. No statistically significant intervention effects were found for moderate, vigorous and total levels of physical activity. The intervention effect on moderate physical activity was modified by BMI. Obese intervention group participants (BMI ≥30; n=120) significantly increased their moderate intensity physical activity compared with obese controls (β 150 min/week, 95% CI 24 to 276). Normal weight (BMI <25; n=134) and overweight (BMI ≥25; n=193) intervention participants did not significantly change in moderate intensity physical activity (β 20 min/week, 95% CI −76 to 116 and β −33 min/week, 95% CI −136 to 79, respectively).
Physical activity, sedentary behaviour, dietary behaviour and body weight-related measures at baseline and follow-up, by treatment group
The results for meeting public health guidelines of moderate and vigorous intensity physical activity are presented in figure 2. No significant intervention effects were found for meeting these physical activity guidelines.

Change in meeting public health guidelines for physical activity and fruit intake.
Sedentary behaviour
No significant intervention effect was found for total levels of sedentary behaviour, although both groups slightly decreased in their total sitting time (−57 vs −15 min/day) (table 2). No effects were found for sedentary behaviour in leisure time, but the intervention group significantly reduced sedentary behaviour at work on weekdays compared with the control group (β −28 min/day, 95% CI −54 to −2).
Dietary behaviour
A statistically significant increase was found in fruit intake as a result of the intervention (table 2). Participants in the intervention group consumed 1.5 more pieces of fruit per week, while participants in the control group decreased their fruit intake by almost 1 piece of fruit per week (β 2.1; 95% CI 0.6 to 3.6). No significant effect was found for meeting the public health recommendation of consuming two or more pieces of fruit per day (figure 2). Moreover, no significant effects were found on total snack intake and intake per snack.
Body weight-related measures
The intervention did not result in significant effects on waist circumference, body weight and BMI (table 2). Both study groups showed slight decreases in these variables but yielded no difference between groups. The intervention effect on waist circumference was modified by gender and BMI. Waist circumference reduced among women in the intervention group compared with women in the control group (n=295; β −0.8 cm, 95% CI −2.6 to 1.1) and increased among men in the intervention group compared with men in the control group (n=160; β 1.7 cm, 95% CI −0.3 to 3.7), but these differences were not significant. Moreover, waist circumference reduced among normal weight participants in the intervention group compared with normal weight controls (n=134, β −1.4 cm, 95% CI −2.8 to 0), did not change among overweight participants (n=198; β 0 cm, 95% CI −1.3 to 1.3) but significantly increased among obese intervention participants compared with obese controls (n=123; β 2.6 cm, 95% CI 0.7 to 4.5). Finally, no significant difference was found between groups among participants who had maintained or decreased versus those who had increased their waist circumference and body weight (OR 0.9, 95% CI 0.5 to 1.3; OR 1.0, 95% CI 0.6 to 1.6, respectively).
Discussion
The aim of this study was to evaluate the effectiveness of a draft occupational health practice guideline aimed at preventing weight gain among employees in the Netherlands in a randomised controlled trial. At 6 months, the draft guideline was effective in obtaining a more favourable sedentary behaviour at work (−15 vs −3 min/day) and in increasing fruit intake (+1.5 vs −0.8 pieces/week). No significant effects were found on physical activity, total or leisure-time sedentary behaviour, snack intake and body weight-related outcomes.
The lack of effect on total levels of sedentary behaviour is in line with a recent systematic review of six studies.31 The assessment of domain-specific sedentary behaviour in our study has thus proven useful to detect the intervention effect on sedentary behaviour at work. However, as the work and leisure time domains were assessed using a questionnaire that has not yet been tested for validity, our results should be interpreted with caution. Moreover, the clinical relevance of our finding is unknown.31
Previous studies have shown that sitting is negatively associated with health,32–35 especially in extended periods of sitting.36 It may therefore be reasonable to assume that benefits occur along a continuum, with greater reductions in sedentary behaviour associated with increased benefits. The low precision of detecting effects via self-reported measures however remains an issue of concern.37 Future studies may benefit from using objective measures for a more accurate assessment of sedentary behaviour, such as tri-axial accelerometers or heart rate monitoring. Nevertheless, objective measures should be used in addition to subjective measures, as they do not distinguish between activities in different domains.37 Clearly, more research is needed on ways to effectively reduce sedentary behaviour at the workplace and to identify what change is clinically relevant.38 39
In line with other studies, fruit intake increased as a result of the intervention through education and counselling of participants.40–43 This change is relevant according to the WHO, who states that there is convincing evidence that a diet high in fruit and vegetables reduces the risk of obesity, diabetes and cardiovascular disease.4 More recently, others have shown that a minimal intervention, such as providing free fruit at the workplace, increases average fruit intake44 and may decrease body weight.45 As fruit consumption has declined in the Netherlands,18 we recommend increasing workplace fruit availability and accessibility as an effective low-cost alternative in the guideline besides education and counselling.
The lack of effect on physical activity outcomes and snack intake contrasts several reviews that concluded significant positive effects for physical activity and fat intake.40 46 47 Moreover, the lack of an effect on body weight-related outcome measures is not in line with two recent meta-analyses of workplace physical activity and nutrition interventions, which concluded moderate evidence for a net weight loss of −1.3 and −1.2 kg and a net decrease in BMI of −0.5 and −0.3 kg/m2, respectively.6 48 Several possible explanations for our small non-significant findings can be considered.
First, the fact that our study used a population approach (ie, primary prevention) instead of a high-risk approach (ie, secondary prevention) may have led to the small effects because less health gains may be expected in a relatively healthy population. A high-risk approach (ie, aimed at subjects ‘at risk’) allows for individuals to benefit more, as seen in studies among workers at risk for cardiovascular disease,8 young employees aged 20–40 years49 and among overweight and obese subjects (BMI ≥25 kg/m2).50 Population approaches however have the potential to be most (cost) effective in the long term, the so-called ‘prevention paradox’.51 Although this intervention does not appear to be cost-effective, the joint distribution of differences in cost and effects could show clear cost-effectiveness when neither cost nor effect differences are individually significant.52 These analyses will be subject of another article. In clinical practice, both approaches are needed.
Second, control employees improved as well in the present study. This may have been caused by attending the health-risk appraisal (consisting of anthropometric measurements and a subsequent health advice) and completing questionnaires, which in itself may have motivated participants to change their behaviour.53 Moreover, long-term effects need to be assessed, as intervention participants may be able to sustain behaviour change better at long-term follow-up than the control group.
Third, similar to the assessment of sedentary behaviour, the use of subjective methods for assessing physical activity and dietary behaviour may have limited the ability to detect effects. The SQUASH questionnaire may have limited value to provide accurate information on actual physical activity levels compared with the physical activity scale (PAS) 24-hour 7-day recall accelerometry and the Actiheart.54 55 Also, the use of self-reported dietary outcomes may lead to an over-estimation of effects on diet, due to reporting bias.40 Nevertheless, we chose to use self-reported measures over objective measures because the latter are more time consuming, expensive, less appropriate in large intervention studies with multiple measurements per participant over time and less feasible in clinical practice. Also, there is currently no single method that can be considered the ‘gold standard’ for the assessment of overall physical activity or diet in public health settings.56 Thus, more research is needed on ways to accurately assess physical activity or diet in public or occupational health settings.
Fourth, the substantial differences between OP measured, independent researcher measured and self-reported waist circumference indicates that the accuracy of measuring waist circumference was low, especially among control OPs and employees.57 The under-reporting by control OPs indicates that the actual waist circumference of control employees may lie 2.2 cm higher. At baseline, control employees waist circumference was under-reported by −1.7 cm (n=32; 95% CI −3.2 to −0.3) and at 6 months follow-up by −3.5 cm (n=12; 95% CI −4.8 to −2.1). Thus, the change in waist circumference between baseline and follow-up may be smaller among the control group than suggested in table 2. Considering the difference with the change in the intervention group, our current results may be an underestimation. As self-reported measures tended to be less accurate, OP measured waist circumference remains the best of the two options.
Finally, process data of this study showed that counselling of intervention OPs was not performed to the full extent, and all intervention companies invested in health promotion before the trial.58 Also, although three companies showed improvements in the environment scans (such as sports groups and discounts, changes in the cafeteria due to a new caterer and provision of free fruit at work), only one OP attributed recent environment changes (ie, sport groups) to the guideline.58 Nevertheless, reach, satisfaction and attendance in general was high. Secondary analyses showed that among intervention participants, those with higher attendance (5 vs <5 counselling sessions) and satisfaction rates (8 vs <8 on a scale of 1–10) significantly improved waist circumference (−1.5 to −2.1 cm) and body weight (−0.9 to −1.4 kg).58 However, based on additional interviews, we found that participants under one intervention OP significantly gained in waist circumference and body weight, whereas waist circumference and body weight reduced among participants of the remaining intervention OPs (+3.1 vs −0.3 cm and +2.4 vs −0.6 kg). Thus, although the draft guideline was not effective on weight-related outcomes, better results may be achieved among participants with higher attendance and satisfaction rates58 and among OPs with higher guideline adherence.59
Strengths of this study are the practice-based nature and the low number of participants lost to follow-up. Moreover, the risk of contamination was minimised due to randomisation of groups at the OP level. Finally, similar co-interventions were reported among employees in the intervention and control group regarding advice from other healthcare professionals on their weight (15% and 15%), physical activity or nutrition behaviour (47% and 40%) or other subjects (33% and 44%), respectively.
There are some limitations as well. OPs were not blinded, which may have induced bias of results towards a favoured outcome.60 However, as our positive outcomes on sedentary behaviour and fruit intake were measured at the individual level, and not by OPs, bias may have been limited. Moreover, it could be argued that any intervention by physicians during 6 months may lead to effects because of the attention employees receive.53 Nevertheless, the effects on fruit and sedentary behaviour were specific goals of the intervention and may thus be due to the intervention. Also, sitting during transport was not included in our study because we did not expect to find an effect on transport sitting, as this was not a goal of our intervention. Finally, participants lost to follow-up were significantly younger, women and had a lower income, but this did not differ significantly between the intervention or control group.
In conclusion, guideline-based care resulted in a more favourable sedentary behaviour at work and an increased fruit intake but did not result in effects on physical activity, total or leisure-time sedentary behaviour, snack intake and weight-related outcomes. Although the draft guideline was not effective on all outcome measures, our results provide good direction for adjustments that should be made to the guideline before implementation. For example, it would be useful to examine ways to increase guideline adherence among OPs and enhance attendance and satisfaction rates among participants, as this may pay off in effects. Also, more research is needed on which subjective and objective instruments are most appropriate for public health research.
References
Footnotes
Funding This study is funded by The Netherlands Organisation for Health Research and Development (ZonMw, project 120510007).
Competing interests None.
Ethics approval Ethics approval was obtained from the ethics committee of the VU University Medical Center.
Provenance and peer review Not commissioned; externally peer reviewed.